




How to Visualize Sage X3 Cloud Data in Python with pandas

The rich ecosystem of Python modules lets you get to work quickly and integrate your systems more effectively. With the CData Python Connector for Sage X3 Cloud, the pandas & Matplotlib modules, and the SQLAlchemy toolkit, you can build Sage X3 Cloud-connected Python applications and scripts for visualizing Sage X3 Cloud data. This article shows how to use the pandas, SQLAlchemy, and Matplotlib built-in functions to connect to Sage X3 Cloud data, execute queries, and visualize the results.
With built-in optimized data processing, the CData Python Connector offers unmatched performance for interacting with live Sage X3 Cloud data in Python. When you issue complex SQL queries from Sage X3 Cloud, the driver pushes supported SQL operations, like filters and aggregations, directly to Sage X3 Cloud and utilizes the embedded SQL engine to process unsupported operations client-side (often SQL functions and JOIN operations).
Connecting to Sage X3 Cloud Data
Connecting to Sage X3 Cloud data looks just like connecting to any relational data source. Create a connection string using the required connection properties. For this article, you will pass the connection string as a parameter to the create_engine function.
Sage X3 Cloud uses the OAuth 2.0 Client Credentials flow, and an X-API-Key is also required for API access. Set AuthScheme to OAuth and specify the following connection properties:
- URL: The base URL of your Sage X3 Cloud instance.
- OAuthAccessTokenUrl: The OAuth token endpoint (e.g., https://your-auth-domain/oauth/token).
- OAuthClientId: Your OAuth application client ID.
- OAuthClientSecret: Your OAuth application client secret.
- Audience: The API audience value for the token request.
- XAPIKey: The X-API-Key provided by your Sage X3 Cloud administrator.
- Folder: The Sage X3 folder name (e.g., SEED). This folder is used as the default schema.
- Folders (optional): A comma-separated list of Sage X3 folders (e.g., SEED,PERF). Each folder is exposed as a separate schema, so you can query across folders with the Schema.Table syntax.
The driver obtains an access token with the Client Credentials flow and sends it with the X-API-Key on every API request. With InitiateOAuth set to GETANDREFRESH (the default), the driver acquires and refreshes the token automatically.
Follow the procedure below to install the required modules and start accessing Sage X3 Cloud through Python objects.
Install Required Modules
Use the pip utility to install the pandas & Matplotlib modules and the SQLAlchemy toolkit:
pip install pandas
pip install matplotlib
pip install sqlalchemy
Be sure to import the module with the following:
import pandas
import matplotlib.pyplot as plt
from sqlalchemy import create_engine
Visualize Sage X3 Cloud Data in Python
You can now connect with a connection string. Use the create_engine function to create an Engine for working with Sage X3 Cloud data.
engine = create_engine("sagex3cloud:///?AuthScheme=OAuth&URL=https://x3server/&OAuthAccessTokenUrl=https://auth-domain/oauth/token&OAuthClientId=your_client_id&OAuthClientSecret=your_client_secret&Audience=https://api-audience&XAPIKey=your_api_key&Folder=SEED")
Execute SQL to Sage X3 Cloud
Use the read_sql function from pandas to execute any SQL statement and store the resultset in a DataFrame.
df = pandas.read_sql("SELECT BPCNUM, BPCNAM FROM BPCUSTOMER WHERE BPCNUM = 'MARTIN'", engine)
Visualize Sage X3 Cloud Data
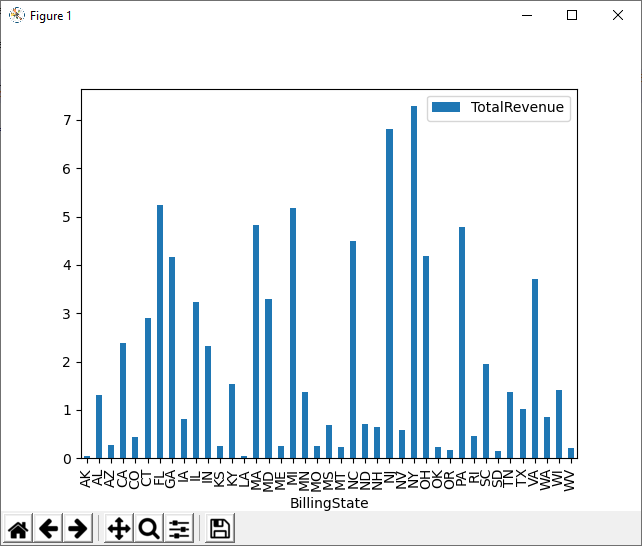
With the query results stored in a DataFrame, use the plot function to build a chart to display the Sage X3 Cloud data. The show method displays the chart in a new window.
df.plot(kind="bar", x="BPCNUM", y="BPCNAM")
plt.show()
Free Trial & More Information
Download a free, 30-day trial of the CData Python Connector for Sage X3 Cloud to start building Python apps and scripts with connectivity to Sage X3 Cloud data. Reach out to our Support Team if you have any questions.
Full Source Code
import pandas
import matplotlib.pyplot as plt
from sqlalchemy import create_engin

engine = create_engine("sagex3cloud:///?AuthScheme=OAuth&URL=https://x3server/&OAuthAccessTokenUrl=https://auth-domain/oauth/token&OAuthClientId=your_client_id&OAuthClientSecret=your_client_secret&Audience=https://api-audience&XAPIKey=your_api_key&Folder=SEED")
df = pandas.read_sql("SELECT BPCNUM, BPCNAM FROM BPCUSTOMER WHERE BPCNUM = 'MARTIN'", engine)

df.plot(kind="bar", x="BPCNUM", y="BPCNAM")
plt.show()
Ready to get started?
Download a free trial of the Sage X3 Cloud Connector to get started:
Download NowLearn more:
 Sage X3 Cloud Python Connector
Python Connector Libraries for Sage X3 Cloud Data Connectivity. Integrate Sage X3 Cloud with popular Python tools like Pandas, SQLAlchemy, Dash & petl.