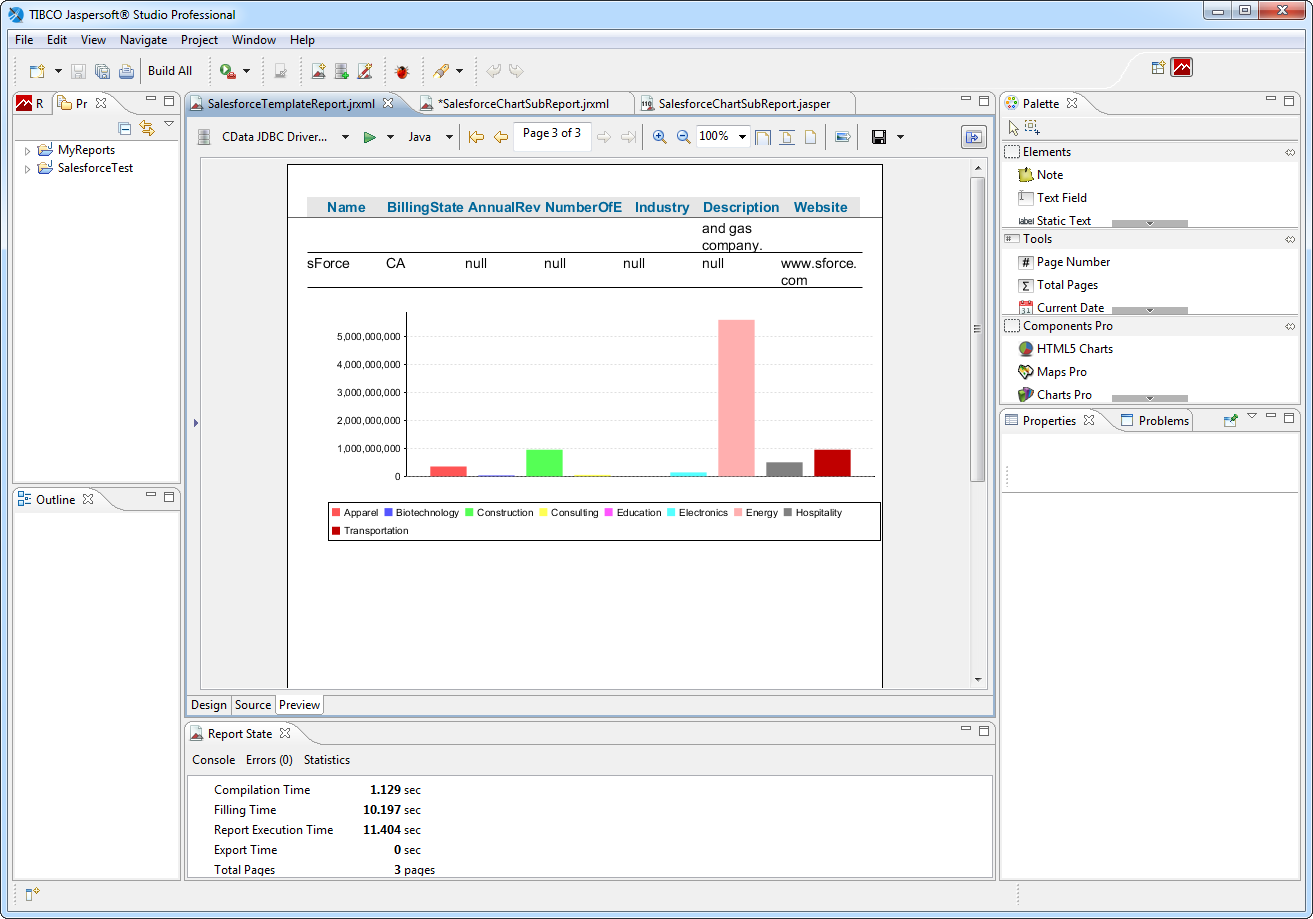
Connect to TimeCamp Data in Jaspersoft Studio

This article shows how to connect to TimeCamp from Jaspersoft Studio as a standard JDBC data source with the CData JDBC Driver for TimeCamp. You will use the standard Jaspersoft wizards to build SQL queries to TimeCamp. The queries are executed directly to the TimeCamp APIs, enabling real-time connectivity to TimeCamp data.
Connect to TimeCamp Data as a JDBC Data Source
To create a JDBC data source in Jaspersoft Studio, create a data adapter:
- In the Repository Explorer view, right-click the Data Adapters node and click Create Data Adapter.
- Select Database JDBC Connection.
- Enter a user-friendly name for the driver.
- On the Driver Classpath tab, click Add. In the resulting dialog, navigate to the lib subfolder of the installation directory. Select the driver JAR.
- On the Database Location tab, enter the class name of the JDBC driver: cdata.jdbc.api.APIDriver.
- Enter the JDBC URL.
Start by setting the Profile connection property to the location of the TimeCamp Profile on disk (e.g. C:\profiles\TimeCamp.apip). Next, set the ProfileSettings connection property to the connection string for TimeCamp (see below).
TimeCamp API Profile Settings
TimeCamp uses token-based authentication. To obtain an API Token:
- Log in to your TimeCamp account at https://app.timecamp.com
- Click your profile avatar in the top-right corner
- Select Profile Settings
- Copy the API token shown at the bottom of the page
After obtaining your API Token, set the following connection properties:
- AuthScheme: Set this to APIKey.
Set the following in the ProfileSettings connection property:
- APIKey: Set this to your TimeCamp API token.
Built-in Connection String Designer
For assistance in constructing the JDBC URL, use the connection string designer built into the TimeCamp JDBC Driver. Either double-click the JAR file or execute the jar file from the command-line.
java -jar cdata.jdbc.api.jarFill in the connection properties and copy the connection string to the clipboard.
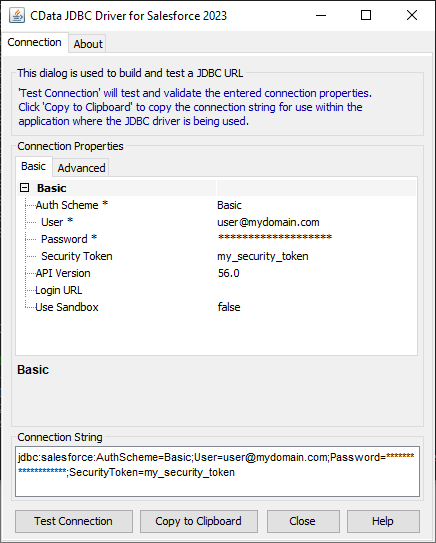
When you configure the JDBC URL, you may also want to set the Max Rows connection property. This will limit the number of rows returned, which is especially helpful for improving performance when designing reports and visualizations.
Below is a typical JDBC URL for TimeCamp:
jdbc:api:Profile=C:\profiles\TimeCamp.apip;AuthScheme=APIKey;ProfileSettings='APIKey=your_api_token';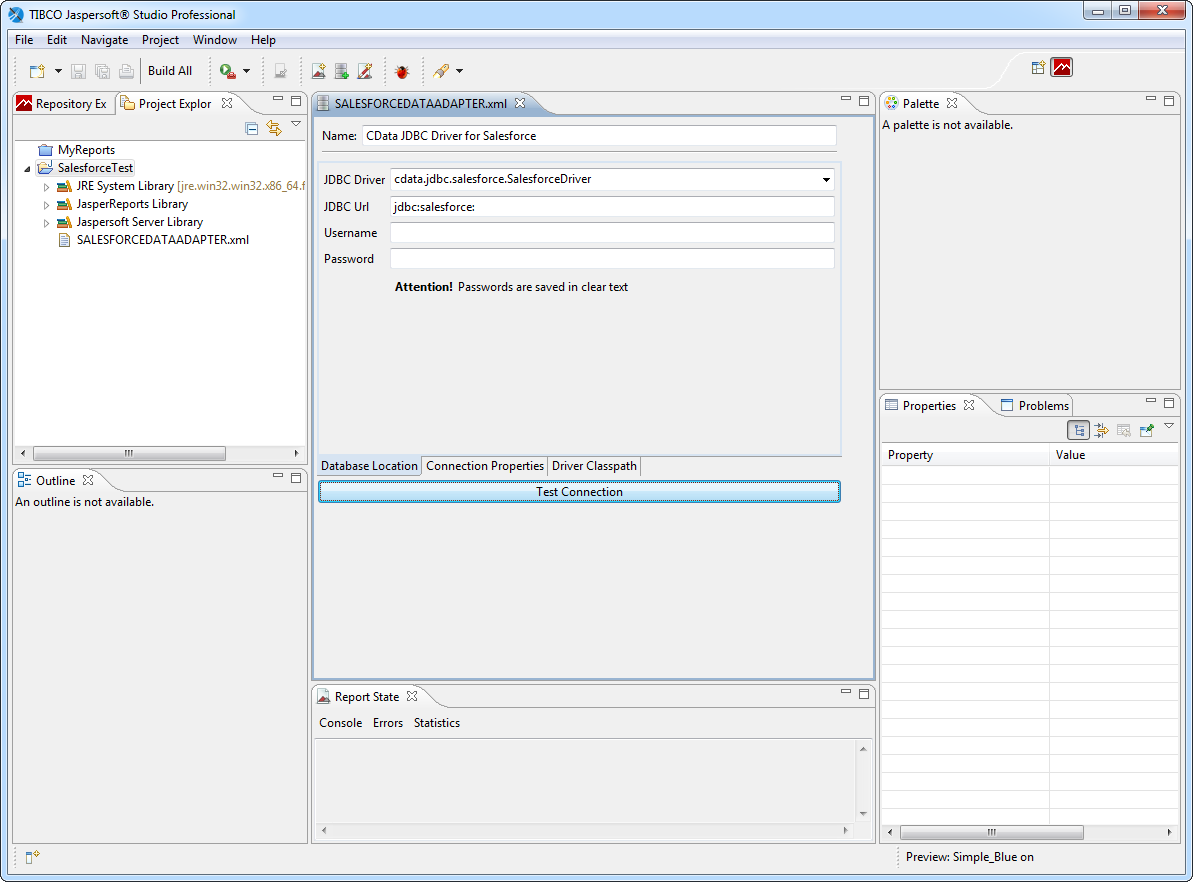
Create Reports with TimeCamp Data
Follow the steps below to build an SQL query to TimeCamp, the basis of a simple report:
- Click File -> New Jasper Report. Select a template, select the parent project, and specify the report file.
- In the Data Adapter menu, select the data adapter you created in the previous section.
- In the Diagram tab, drag tables into the box and click the columns you want. Or, enter a custom query on the Texts tab. For example:
SELECT UserId, Email FROM GroupUsers WHERE GroupId = '12345'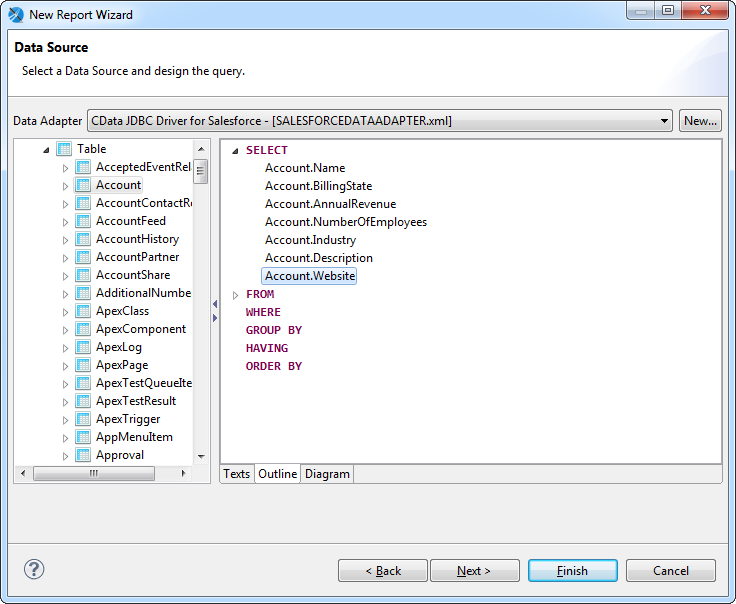
- Select the fields you want to include in the dataset. This example uses all fields.
- Skip the Group By step and finish the wizard.
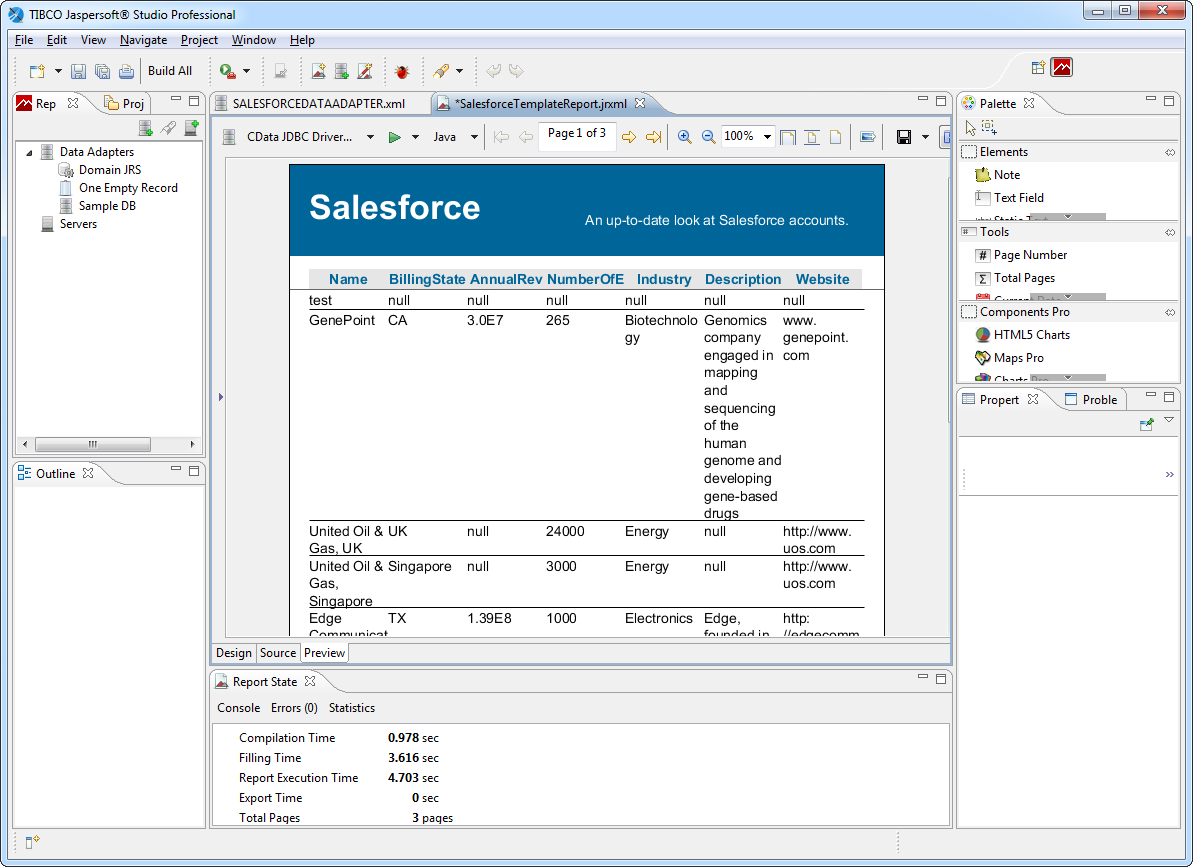
In the Preview tab, you can see the report as it would look with the current TimeCamp data.
Create a Chart
The following sections show how to create a chart tied to its own SQL query. When retrieving the data from the remote data source, more restrictive queries, written for specific report objects, can result in faster performance.
Create a DataSet
Follow the steps below to create a new dataset to populate the chart:
- In the report editing area, click the Design tab.
- In the Outline view, right-click the root node for the report and click Create Dataset.
- Enter a name for the dataset and click the option to create a new dataset from a connection or data source.
- In the Data Adapter menu, select the data adapter you created in the first section.
- Enter a query such as the following:
SELECT UserId, Email FROM GroupUsers WHERE GroupId = '12345'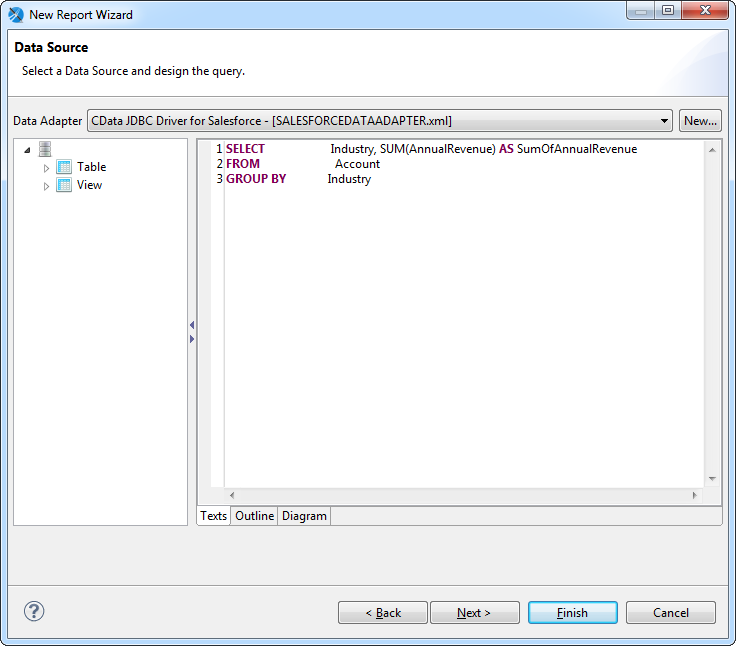
- Select the fields you want in the dataset. This example uses UserId and Email.
- Skip the step to group by fields and finish the wizard.
Configure the Chart
After adding the dataset, follow the steps below to map column values to the chart axes in the chart wizard:
- Click the Summary node in the Outline view. In the Properties view, set the height to 400 pixels. The summary band is printed at the end of the report.
- Drag a chart from the Palette onto the summary. The chart wizard is displayed.
- Select the chart type. This example uses a bar chart.
- In the Dataset menu, select the dataset you created for the chart.
- In the Dataset tab, select the option to use the same JDBC connection used to fill the master report.
- Specify the chart's series: Click the button next to the Series menu and click Add. In the Expression Editor that is displayed, double-click the UserId column to set the expression to $F{UserId}.
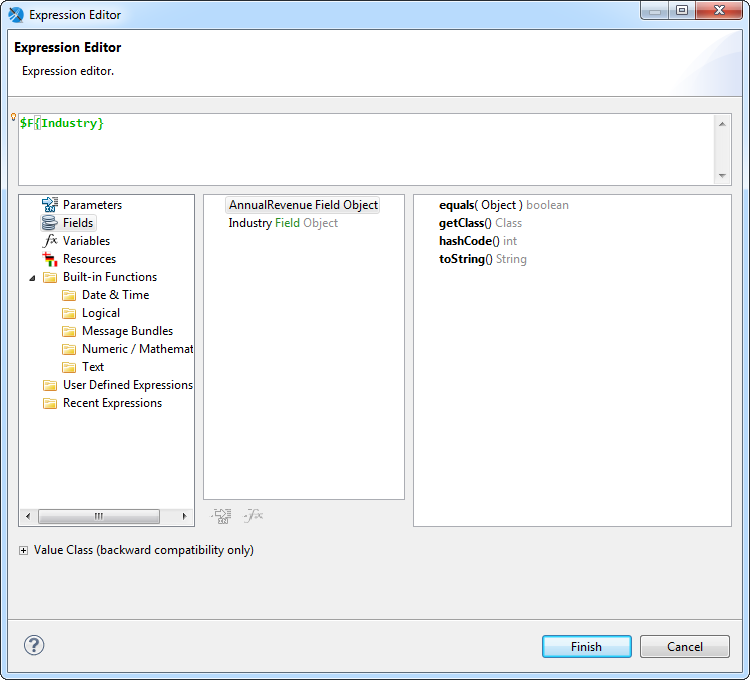
Specify the y-axis values: In the chart wizard, click the button next to the Value box. In the Expression Editor, double-click Email to set the expression to $F{Email}.
- Specify the labels for the series elements: In the chart wizard, click the button next to the Label box. In the Expression Editor, double-click the UserId column to set the expression to $F{UserId}. If needed, convert the column type to string, as in the following expression:
$F{UserId}.toString()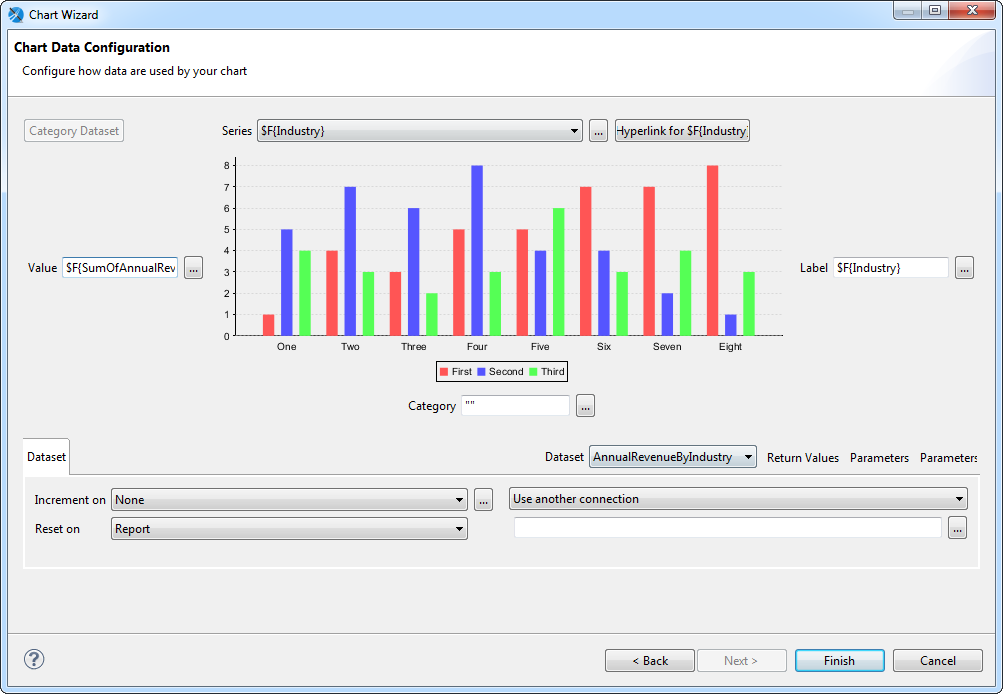
- Expand the chart to fill the summary section: right-click the chart and click Size to Container -> Fit Both.
Running the Report
You can now generate reports on TimeCamp data just as you would any other JDBC data source. Jaspersoft Studio periodically refreshes the data across report runs.