




DataBind Charts to Yotpo Data

DataBinding facilitates two-way interaction with data through UI controls. Using the CData ADO.NET Provider for Yotpo streamlines the process of binding Yotpo data to Windows Forms and Web controls within Visual Studio. In this article, we will demonstrate using wizards to establish a binding between Yotpo data and a chart that dynamically updates. Additionally, the code walk-through section will guide you through the creation of a chart using just 10 lines of code.
Binding Data to a Chart
DataBinding to a Chart consists of three steps: Instantiate the control, configure the data source, and databind.
Configure the Connection and Select Database Objects
To create a chart control and establish a connection to Yotpo, follow the steps outlined below using the Data Source Configuration Wizard. Within the wizard, you'll have the option to choose the specific Yotpo entities you wish to bind to.
- In a Windows Forms project, drag and drop a Chart control from the toolbox to the form. In the Data section of the Chart properties, select DataSource and then select Add Project Data Source from the menu.
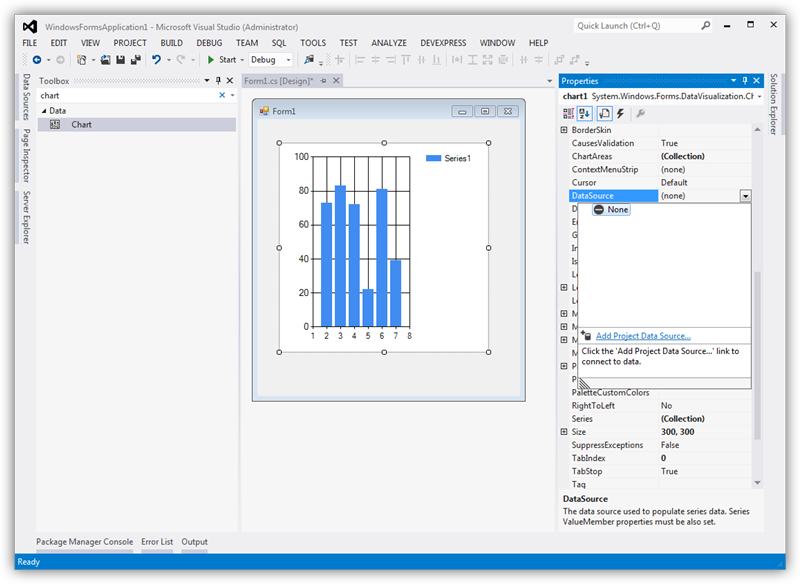
- In the Data Source Configuration Wizard that appears, select Database -> Dataset.
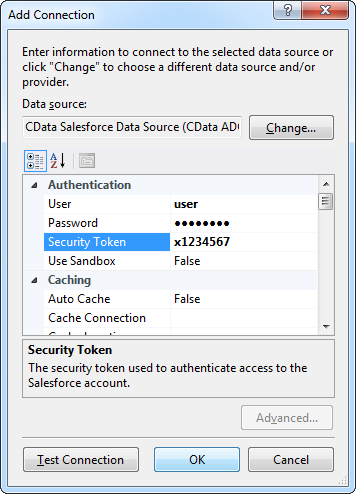
- In the Choose Your Data Connection step, click New Connection.
In the Add Connection dialog, click Change to select the CData Yotpo Data Source.
Below is a typical connection string:
Profile=C:\profiles\Yotpo.apip;AuthScheme=OAuthClient;InitiateOAuth=GETANDREFRESH;OAuthClientId=your_app_key;OAuthClientSecret=your_app_secret;Start by setting the Profile connection property to the location of the Yotpo Profile on disk (e.g. C:\profiles\Yotpo.apip). Next, set the ProfileSettings connection property to the connection string for Yotpo (see below).
Yotpo API Profile Settings
To authenticate to Yotpo, you can use the OAuth 2.0 client credentials flow with your Yotpo AppKey and AppSecret.
To use the Yotpo API, you need a Yotpo store account with an AppKey and AppSecret. You can find these credentials in the Yotpo dashboard under Account Settings > Store.
After setting the following connection properties, you are ready to connect:
- AuthScheme: Set this to OAuthClient.
- InitiateOAuth: Set this to GETANDREFRESH. You can use InitiateOAuth to manage the process to obtain the OAuthAccessToken.
- OAuthClientId: Set this to your Yotpo AppKey.
- OAuthClientSecret: Set this to your Yotpo AppSecret.
When you configure the connection, you may also want to set the Max Rows connection property. This will limit the number of rows returned, which is especially helpful for improving performance when designing reports and visualizations.
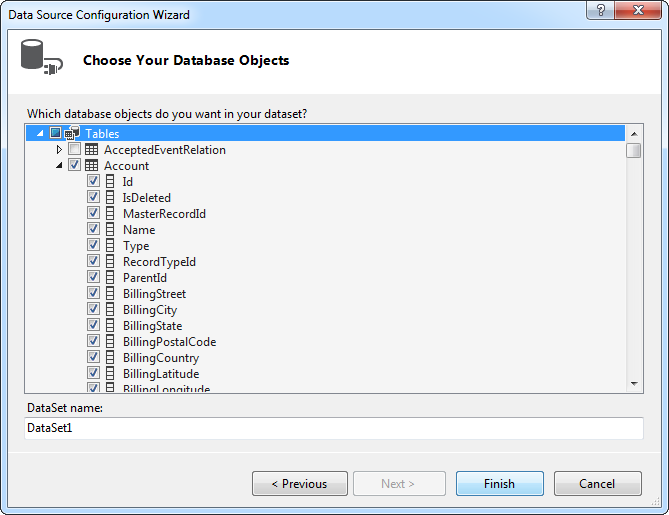
- Choose the database objects you want to work with. This example uses the ProductBottomLine table.
DataBind
After adding the data source and selecting database objects, you can bind the objects to the chart. This example assigns the x-axis to TotalReview and the y-axis to AverageScore.
- In the Chart properties, click the button in the Series property to open the Series Collection Editor.
- In the Series properties, select the columns you want for the x- and y-axes: Select columns from the menu in the XValueMember and YValueMember properties.
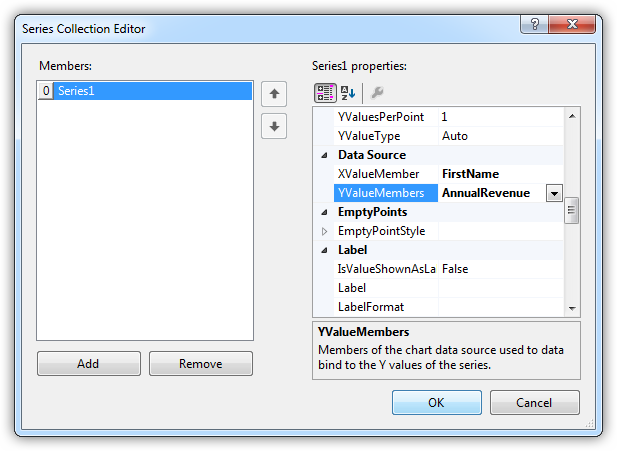
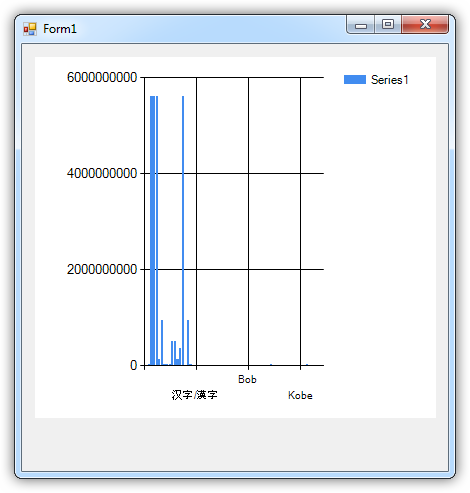
The chart is now databound to the Yotpo data. Run the chart to display the current data.
Code Walk-through
DataBinding to Yotpo data requires only a few lines of code and can be completed in three easy steps.
- Connect to Yotpo.
- Create the APIDataAdapter to execute the query and create a DataSet to be filled with its results.
- DataBind the result set to the chart.
Below is the complete code:
APIConnection conn = new APIConnection("Profile=C:\profiles\Yotpo.apip;AuthScheme=OAuthClient;InitiateOAuth=GETANDREFRESH;OAuthClientId=your_app_key;OAuthClientSecret=your_app_secret;");
APICommand comm = new APICommand("SELECT TotalReview, AverageScore FROM ProductBottomLine WHERE ExternalProductId = 'my-product-sku'", conn);
APIDataAdapter da = new APIDataAdapter(comm);
DataSet dataset = new DataSet();
da.Fill(dataset);

chart1.DataSource = dataset;
chart1.Series[0].XValueMember = "TotalReview";
chart1.Series[0].YValueMembers = "AverageScore";
// Insert code for additional chart formatting here.
chart1.DataBind();