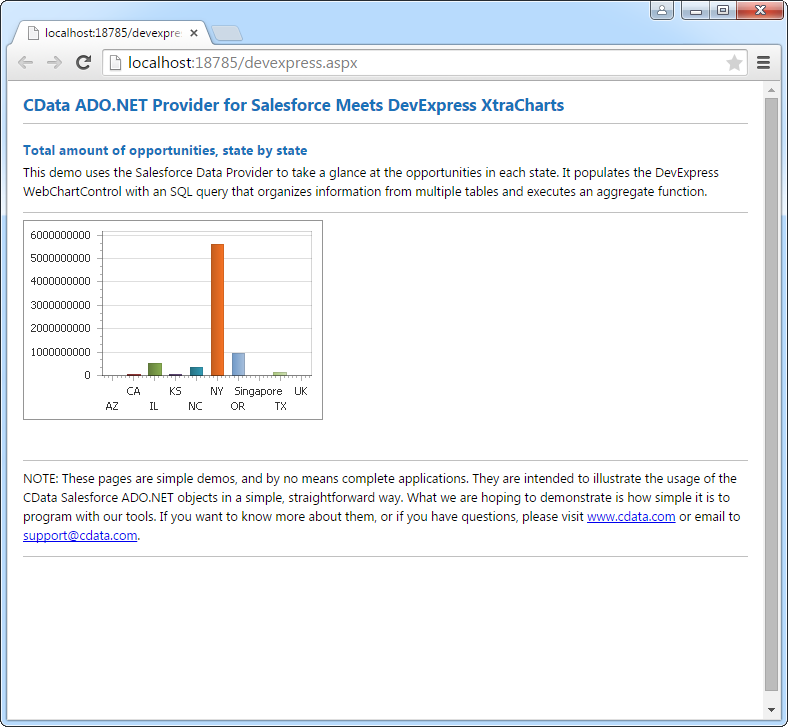
DataBind ZenRows Data to the DevExpress Data Grid

The CData API Driver for ADO.NET incorporates conventional ADO.NET data access components compatible with third-party controls. You can adhere to the standard ADO.NET data binding procedures to establish two-way access to real-time data through UI controls. This article will demonstrate the utilization of CData components for data binding with DevExpress UI Controls (Windows Forms and Web controls), specifically binding to a chart that visualizes live data.
Start by setting the Profile connection property to the location of the ZenRows Profile on disk (e.g. C:\profiles\ZenRows.apip). Next, set the ProfileSettings connection property to the connection string for ZenRows (see below).
ZenRows API Profile Settings
To use the ZenRows API, you need to obtain an API key from your ZenRows account. Navigate to the ZenRows dashboard at app.zenrows.com and copy your API key from the account settings.
After setting the following connection properties, you are ready to connect:
- AuthScheme: Set this to APIKey.
- APIKey: Set this to your ZenRows API key.
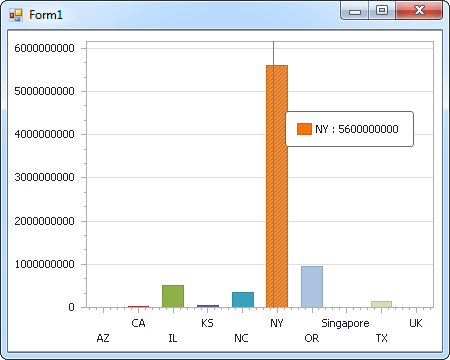
Windows Forms Controls
The code below shows how to populate a DevExpress chart with ZenRows data. The APIDataAdapter binds to the Series property of the chart control. The Diagram property of the control defines the x- and y-axes as the column names.
using (APIConnection connection = new APIConnection(
"Profile=C:\profiles\ZenRows.apip;AuthScheme=APIKey;ProfileSettings='APIKey=your_api_key';")) {
  APIDataAdapter dataAdapter = new APIDataAdapter(
  "SELECT ProductId, ProductName FROM AmazonDiscovery WHERE Query = 'laptop'", connection);

  DataTable table = new DataTable();
  dataAdapter.Fill(table);
  DevExpress.XtraCharts.Series series = new DevExpress.XtraCharts.Series();
  chartControl1.Series.Add(series);
  series.DataSource = table;
  series.ValueDataMembers.AddRange(new string[] { "ProductName" });
  series.ArgumentScaleType = DevExpress.XtraCharts.ScaleType.Qualitative;
  series.ArgumentDataMember = "ProductId";
  series.ValueScaleType = DevExpress.XtraCharts.ScaleType.Numerical;
  chartControl1.Legend.Visibility = DevExpress.Utils.DefaultBoolean.False;
  ((DevExpress.XtraCharts.SideBySideBarSeriesView)series.View).ColorEach = true;
}
Web Controls
The code below shows how to populate a DevExpress Web control with ZenRows data. The APIDataAdapter binds to the Series property of the chart; the Diagram property defines the x- and y-axes as the column names.
using DevExpress.XtraCharts;

using (APIConnection connection = new APIConnection(
"Profile=C:\profiles\ZenRows.apip;AuthScheme=APIKey;ProfileSettings='APIKey=your_api_key';"))
{
  APIDataAdapter APIDataAdapter1 = new APIDataAdapter("SELECT ProductId, ProductName FROM AmazonDiscovery WHERE Query = 'laptop'", connection);
  DataTable table = new DataTable();
  APIDataAdapter1.Fill(table);
  DevExpress.XtraCharts.Series series = new Series("Series1", ViewType.Bar);
  WebChartControl1.Series.Add(series);
  series.DataSource = table;
  series.ValueDataMembers.AddRange(new string[] { "ProductName" });
  series.ArgumentScaleType = ScaleType.Qualitative;
  series.ArgumentDataMember = "ProductId";
  series.ValueScaleType = ScaleType.Numerical;
  ((DevExpress.XtraCharts.SideBySideBarSeriesView)series.View).ColorEach = true;
}