






Jira's built-in dashboards answer the questions Jira expected you to ask. Project managers usually ask different ones: who's logging the most time, which project leads carry the heaviest load, and how does any of it compare with the spreadsheet finance keeps?
This guide ends with a worksheet that lists every issue alongside its project lead and logged time, a cell that re-filters the list by reporter, and a PivotTable that totals time by lead. It all refreshes straight from Jira.
What the finished report looks like
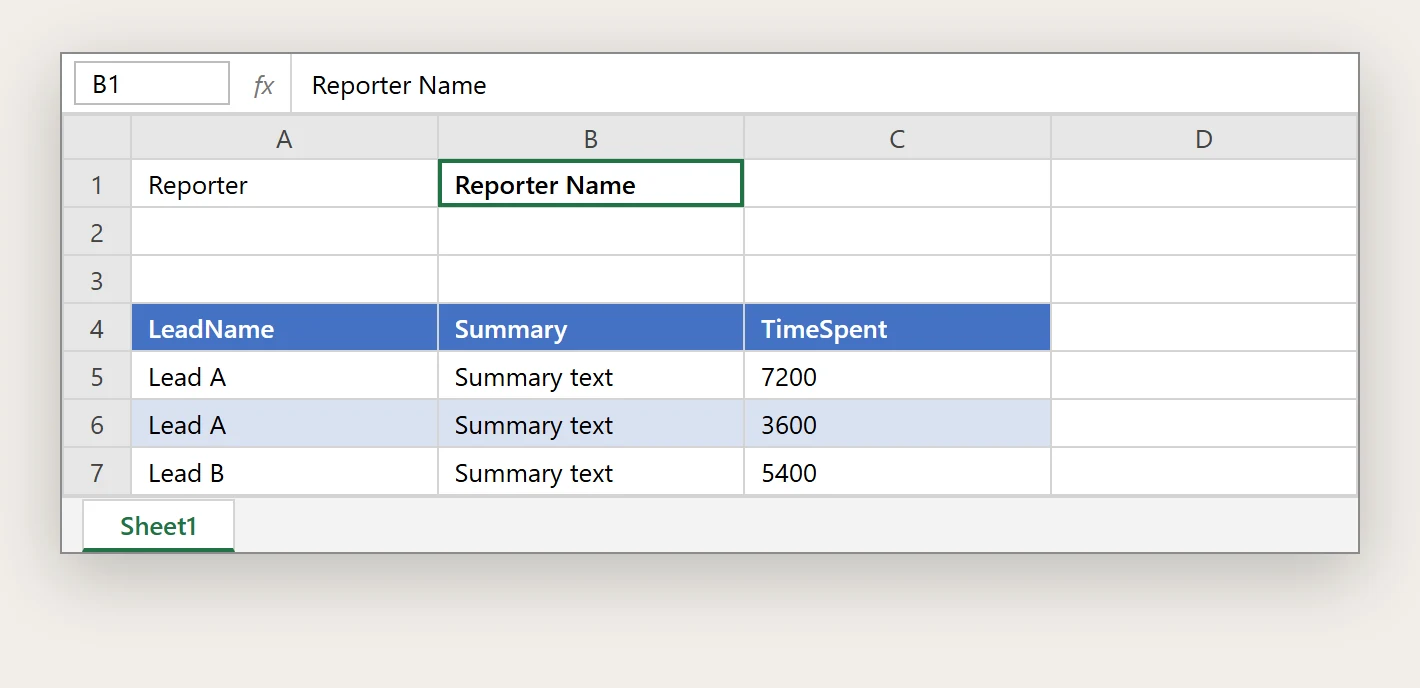
Each row takes the project lead from Projects.LeadName, the issue summary from Issues.Summary and the logged time from Issues.TimeSpent. A reporter's name typed into B1 controls which issues appear, and a PivotTable on top adds up TimeSpent for each lead.
Connect with an API token
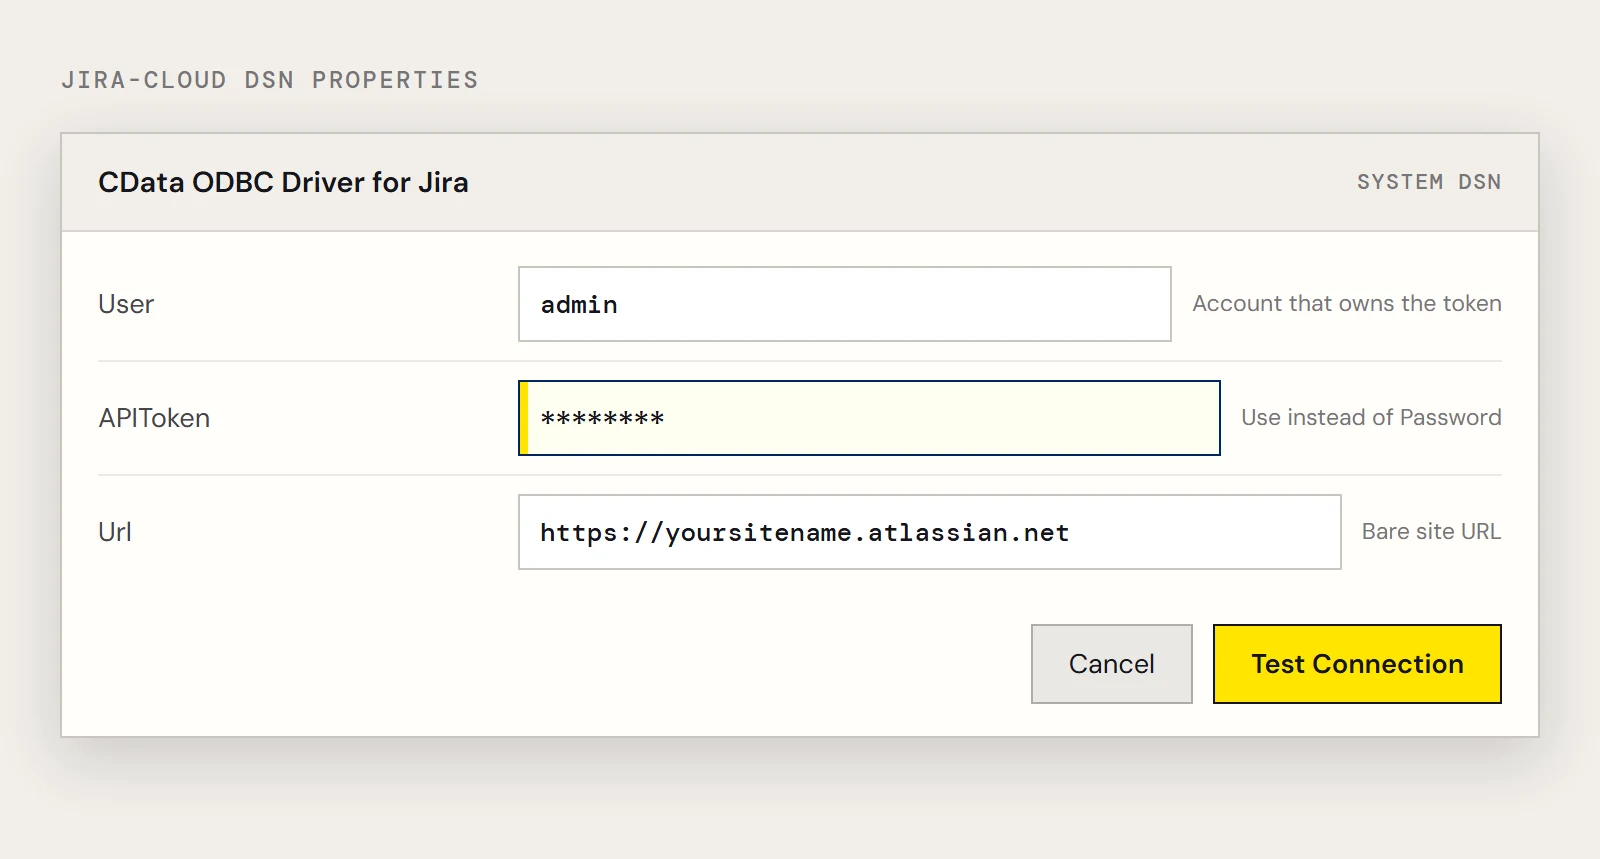
Use an API token rather than a password. You'll need your site URL (such as https://yoursitename.atlassian.net), the username or email of the account that runs the report, and an API token generated for that account.
Install the CData ODBC Driver for Jira, add a System DSN named Jira-Cloud, and fill in User, APIToken and Url. As a connection string:
User=admin;APIToken=your-token;Url=https://yoursitename.atlassian.net;If you'd rather use a password, set the Password property in place of APIToken. The driver also supports OAuth and personal access tokens when your organization requires them.
Write one join instead of exporting two lists
The driver exposes Jira objects as SQL tables, so a project's lead and its issues can be combined in one statement. Open Data > Get Data > Legacy Wizards > From Microsoft Query (Legacy) (enable it under File > Options > Data if it's missing), choose Jira-Cloud, and edit the query as SQL:
SELECT Projects.LeadName, Issues.Summary, Issues.TimeSpent
FROM Projects, Issues
WHERE Projects.Id = Issues.ProjectId
  AND Issues.ReporterDisplayName = ?
The ? becomes a parameter. Return the data to Excel at A4, point the parameter at B1, and choose to refresh when the cell changes. Type a reporter's display name and the table redraws.
Pivot it
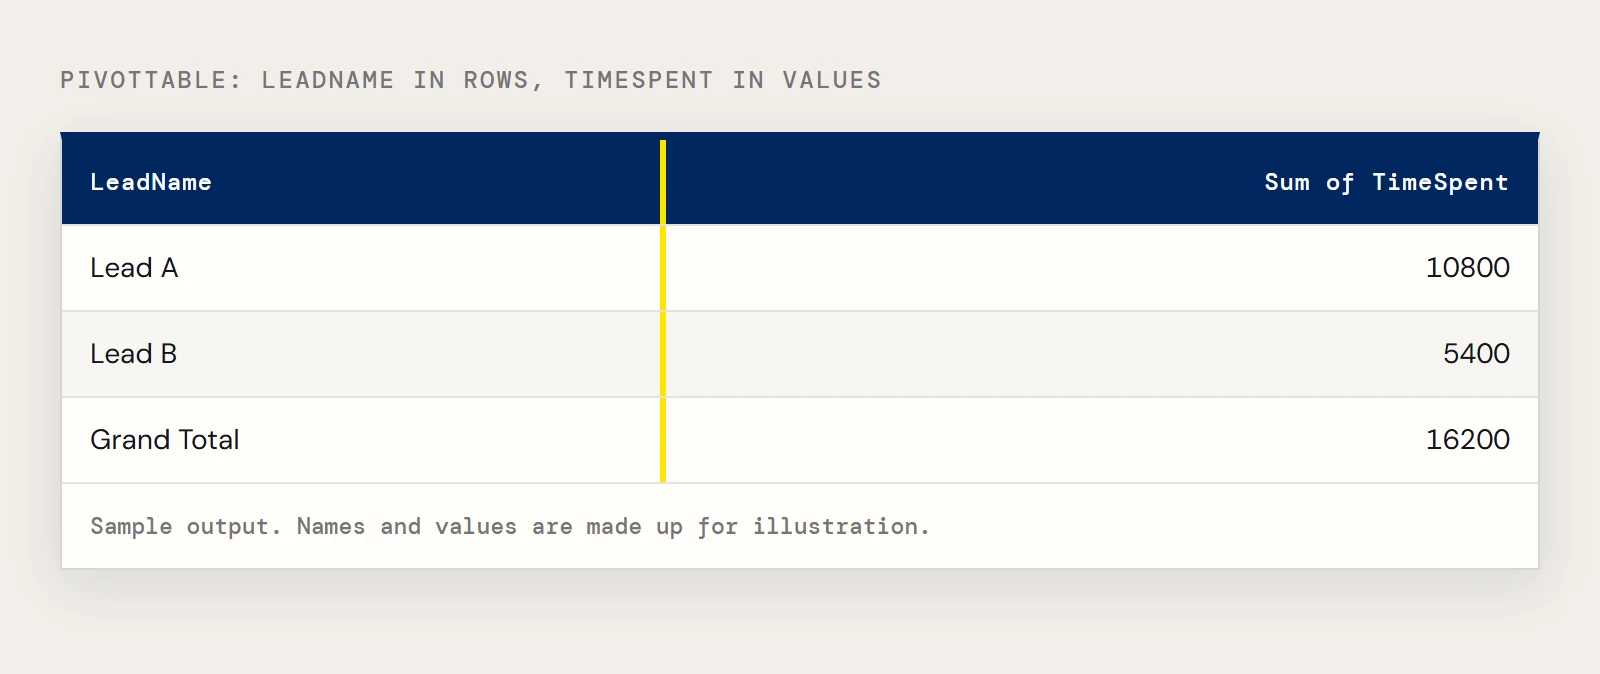
Select any cell in the results and insert a PivotTable, with LeadName in Rows and TimeSpent in Values. That gives you time per project lead, and Data > Refresh All updates it before each planning meeting. If you'd rather not type reporter names into B1, put a drop-down there with Data Validation.
To build this report against your own Jira site, download a free trial of the ODBC Driver for Jira.
Common errors
| What you see | Likely cause | Fix |
|---|---|---|
| Authentication fails | Token and User belong to different accounts, or the Url has a trailing path | Regenerate the token for the same account and use the bare site URL |
| Fewer projects than expected | The Jira user can't browse every project | Check the account's project permissions in Jira |
| Slow refresh | Selecting more columns than needed | Pick only the columns you report on and keep the reporter filter |
One last setting: refresh on open
Right-click the results table, choose Table > External Data Properties, and tick Refresh data when opening the file. Anyone who opens the workbook on Monday morning sees current numbers without clicking anything.
Ready to get started?
Download a free trial of the Jira ODBC Driver to get started:
Download NowLearn more:
 Jira ODBC Driver
The Jira ODBC Driver is a powerful tool that allows you to connect with live data from Jira, directly from any applications that support ODBC connectivity.
Access Jira data like you would a database - read, write, and update Jira Projects, Groups, Workflows, etc. through a standard ODBC Driver interface.