 Discover how to connect live Shopify data to Power BI using CData Connect AI to empower fast, governed connectivity with no coding. Shopify is a powerful, cloud-based e-commerce platform for building and managing online stores, offering robust features for sales, payments, inventory, and marketing. When combined with Power BI using Connect AI, users gain immediate and trusted insights into their data without the burden of building and maintaining pipelines.
Try It Free
Why connect Shopify and Power BI
While Shopify does offer built-in reporting, it lacks the flexibility for deeper analysis or customized reporting that uses multiple sources. Visualizing Shopify data in Power BI can unlock valuable insights into tracking sales performance, sharing revenue metrics, and acting on overall customer engagement. However, Power BI does not offer a native connector for Shopify, which leaves many users dependent on manual exports with complex, nested JSON structures or fragile custom scripts.
Organizations are searching for reliable ways to connect to live Shopify data in Power BI that enable automated, governed refreshes and scalable reporting. E-commerce teams using Power BI for revenue tracking, refund analysis, and trend monitoring depend on automated, governed connectivity to avoid stale data and operational inefficiency. Without the proper integration and simplified data modeling, organizations can risk inefficient or ineffective manual processes, siloed or stale insights, and the operational burden of maintaining custom scripts that don't scale.
Key business outcomes you unlock
Connecting Shopify to Power BI using a live, governed approach like CData Connect AI or the CData Power BI Connector, you gain several high-impact advantages:
Unified source of truth: Merge Shopify orders with financial, marketing, and fulfillment data into one clean reporting model.
Timely decisions: View revenue, refunds, and performance metrics as they update without manual exports.
Operational awareness: Quickly identify anomalies like fulfillment delays, inventory issues, or unusual return spikes.
Customer growth insights: Track lifetime value, repeat rate, and cohort behavior to guide your retention strategy.
Common KPIs for ecommerce teams
The most effective dashboards, based on Shopify data, transform the data into actionable metrics that drive growth and efficiency. Here are the KPIs ecommerce teams track most commonly:
Gross and net revenue: Captures order totals and deducts discounts, shipping, taxes, refunds, etc.
Average Order Value (AOV): Total revenue divided by the order count
Refund rate: The ratio of refunded orders or the amount of refunds to total sales
Customer lifetime value (LTV): Revenue per customer over time, often segmented by cohort
Conversion rates by channel: Integrates Shopify data with ad or email campaign data
Inventory turnover: Ties product sales to inventory changes to surface trends
Common use cases
Executive dashboards: Overview of sales, top products, fulfillment metrics, and more
Marketing performance: Customer acquisition cost (CAC) vs LTV by campaign and/or channel
Merchandising: Which products or collections are driving sales
Operations: SLA adherence for fulfillment, shipping times, and refund resolution
Connection options and when to use each
Below are three main ways that teams can connect Shopify data to Power BI, each with distinct tradeoffs between speed, governance, and data freshness:
| Setup Time | Live Data | Governance | Power BI Gateway needed for Online | Best For | Not Ideal When |
CData Connect AI | Minutes | Yes | OAuth, SSO, row-level access, audit trails | No | Cloud-first teams needing speed + control | Heavy warehouse transformations are needed |
Power Query + Shopify API | High | Limited | Custom-built logic and security | Yes | Developers and teams who want full control | Non-technical users or complex modeling |
App Store Connectors | Hours | No | Limited | Yes | Simple use cases with few refreshes needed | Need for live, governed data |
CData Connect AI: Fast, Governed, Live Connectivity
Overview:
CData Connect AI is the fastest and most secure way to bring Shopify data into Power BI with live access. Connect AI offers a no-code UI that exposes Shopify data as an analytics-ready, SQL-accessible source that makes it easier to create dashboards with fresh reporting data.
Key features:
Zero-install SaaS: Connect in the browser; no desktop drivers necessary.
Governance: OAuth, SSO, and row-level access; audit usage by user and data source.
No gateway for Power BI Online: Avoids using the on-premises gateway for publishing reports.
Live data posture: In-place queries deliver up-to-date results without staging.
When to choose:
Choose CData Connect AI when your team wants a quick deployment and strong access controls to manage data access. Additionally, you should use Connect AI when live data is a priority, and the use case does not require heavy, warehouse-centric transformation before reporting in Power BI.
Power Query and Shopify API: Full control, high complexity
Overview:
This DIY approach utilizes the Shopify REST API and calls the API directly in Power Query. This gives your team full control of the integration and no vendor dependency, but requires complex technical experience and ongoing maintenance to use.
Implementation notes:
Use Shopify REST endpoints (Orders, Customers, Products) and handle pagination via page_info cursors.
Normalize nested arrays (line_items, fulfillments) into separate tables.
Implement caching and incremental strategies to manage rate limits.
When to choose:
Choose this approach when your engineering/development team has the expertise and bandwidth to create and maintain the integration and wants no external dependencies on other vendors.
App store connectors and ETL to a warehouse
Overview:
Third-party connectors like Windsor.ai and Coupler.io replicate Shopify data into Power BI or warehouses with pre-built models and simple scheduling.
Implementation notes:
Typically offers a quick setup with a low-code/no-code experience and pre-built data models.
Not a true “live data” connection, provides a snapshot based on simple scheduling of replications.
Shopify schema changes can complicate pipeline stability.
When to choose:
Choose this approach when your team is smaller, with limited IT resources, looking for a fast solution and lightweight dashboards that don’t require real-time insights or fine-grained access controls.
Step-by-step: Connect Shopify and Power BI
Step 1: Create a Shopify access token
In a separate browser window, log in to your Shopify account and open the Apps page.
Select Develop apps and then Create an app. Enter the App name and select the App developer, then click Create app.
In the new app, click Configure Admin API scopes. Enable the following permissions:
read_customers, write_customers, read_draft_orders, write_draft_orders, read_fulfillments, write_fulfillments, read_inventory, write_inventory, read_marketing_events, write_marketing_events, read_orders, write_orders, read_price_rules, write_price_rules, read_product_listings, write_product_listings, read_products, write_products, read_shopify_payments_payouts
Click Save to save the permission settings.
Select the API Credentials Click Install app, then Install on the confirmation prompt.
Click Reveal token once and copy down the value. This acts as your access token for authentication.
Step 2: Add Shopify to CData Connect AI
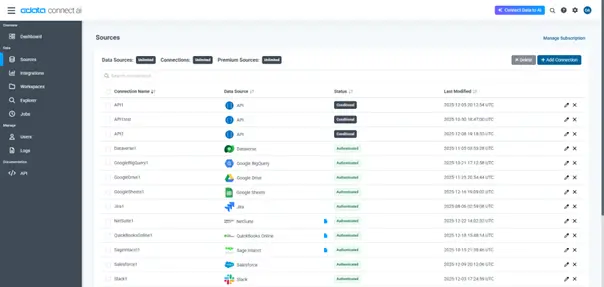
Log into Connect AI, click Sources, and then click + Add Connection
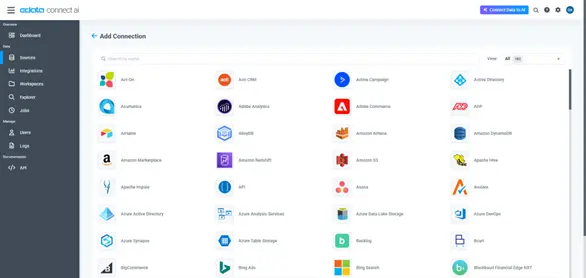
Select "Shopify" from the Add Connection panel
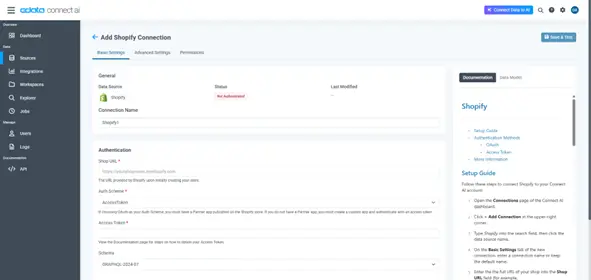
Set the necessary connection properties and click Save & Test to authenticate and save the connection with Shopify
With the connection configured, you are ready to connect to Shopify data from Power BI.
Step 3: Connect from Power BI
Once you connect to Shopify in Connect AI, you can create a dataset in Power BI Desktop and publish the dataset to the Power BI service.
Open Power BI Desktop and click Get Data -> Online Services -> CData Connect AI, and click Connect
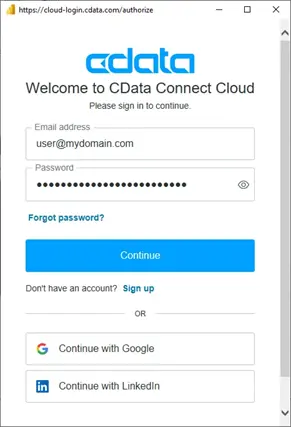
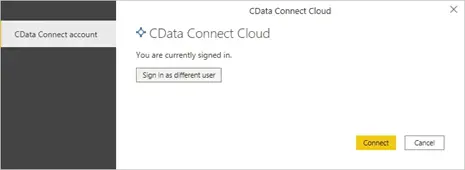
Click Sign in and authenticate with your CData Connect AI account
After signing in, click Connect
Select tables in the Navigator dialog and click Load to establish the connection to your Shopify data from Power BI
Step 4: Publish to Power BI Service and schedule refresh
In Power BI Desktop, click Publish (from the Home menu) and select a Workspace
Log in to PowerBI.com
Click Workspaces and select the Workspace the dataset was published to
Open the dataset and navigate to File> Settings. Under Data Source, click Edit Credentials.
Click Sign in and enter your CData Connect AI credentials when prompted.
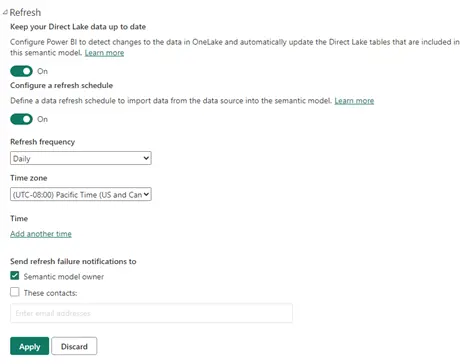
On the same page, you can now select Refresh and configure a refresh schedule
Get real-time Shopify data in Power BI
Power BI offers two modes of connection for data sources, Import and DirectQuery. When looking to visualize data in Power BI, it is important to understand the differences in these connectivity modes to choose the best option for the business use case:
Import: Power BI loads data into the model and caches it to create a point-in-time snapshot of the data
DirectQuery: Power BI queries the data source directly at run-time, rather than using a cached dataset.
DirectQuery vs Import mode in Power BI
| Freshness | Transformations | Refresh Requirements | Data Size | Schema Changes |
DirectQuery | Data is always queried live | Limited modeling | None, data is always live | No restrictions | Changes to the source data are automatically reflected |
Import | Data is imported and cached; freshness is based on the refresh schedule | Full modeling capabilities with Power Query | Scheduled or on-demand refresh | Limit of 1 GB | Data is cached, requiring a full refresh to reflect changes |
Secure access with SSO and role-based permissions
Using CData Connect AI to integrate real-time Shopify data with Power BI ensures compliance through layered security that spans both the connection and analytics platforms. Connect AI enforces governance directly at the connection level by supporting critical security concepts such as SSO(Single-Sign-On) for unified credential management across systems, and role-based access control (RBAC) for authorization based on a user’s role, while Power BI adds RLS (Row-level security) at the analytics layer.
The result of this combination is a trusted data environment where end users can self-serve modeling and analytics without compromising on security. With governance and least-privileged data access built into the connectivity and analysis platforms, organizations can trust their data is safe and their pipelines meet compliance mandates such as HIPAA, GDPR, or SOC 2.
Model Shopify data for accurate reporting
Effective data analysis and modeling transform raw Shopify data into optimized structures for smarter reporting and high-performance queries. Shopify APIs return deeply nested objects, especially in orders, line items, transactions, and refunds, which must be carefully normalized to build a clean, reliable data model.
Star schema design
An effective approach is a star schema that separates transactional data (facts) from descriptive attributes (dimensions). This ensures accurate aggregations and scalability across time series, customers, and products.
Fact tables:
Orders: Each row represents a single customer order. Join to customers using customer.id, and to transactions, line items, and fulfillments using order.id.
Line items: One row per product in an order. Use order.id and line_item.id as composite keys to connect to orders and refunds.
Transactions: Includes payments, charges, and refunds. Link to order.id and track payment status.
Refunds: Often includes nested refund_line_items; use both order.id and line_item.id to join accurately.
Fulfillments: Represents shipment events. Join using order.id and use timestamps to analyze SLA compliance.
Dimension tables:
Products: Enriched metadata about SKUs, variants, collections, etc.
Customers: Key demographics and account history.
Best practices for clean models
Flatten nested JSON: Use Power Query’s “Expand to New Rows” followed by “Expand Columns” to normalize arrays.
Use surrogate keys: If native keys are unstable, generate composite or surrogate keys to maintain relational integrity.
Time normalization: Convert all datetime fields to UTC, then derive local reporting time where needed.
Avoid double-counting: Base revenue calculations on line items, not orders. Subtract discounts and refunds to derive net revenue. Avoid aggregating transactions and refunds without proper context.
Audit data completeness: Validate joins across order IDs, especially when connecting to third-party data (e.g., ad platforms, fulfillment services).
Use case-specific modeling examples
Sales dashboard: Aggregate line items by product, region, and date for accurate revenue metrics.
Returns analysis: Join refunds to line items to identify high-return products.
Fulfillment performance: Track average fulfillment time by warehouse or shipping carrier.
Customer LTV: Calculate cohort-based spend by joining orders and customers over time.
Proper modeling not only improves accuracy, it also ensures that metrics remain trustworthy as Shopify's data structures evolve or grow in volume.
Frequently asked questions
Do Shopify and Power BI natively integrate?
Shopify and Power BI do not offer a native integration. To connect the two, you need a third-party connector, an API-based solution, or a custom script.
Can I avoid a gateway when publishing to Power BI Service?
Yes. If you use a cloud-accessible source such as an OData endpoint from CData Connect AI, you can avoid an on-premises gateway. Desktop-installed drivers typically require one.
How do I prevent double-counting revenue from orders, line items, and refunds?
Model line items as the granular fact table and calculate net revenue by subtracting discounts and refunds in measures. Keep refunds and transactions as separate facts joined on order and line-item keys.
What should I do about Shopify API rate limits during refresh?
Use incremental refresh, implement cursor-based pagination, and schedule refreshes during off-peak windows to minimize request bursts and avoid API throttling.
How do I handle multi-store and multi-currency reporting?
Add a store dimension to your model and standardize currency by converting presentment amounts to a single reporting currency at query time or within measures.
How is customer PII protected, and can I enforce row-level access?
Protect customer PII by using OAuth for secure access, masking sensitive columns, and enforcing Row-Level Security (RLS) to restrict data visibility by user, region, or brand.
What happens when Shopify adds fields, or my apps change the schema?
Use connectors that automatically adapt to schema changes or design flexible data models that can accommodate new fields without breaking refreshes.
Connect Shopify to Power BI with CData Connect AI
CData Connect AI delivers live, governed Shopify data to Power BI without gateways, complex scripting, or IT bottlenecks. Get up and running with OAuth security, automatic schema handling, and real-time DirectQuery access—all from your browser.
Try Connect AI free and experience how fast secure analytics can be.
Explore CData Connect AI today
See how Connect AI excels at streamlining business processes for real-time insights.


