Visualize BugHerd Data in TIBCO Spotfire through ADO.NET

TIBCO Spotfire is a data visualization and business intelligence software developed by TIBCO Software Inc. It allows users to connect, visualize, and share insights from various data sources in real-time. Spotfire provides interactive dashboards, data analytics, and predictive analytics capabilities, enabling users to explore data, uncover trends, and make data-driven decisions. It is commonly used in businesses and organizations to analyze large datasets, gain valuable insights, and improve decision-making processes. Learn more at https://www.tibco.com/analytics.
In this article, we will guide you through the process of utilizing the CData ADO.NET Provider for BugHerd within TIBCO Spotfire. You will learn how to establish a connection and build a basic dashboard.
- Add the CData ADO.NET data source by clicking Add Data Tables.
- Click Add -> Database.
- Select the provider and click Configure.
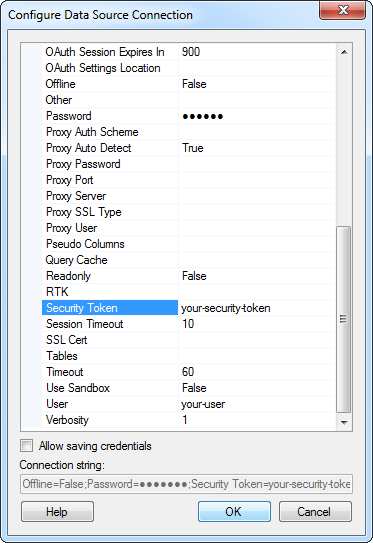
- Define the connection settings. Below is a typical connection string:
Profile=C:\profiles\BugHerd.apip;AuthScheme=APIKey;ProfileSettings='APIKey=your_api_key';
Start by setting the Profile connection property to the location of the BugHerd Profile on disk (e.g. C:\profiles\BugHerd.apip). Next, set the ProfileSettings connection property to the connection string for BugHerd (see below).
BugHerd API Profile Settings
BugHerd uses HTTP Basic authentication with an API key as the username. To obtain an API key:
- Sign in to your BugHerd account at https://www.bugherd.com
- Navigate to Settings > General Settings
- Locate the API Key section and copy the generated key
After obtaining your API key, set the following connection properties:
- AuthScheme: Set this to APIKey.
Set the following in the ProfileSettings connection property:
- APIKey: Set this to your BugHerd API key. The driver uses the key as the Basic auth username and sets the password internally to the literal value 'x' as required by BugHerd.
When you configure the connection, you may also want to set the Max Rows connection property. This will limit the number of rows returned, which is especially helpful for improving performance when designing reports and visualizations.
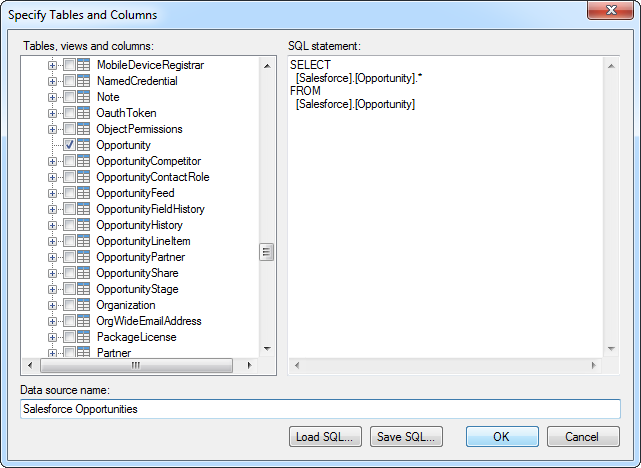
- Select the tables that you want to add to the dashboard. This example uses Tasks. You can also specify an SQL query. The driver supports the standard SQL syntax.
- If you want to work with the live data, click the Keep Data Table External option. This option enables your dashboards to reflect changes to the data in real time.
If you want to load the data into memory and process the data locally, click the Import Data Table option. This option is better for offline use or if a slow network connection is making your dashboard less interactive.
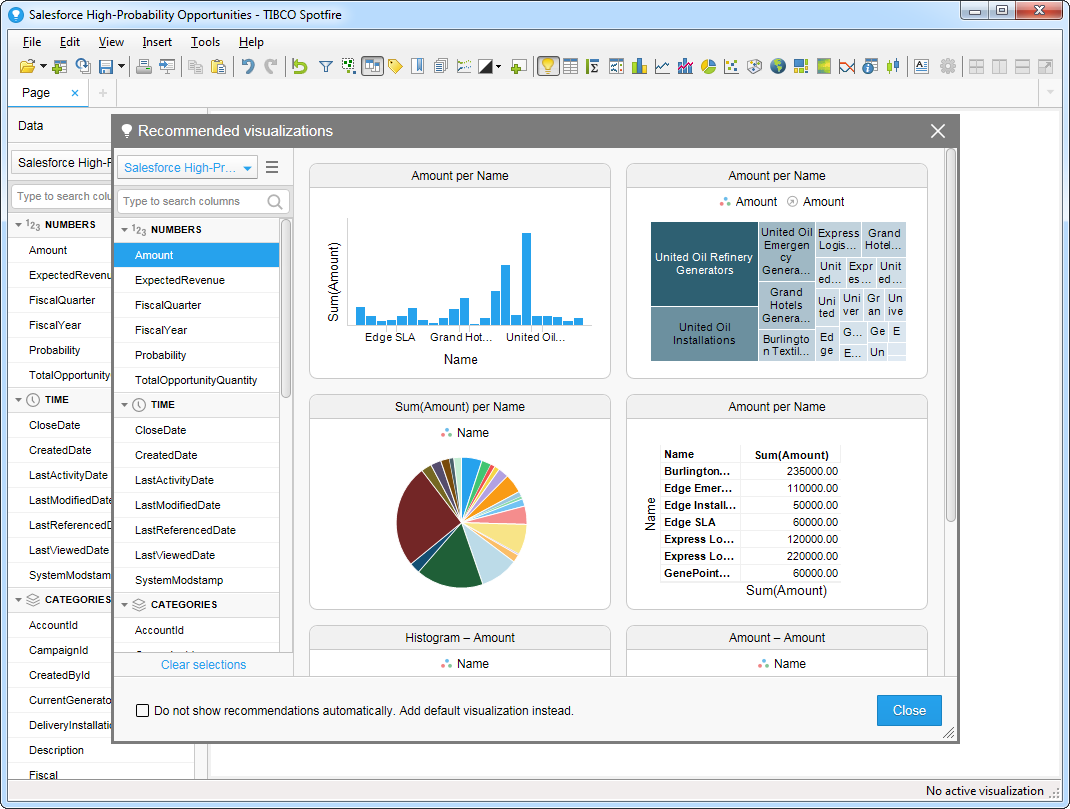
- After adding tables, the Recommended Visualizations wizard is displayed. When you select a table, Spotfire uses the column data types to detect number, time, and category columns. This example uses Title in the Numbers section and Id in the Categories section.
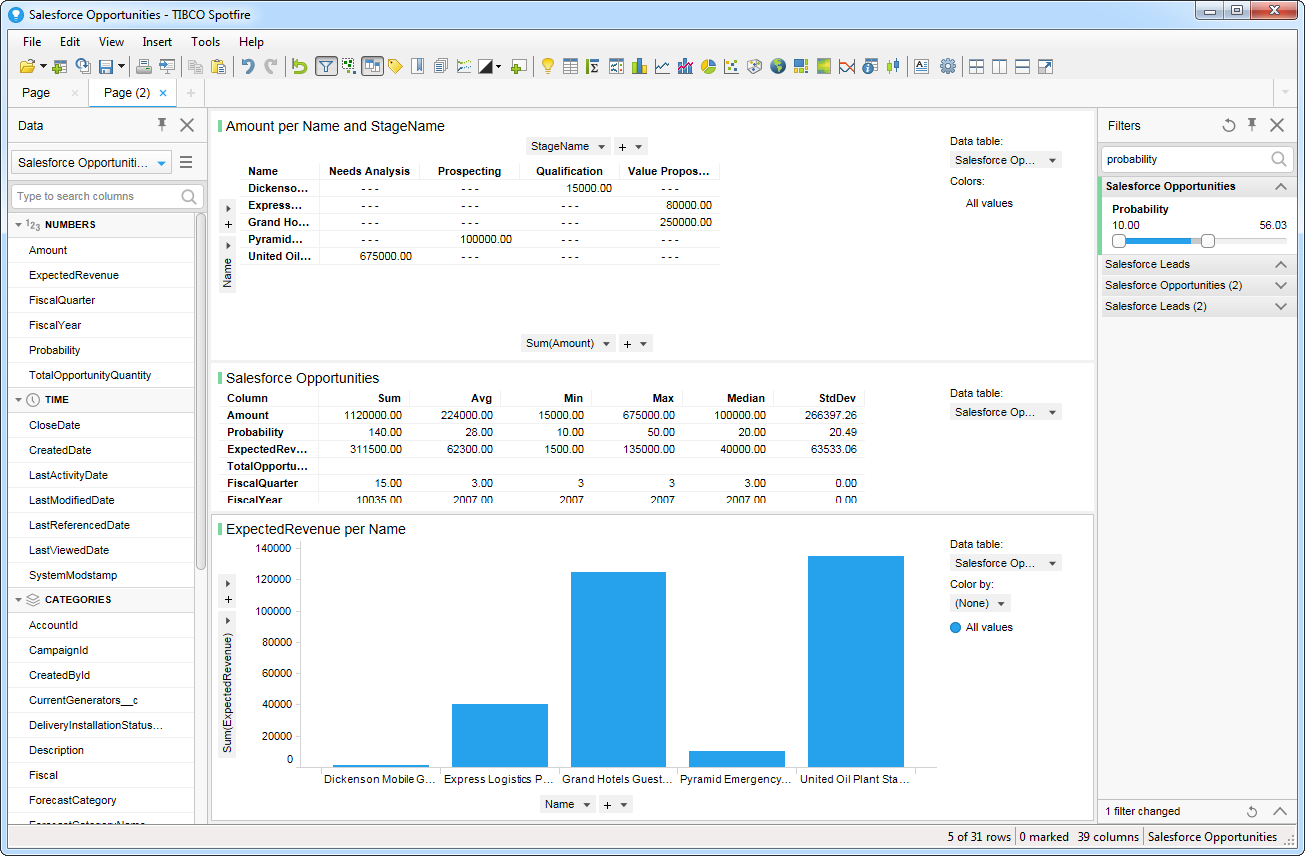
After adding several visualizations in the Recommended Visualizations wizard, you can make other modifications to the dashboard. For example, you can apply a filter: After clicking the Filter button, the available filters for each query are displayed in the Filters pane.