Analyze Clarifai Data in R via JDBC

Access Clarifai data with pure R script and standard SQL on any machine where R and Java can be installed. You can use the CData JDBC Driver for Clarifai and the RJDBC package to work with remote Clarifai data in R. By using the CData Driver, you are leveraging a driver written for industry-proven standards to access your data in the popular, open-source R language. This article shows how to use the driver to execute SQL queries to Clarifai and visualize Clarifai data by calling standard R functions.
Install R
You can match the driver's performance gains from multi-threading and managed code by running the multithreaded Microsoft R Open or by running open R linked with the BLAS/LAPACK libraries. This article uses Microsoft R Open 3.2.3, which is preconfigured to install packages from the Jan. 1, 2016 snapshot of the CRAN repository. This snapshot ensures reproducibility.
Load the RJDBC Package
To use the driver, download the RJDBC package. After installing the RJDBC package, the following line loads the package:
library(RJDBC)
Connect to Clarifai as a JDBC Data Source
You will need the following information to connect to Clarifai as a JDBC data source:
- Driver Class: Set this to cdata.jdbc.api.APIDriver
- Classpath: Set this to the location of the driver JAR. By default this is the lib subfolder of the installation folder.
The DBI functions, such as dbConnect and dbSendQuery, provide a unified interface for writing data access code in R. Use the following line to initialize a DBI driver that can make JDBC requests to the CData JDBC Driver for Clarifai:
driver <- JDBC(driverClass = "cdata.jdbc.api.APIDriver", classPath = "MyInstallationDir\lib\cdata.jdbc.api.jar", identifier.quote = "'")
You can now use DBI functions to connect to Clarifai and execute SQL queries. Initialize the JDBC connection with the dbConnect function.
Start by setting the Profile connection property to the location of the Clarifai Profile on disk (e.g. C:\profiles\Clarifai.apip). Next, set the ProfileSettings connection property to the connection string for Clarifai (see below).
Clarifai API Profile Settings
Clarifai uses Personal Access Tokens (PATs) for authentication. To obtain a PAT:
- Log in to your Clarifai account at https://clarifai.com.
- Navigate to your profile settings and select Security.
- Click Create Personal Access Token.
- Select the required scopes and click Create Token.
- Copy the generated token (it will only be shown once).
After obtaining your Personal Access Token, set the following connection properties:
- AuthScheme: Set this to APIKey.
Set the following in the ProfileSettings connection property:
- APIKey: Set this to your Clarifai Personal Access Token (PAT).
Built-in Connection String Designer
For assistance in constructing the JDBC URL, use the connection string designer built into the Clarifai JDBC Driver. Either double-click the JAR file or execute the jar file from the command-line.
java -jar cdata.jdbc.api.jar
Fill in the connection properties and copy the connection string to the clipboard.
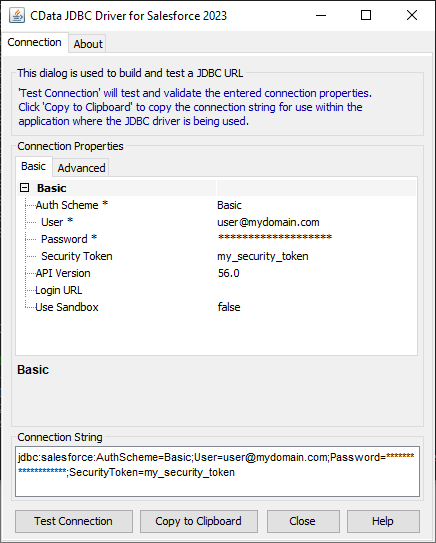
Below is a sample dbConnect call, including a typical JDBC connection string:
conn <- dbConnect(driver,"jdbc:api:Profile=C:\profiles\Clarifai.apip;AuthScheme=APIKey;ProfileSettings='APIKey=your_personal_access_token';")
Schema Discovery
The driver models Clarifai APIs as relational tables, views, and stored procedures. Use the following line to retrieve the list of tables:
dbListTables(conn)
Execute SQL Queries
You can use the dbGetQuery function to execute any SQL query supported by the Clarifai API:
apps <- dbGetQuery(conn,"SELECT Id, Name FROM Apps WHERE UserId = 'my-user-id'")
You can view the results in a data viewer window with the following command:
View(apps)
Plot Clarifai Data
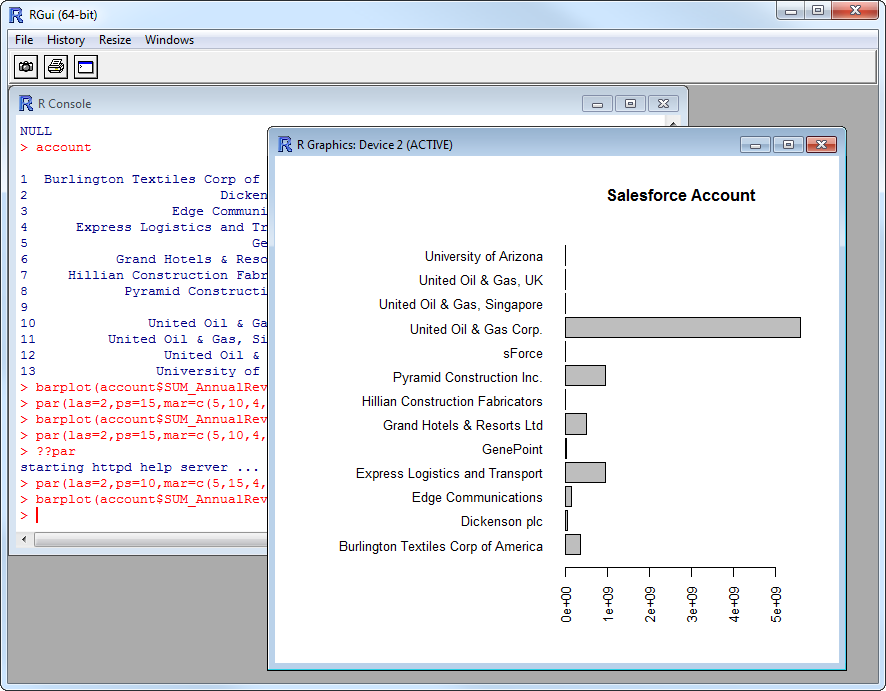
You can now analyze Clarifai data with any of the data visualization packages available in the CRAN repository. You can create simple bar plots with the built-in bar plot function:
par(las=2,ps=10,mar=c(5,15,4,2))
barplot(apps$Name, main="Clarifai Apps", names.arg = apps$Id, horiz=TRUE)