Analyze Clarifai Data in R via ODBC

Access Clarifai data with pure R script and standard SQL. You can use the CData ODBC Driver for Clarifai and the RODBC package to work with remote Clarifai data in R. By using the CData Driver, you are leveraging a driver written for industry-proven standards to access your data in the popular, open-source R language. This article shows how to use the driver to execute SQL queries to Clarifai data and visualize Clarifai data in R.
Install R
You can complement the driver's performance gains from multi-threading and managed code by running the multithreaded Microsoft R Open or by running R linked with the BLAS/LAPACK libraries. This article uses Microsoft R Open (MRO).
Connect to Clarifai as an ODBC Data Source
Information for connecting to Clarifai follows, along with different instructions for configuring a DSN in Windows and Linux environments.
Start by setting the Profile connection property to the location of the Clarifai Profile on disk (e.g. C:\profiles\Clarifai.apip). Next, set the ProfileSettings connection property to the connection string for Clarifai (see below).
Clarifai API Profile Settings
Clarifai uses Personal Access Tokens (PATs) for authentication. To obtain a PAT:
- Log in to your Clarifai account at https://clarifai.com.
- Navigate to your profile settings and select Security.
- Click Create Personal Access Token.
- Select the required scopes and click Create Token.
- Copy the generated token (it will only be shown once).
After obtaining your Personal Access Token, set the following connection properties:
- AuthScheme: Set this to APIKey.
Set the following in the ProfileSettings connection property:
- APIKey: Set this to your Clarifai Personal Access Token (PAT).
When you configure the DSN, you may also want to set the Max Rows connection property. This will limit the number of rows returned, which is especially helpful for improving performance when designing reports and visualizations.
Windows
If you have not already, first specify connection properties in an ODBC DSN (data source name). This is the last step of the driver installation. You can use the Microsoft ODBC Data Source Administrator to create and configure ODBC DSNs.
Linux
If you are installing the CData ODBC Driver for Clarifai in a Linux environment, the driver installation predefines a system DSN. You can modify the DSN by editing the system data sources file (/etc/odbc.ini) and defining the required connection properties.
/etc/odbc.ini
[CData API Source]
Driver = CData ODBC Driver for Clarifai
Description = My Description
Profile = C:\profiles\Clarifai.apip
AuthScheme = APIKey
ProfileSettings = 'APIKey = your_personal_access_token'
For specific information on using these configuration files, please refer to the help documentation (installed and found online).
Load the RODBC Package
To use the driver, download the RODBC package. In RStudio, click Tools -> Install Packages and enter RODBC in the Packages box.
After installing the RODBC package, the following line loads the package:
library(RODBC)
Note: This article uses RODBC version 1.3-12. Using Microsoft R Open, you can test with the same version, using the checkpoint capabilities of Microsoft's MRAN repository. The checkpoint command enables you to install packages from a snapshot of the CRAN repository, hosted on the MRAN repository. The snapshot taken Jan. 1, 2016 contains version 1.3-12.
library(checkpoint)
checkpoint("2016-01-01")
Connect to Clarifai Data as an ODBC Data Source
You can connect to a DSN in R with the following line:
conn <- odbcConnect("CData API Source")
Schema Discovery
The driver models Clarifai APIs as relational tables, views, and stored procedures. Use the following line to retrieve the list of tables:
sqlTables(conn)
Execute SQL Queries
Use the sqlQuery function to execute any SQL query supported by the Clarifai API.
apps <- sqlQuery(conn, "SELECT Id, Name FROM Apps WHERE UserId = 'my-user-id'", believeNRows=FALSE, rows_at_time=1)
You can view the results in a data viewer window with the following command:
View(apps)
Plot Clarifai Data
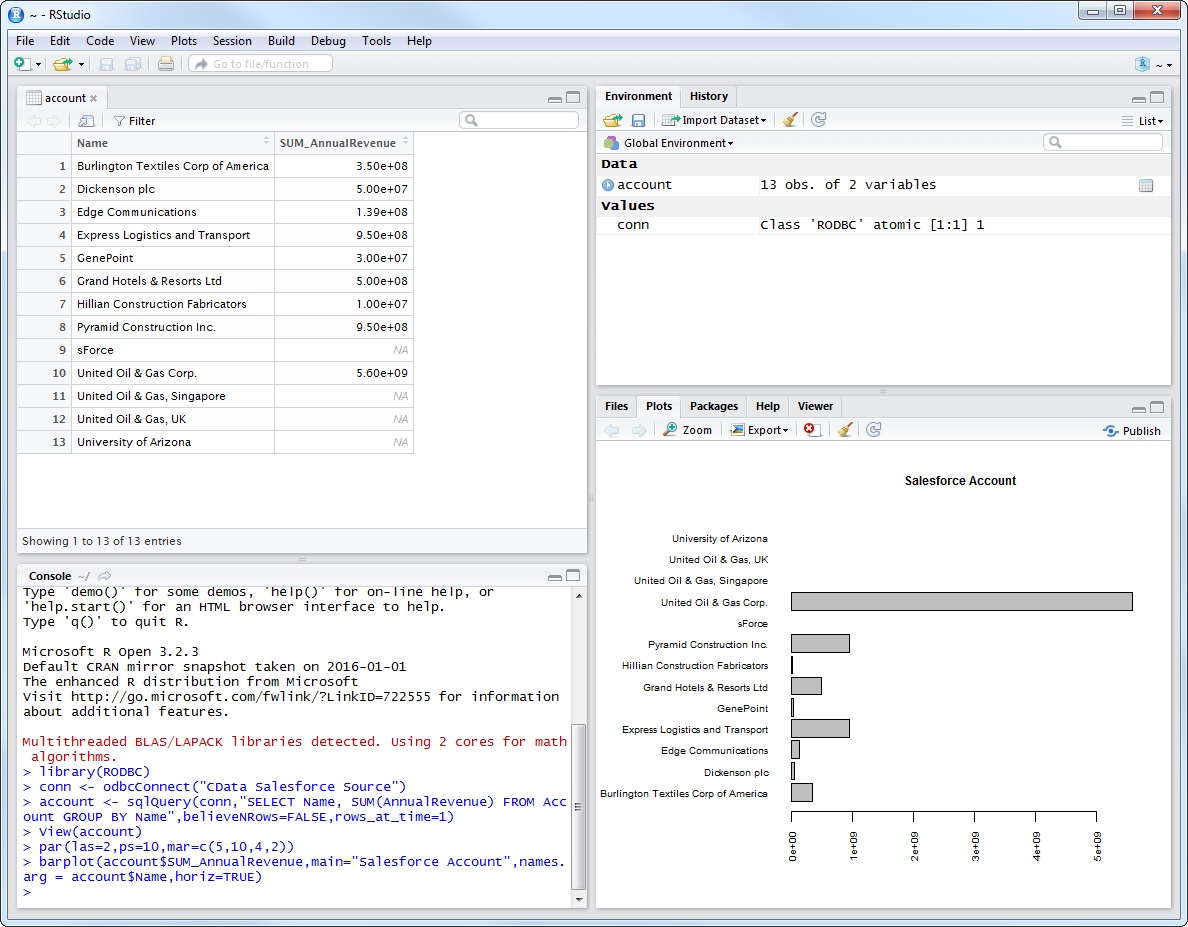
You can now analyze Clarifai data with any of the data visualization packages available in the CRAN repository. You can create simple bar plots with the built-in bar plot function:
par(las=2,ps=10,mar=c(5,15,4,2))
barplot(apps$Name, main="Clarifai Apps", names.arg = apps$Id, horiz=TRUE)