Visualize Clarifai Data in TIBCO Spotfire through ODBC

This article walks you through using the CData ODBC Driver for Clarifai in TIBCO Spotfire. You will use the data import wizard to connect to a DSN (data source name) for Salesforce and build on the sample visualizations to create a simple dashboard.
Connect to Clarifai as an ODBC Data Source
If you have not already, first specify connection properties in an ODBC DSN (data source name). This is the last step of the driver installation. You can use the Microsoft ODBC Data Source Administrator to create and configure ODBC DSNs.
Start by setting the Profile connection property to the location of the Clarifai Profile on disk (e.g. C:\profiles\Clarifai.apip). Next, set the ProfileSettings connection property to the connection string for Clarifai (see below).
Clarifai API Profile Settings
Clarifai uses Personal Access Tokens (PATs) for authentication. To obtain a PAT:
- Log in to your Clarifai account at https://clarifai.com.
- Navigate to your profile settings and select Security.
- Click Create Personal Access Token.
- Select the required scopes and click Create Token.
- Copy the generated token (it will only be shown once).
After obtaining your Personal Access Token, set the following connection properties:
- AuthScheme: Set this to APIKey.
Set the following in the ProfileSettings connection property:
- APIKey: Set this to your Clarifai Personal Access Token (PAT).
When you configure the DSN, you may also want to set the Max Rows connection property. This will limit the number of rows returned, which is especially helpful for improving performance when designing reports and visualizations.
Create Visualizations of Clarifai Tables
Follow the steps below to connect to the DSN and create real-time data visualizations:
- Click Data -> Add Data ...
- Click Other -> Load data with ODBC, OLE DB, or ADO.NET data provider.
- In the Data Source Type menu, select ODBC Data Provider and click Configure.
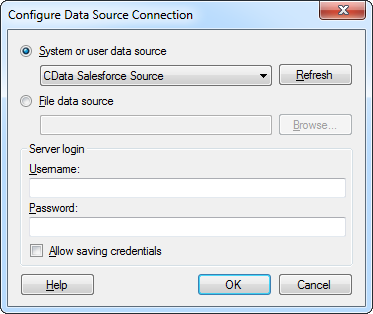
- Select the DSN.
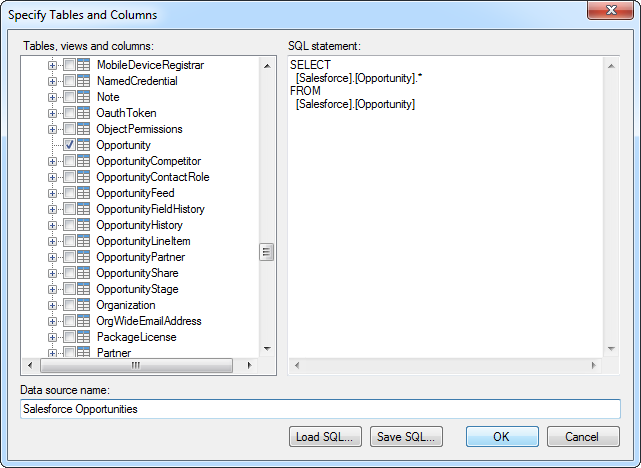
- Select the tables that you want to add to the dashboard. This example uses Apps. You can also specify an SQL query. The driver supports the standard SQL syntax.
- If you want to work with the live data, click the Keep Data Table External option. This option enables your dashboards to reflect changes to the data in real time.
If you want to load the data into memory and process the data locally, click the Import Data Table option. This option is better for offline use or if a slow network connection is making your dashboard less interactive.
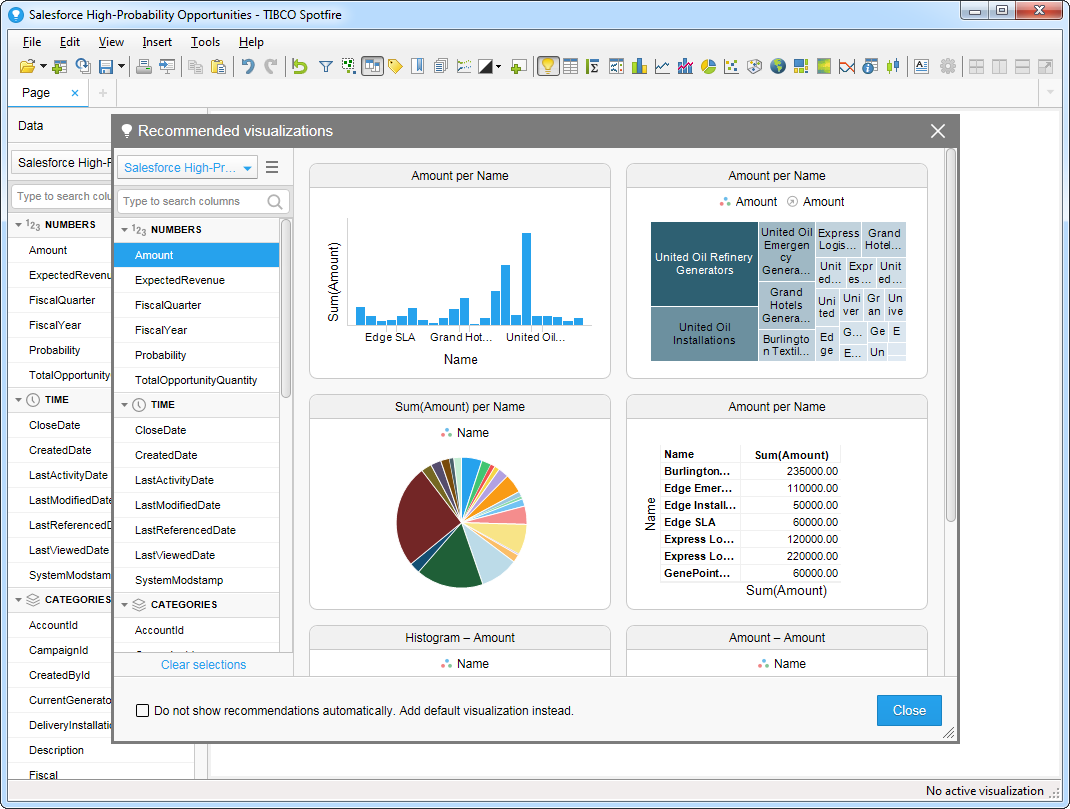
- After adding tables, the Recommended Visualizations wizard is displayed. When you select a table, Spotfire uses the column data types to detect number, time, and category columns. This example uses Name in the Numbers section and Id in the Categories section.
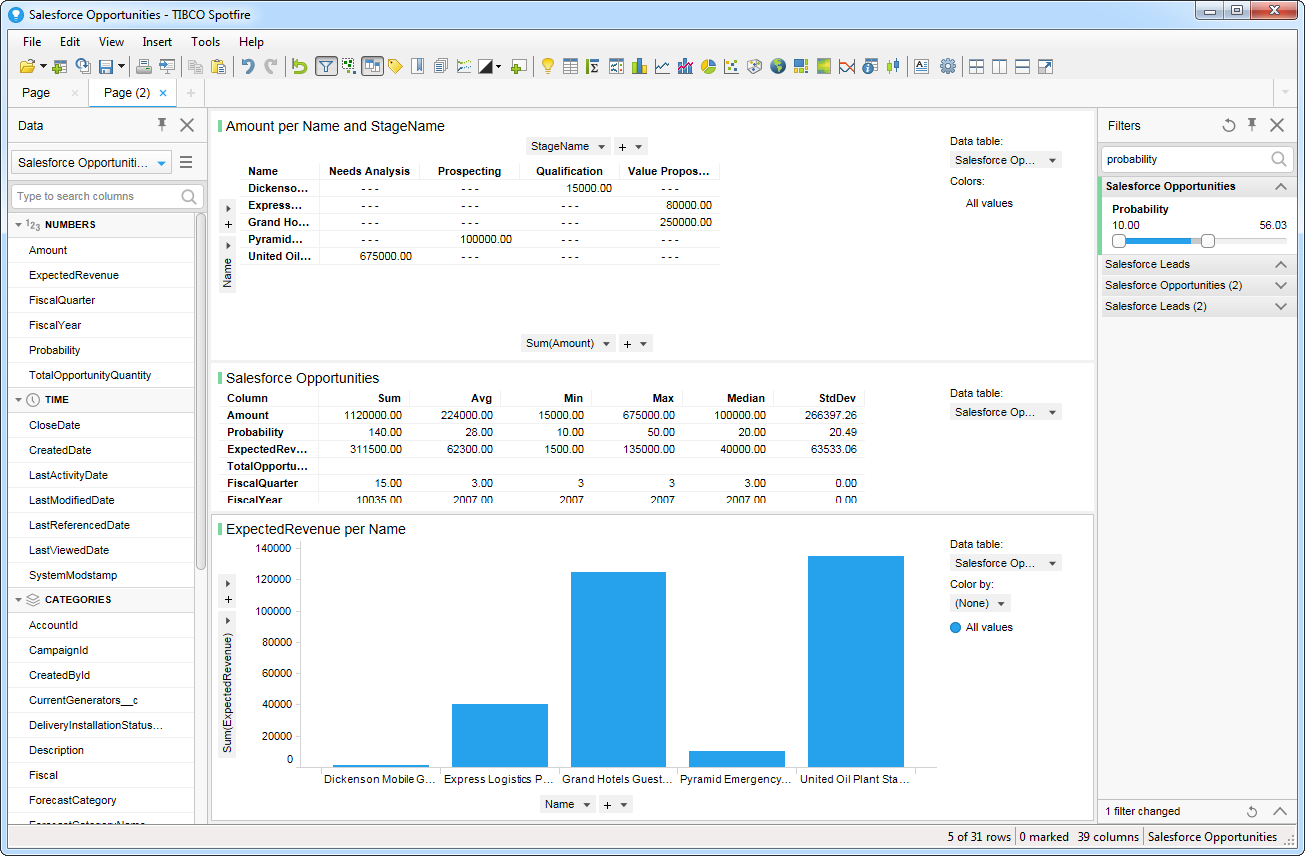
After adding several visualizations in the Recommended Visualizations wizard, you can make other modifications to the dashboard. For example, you can zoom in on high probability opportunities by applying a filter on the page. To add a filter, click the Filter button. The available filters for each query are displayed in the Filters pane.