




DataBind Charts to Claude Compliance Data

DataBinding facilitates two-way interaction with data through UI controls. Using the CData ADO.NET Provider for Claude Compliance streamlines the process of binding Claude Compliance data to Windows Forms and Web controls within Visual Studio. In this article, we will demonstrate using wizards to establish a binding between Claude Compliance data and a chart that dynamically updates. Additionally, the code walk-through section will guide you through the creation of a chart using just 10 lines of code.
Binding Data to a Chart
DataBinding to a Chart consists of three steps: Instantiate the control, configure the data source, and databind.
Configure the Connection and Select Database Objects
To create a chart control and establish a connection to Claude Compliance, follow the steps outlined below using the Data Source Configuration Wizard. Within the wizard, you'll have the option to choose the specific Claude Compliance entities you wish to bind to.
- In a Windows Forms project, drag and drop a Chart control from the toolbox to the form. In the Data section of the Chart properties, select DataSource and then select Add Project Data Source from the menu.
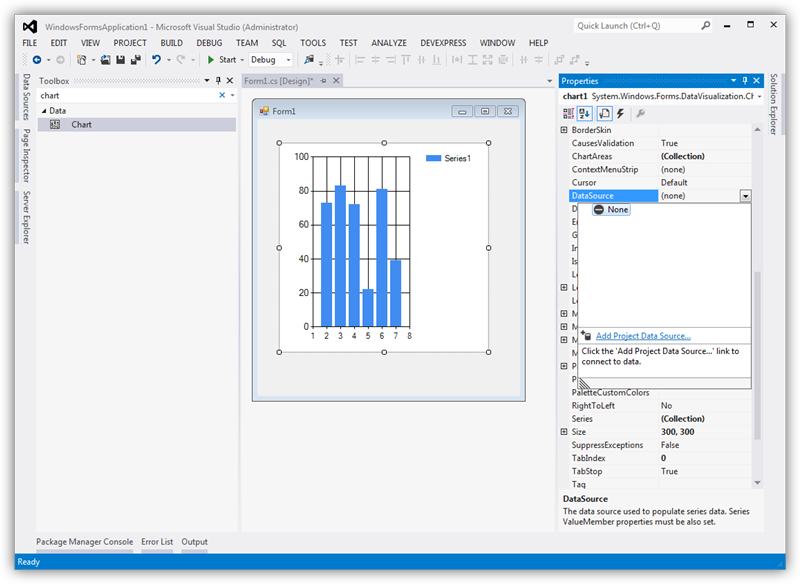
- In the Data Source Configuration Wizard that appears, select Database -> Dataset.
- In the Choose Your Data Connection step, click New Connection.
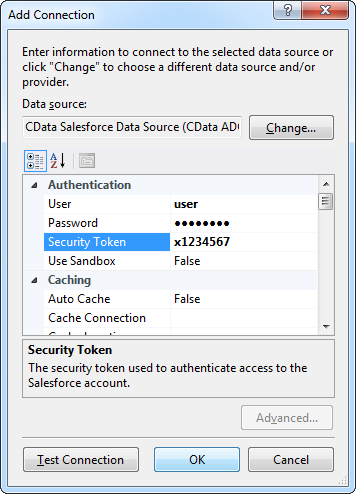
In the Add Connection dialog, click Change to select the CData Claude Compliance Data Source.
Below is a typical connection string:
APIKey=your_compliance_access_key;The driver connects to Claude Compliance using a Compliance Access Key, the only supported authentication method. Set the following connection property:
- APIKey: The Compliance Access Key you created.
Creating a Compliance Access Key
- Enable the Compliance API for your organization.
- Sign in to claude.ai as a primary owner or organization owner and open Organization settings > API > Keys.
- Select Create Key and assign only the scopes your integration needs:
- read:compliance_activities for Activities and the typed activity views.
- read:compliance_org_data for organizations, roles, groups, and settings.
- read:compliance_user_data for users, chats, files, projects, and downloads.
- delete:compliance_user_data for the explicit Delete stored procedures.
- Create the key and copy it when it appears. The key starts with sk-ant-api01- and is shown only once.
Optionally, set OrganizationUUID to limit organization-scoped views (such as OrganizationUsers and ComplianceRoles) to a single linked organization. If it is left empty, those views default to the first available organization and do not include data from all linked organizations.
When you configure the connection, you may also want to set the Max Rows connection property. This will limit the number of rows returned, which is especially helpful for improving performance when designing reports and visualizations.
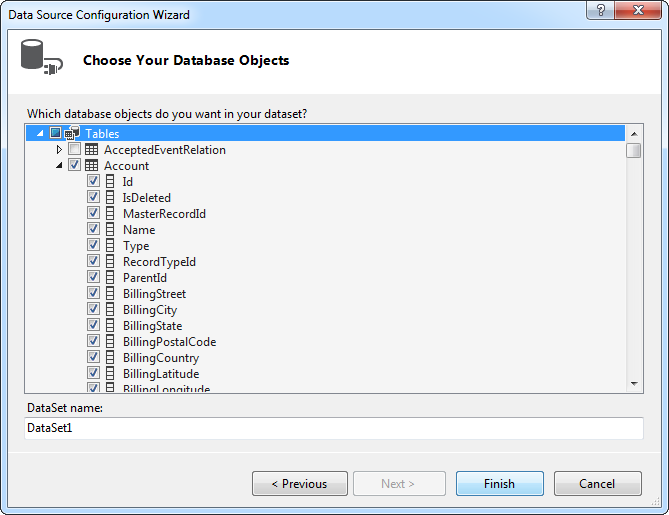
- Choose the database objects you want to work with. This example uses the Projects table.
DataBind
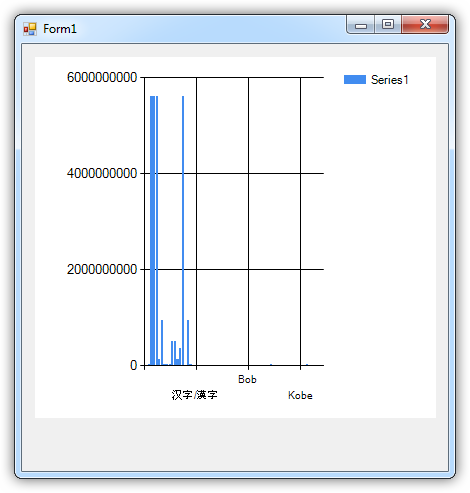
After adding the data source and selecting database objects, you can bind the objects to the chart. This example assigns the x-axis to Id and the y-axis to Name.
- In the Chart properties, click the button in the Series property to open the Series Collection Editor.
- In the Series properties, select the columns you want for the x- and y-axes: Select columns from the menu in the XValueMember and YValueMember properties.
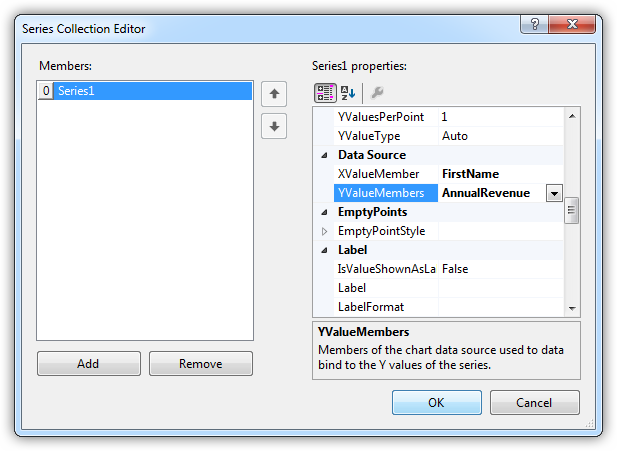
The chart is now databound to the Claude Compliance data. Run the chart to display the current data.
Code Walk-through
DataBinding to Claude Compliance data requires only a few lines of code and can be completed in three easy steps.
- Connect to Claude Compliance.
- Create the ClaudeComplianceDataAdapter to execute the query and create a DataSet to be filled with its results.
- DataBind the result set to the chart.
Below is the complete code:
ClaudeComplianceConnection conn = new ClaudeComplianceConnection("APIKey=your_compliance_access_key;");
ClaudeComplianceCommand comm = new ClaudeComplianceCommand("SELECT Id, Name FROM Projects WHERE OrganizationUuid = 'abcdef01-2345-6789-abcd-ef0123456789'", conn);
ClaudeComplianceDataAdapter da = new ClaudeComplianceDataAdapter(comm);
DataSet dataset = new DataSet();
da.Fill(dataset);

chart1.DataSource = dataset;
chart1.Series[0].XValueMember = "Id";
chart1.Series[0].YValueMembers = "Name";
// Insert code for additional chart formatting here.
chart1.DataBind();
Ready to get started?
Download a free trial of the Claude Compliance Data Provider to get started:
Download NowLearn more:
 Claude Compliance ADO.NET Provider
Rapidly create and deploy powerful .NET applications that integrate with Claude Compliance data including Activities, Chats, ChatMessages, CodeArtifacts, ComplianceRoles, Organizations, OrganizationUsers, Projects, and more!