




Create Reports from JD Edwards Data in Looker Studio

Looker Studio, formerly known as Google Data Studio, empowers users to craft customized reports featuring data visualizations that can be shared with clients while reflecting your brand identity. When combined with CData Connect AI, you gain immediate cloud-to-cloud access to JD Edwards data to create visualizations, dashboards, and more. This article provides step-by-step instructions on establishing a virtual database for JD Edwards and generating reports from JD Edwards data within Looker Studio.
CData Connect AI offers a seamless cloud-to-cloud interface tailored for JD Edwards, making it straightforward to construct reports directly from live JD Edwards data within Looker Studio without the need for data replication. As you create visualizations, Looker Studio generates queries to retrieve data. With its inherent optimized data processing capabilities, CData Connect AI efficiently channels all supported query operations, including filters, JOINs, and more, directly to JD Edwards. This leverages server-side processing to swiftly provide the requested JD Edwards data.
This article requires a CData Connect AI instance and the CData Connect AI Connector for Looker Studio. Get more information on the CData Connect AI and sign up for a free trial at https://www.cdata.com/cloud.
Configure JD Edwards Connectivity for Looker Studio
Connectivity to JD Edwards from Looker Studio is made possible through CData Connect AI. To work with JD Edwards data from Looker Studio, we start by creating and configuring a JD Edwards connection.
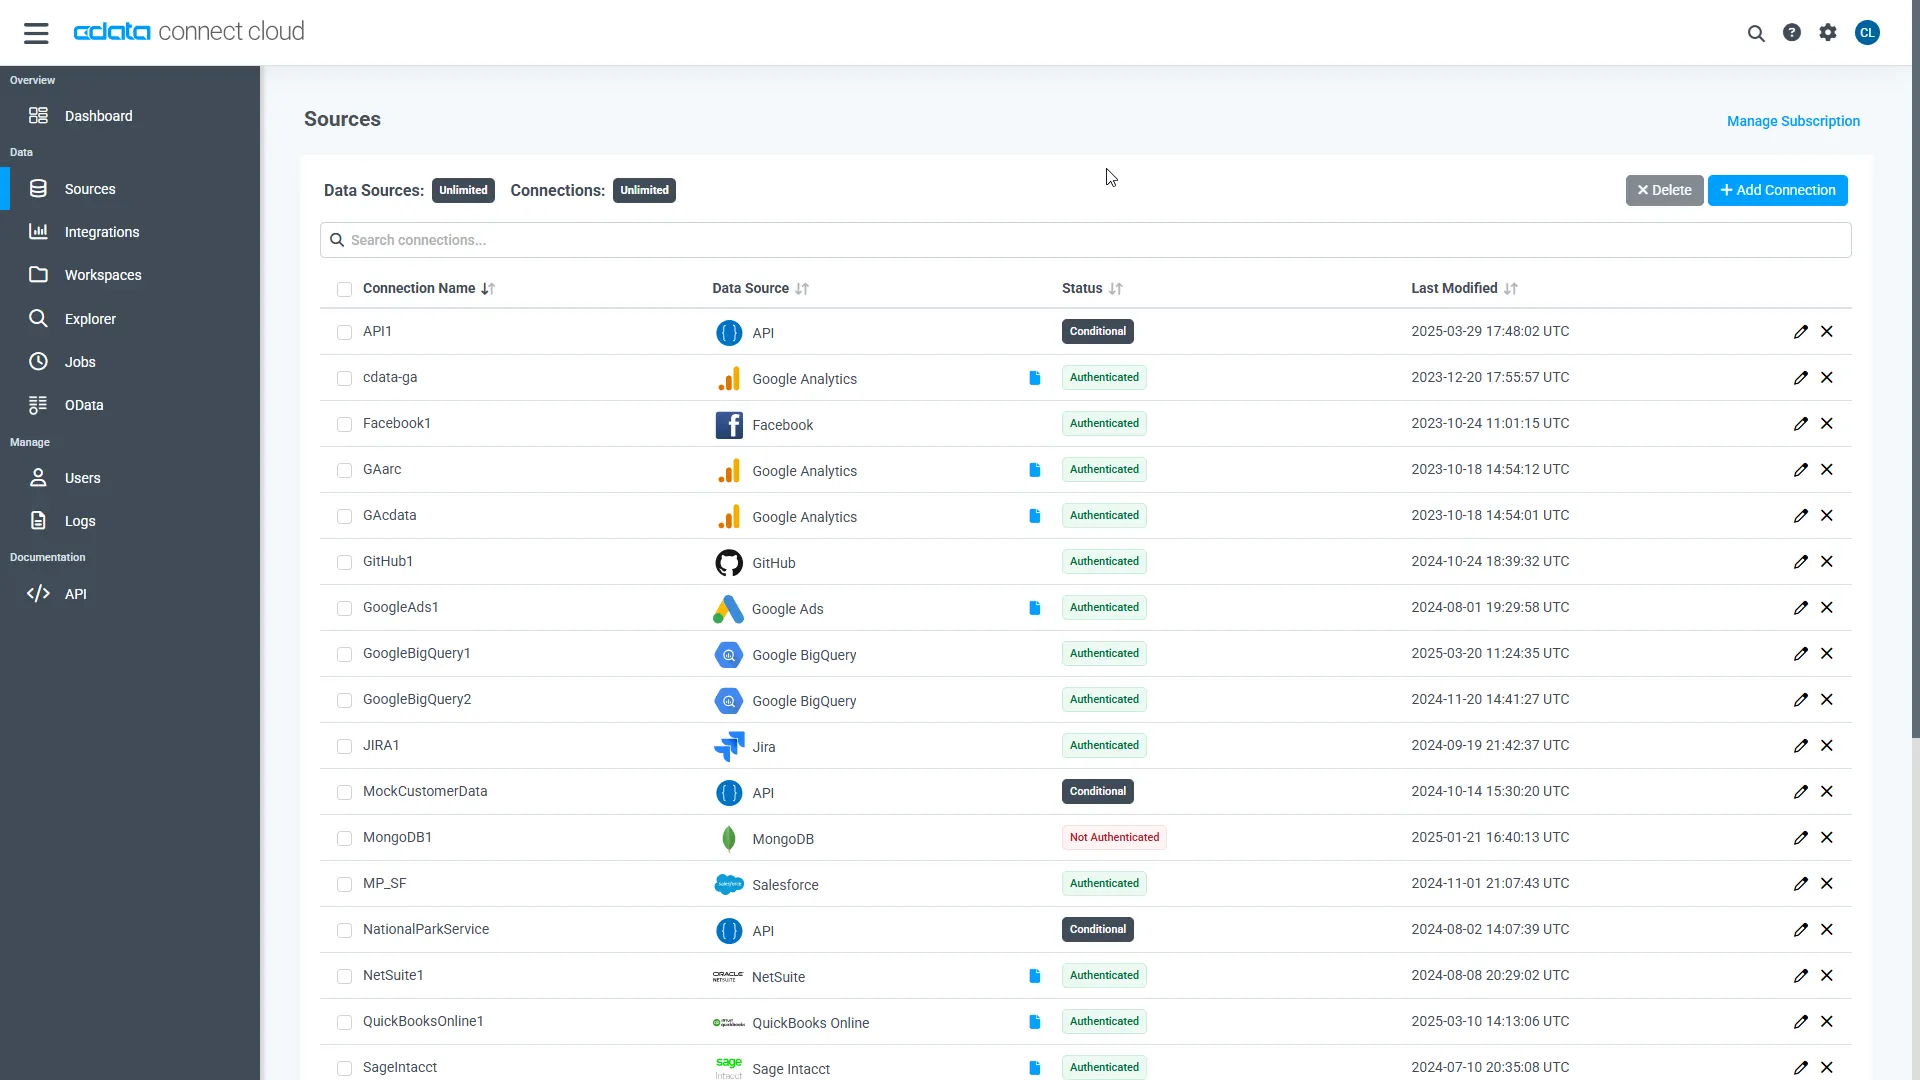
- Log into Connect AI, click Sources, and then click Add Connection
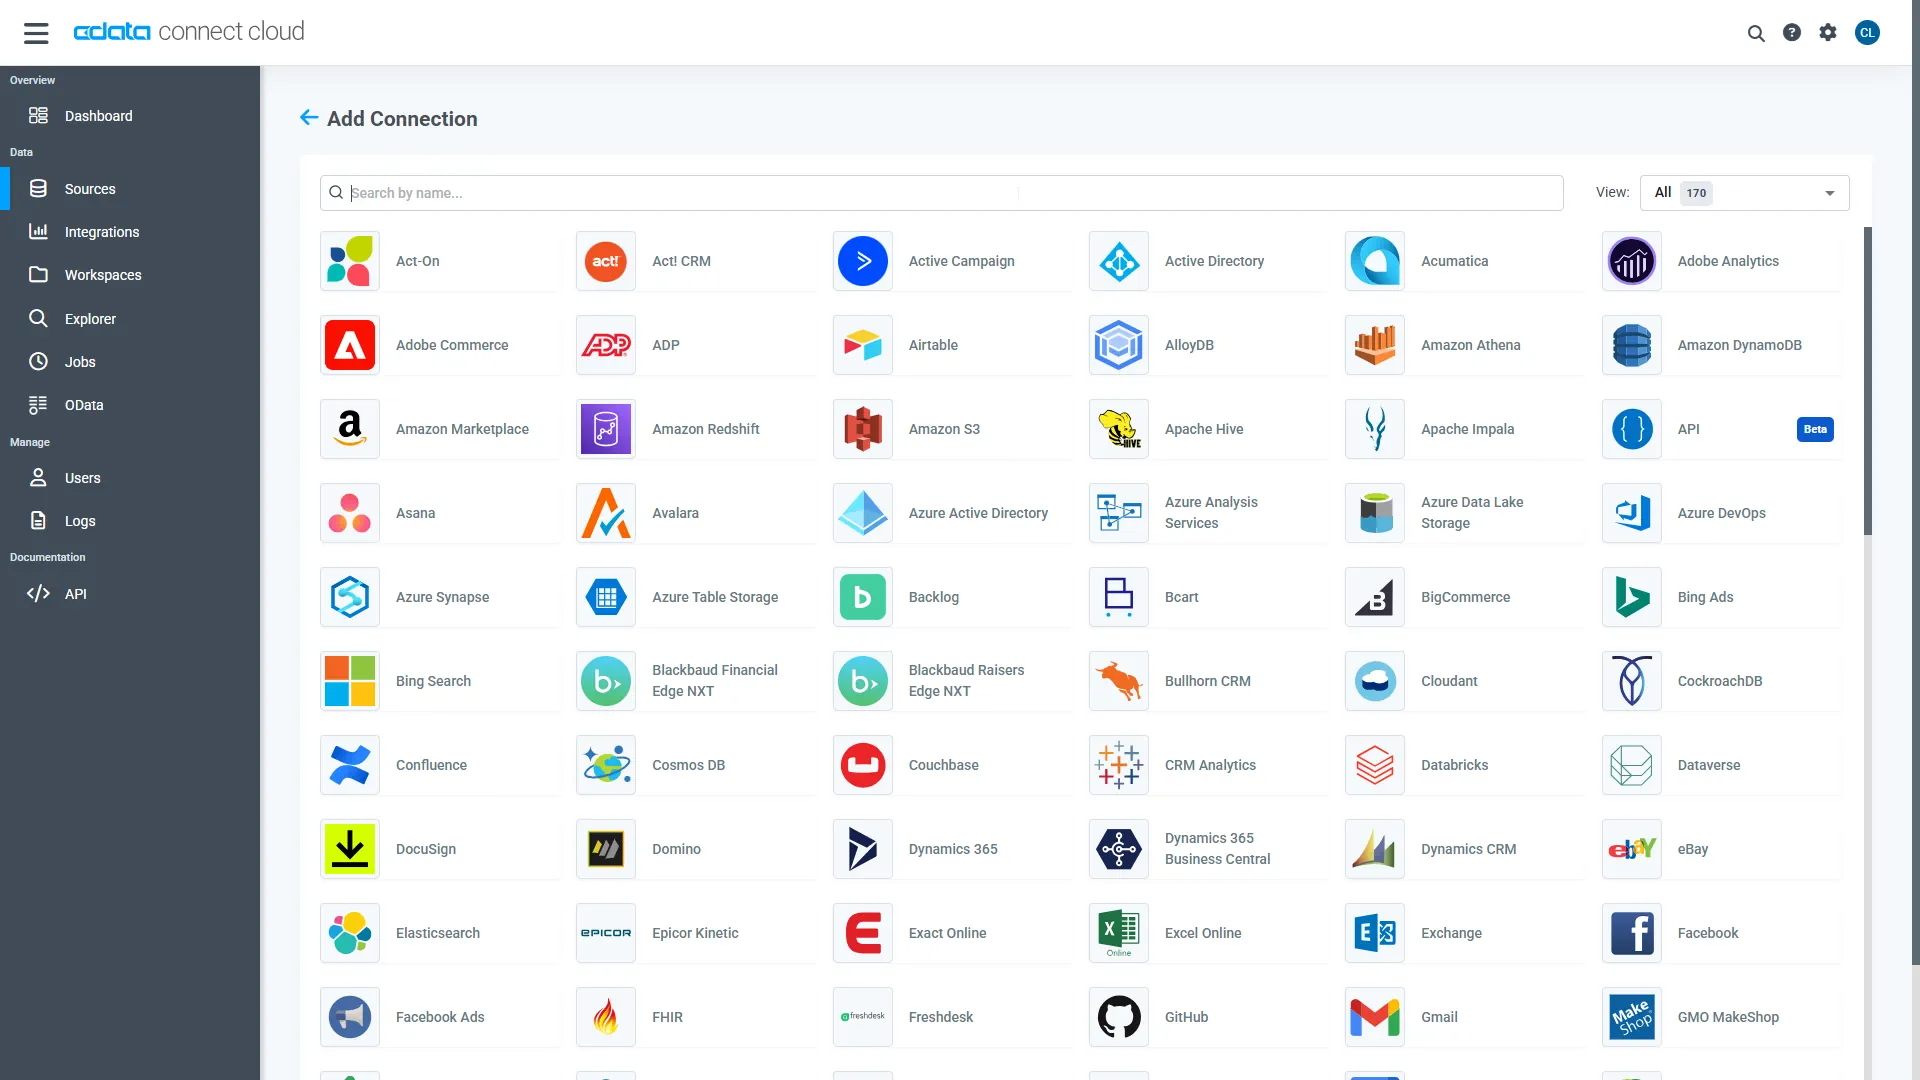
- Select "JD Edwards" from the Add Connection panel
-
Enter the necessary authentication properties to connect to JD Edwards.
The driver connects to JD Edwards through your Application Interface Services (AIS) Server. Set the following connection properties:
- URL: The base HTTPS URL of your AIS Server (e.g., https://jde-ais.example.com:8300).
- User: Your JD Edwards username.
- Password: Your JD Edwards password.
- Environment (optional): The JD Edwards environment to use (e.g., PD920 for production or DV920 for development). If not specified, the AIS Server's default environment is used.
- Role (optional): The JD Edwards role for the session. If not specified, the AIS Server's default role is used.
- DeviceName (optional): An identifier for the connecting device or application, used for auditing and logging on the AIS Server.
- Jasserver (optional): The specific Java Application Server (JAS) instance to route requests through, useful in clustered environments.
Choosing Which Data Is Exposed
JD Edwards organizes tables and business views by System Code, and the driver exposes each System Code as its own schema. Use these properties to control which schemas are available:
- DataModel: One or more ERP modules (comma-separated) whose System Codes are exposed as schemas, or All to expose every System Code in the connected instance. Defaults to FinancialManagement.
- SystemCodes: A comma-separated list of additional System Codes to expose alongside those from DataModel (e.g., 42,43).
When you connect, the driver sends your credentials to the AIS Server to obtain a session token and caches it. The driver requests a new token automatically before the session expires.
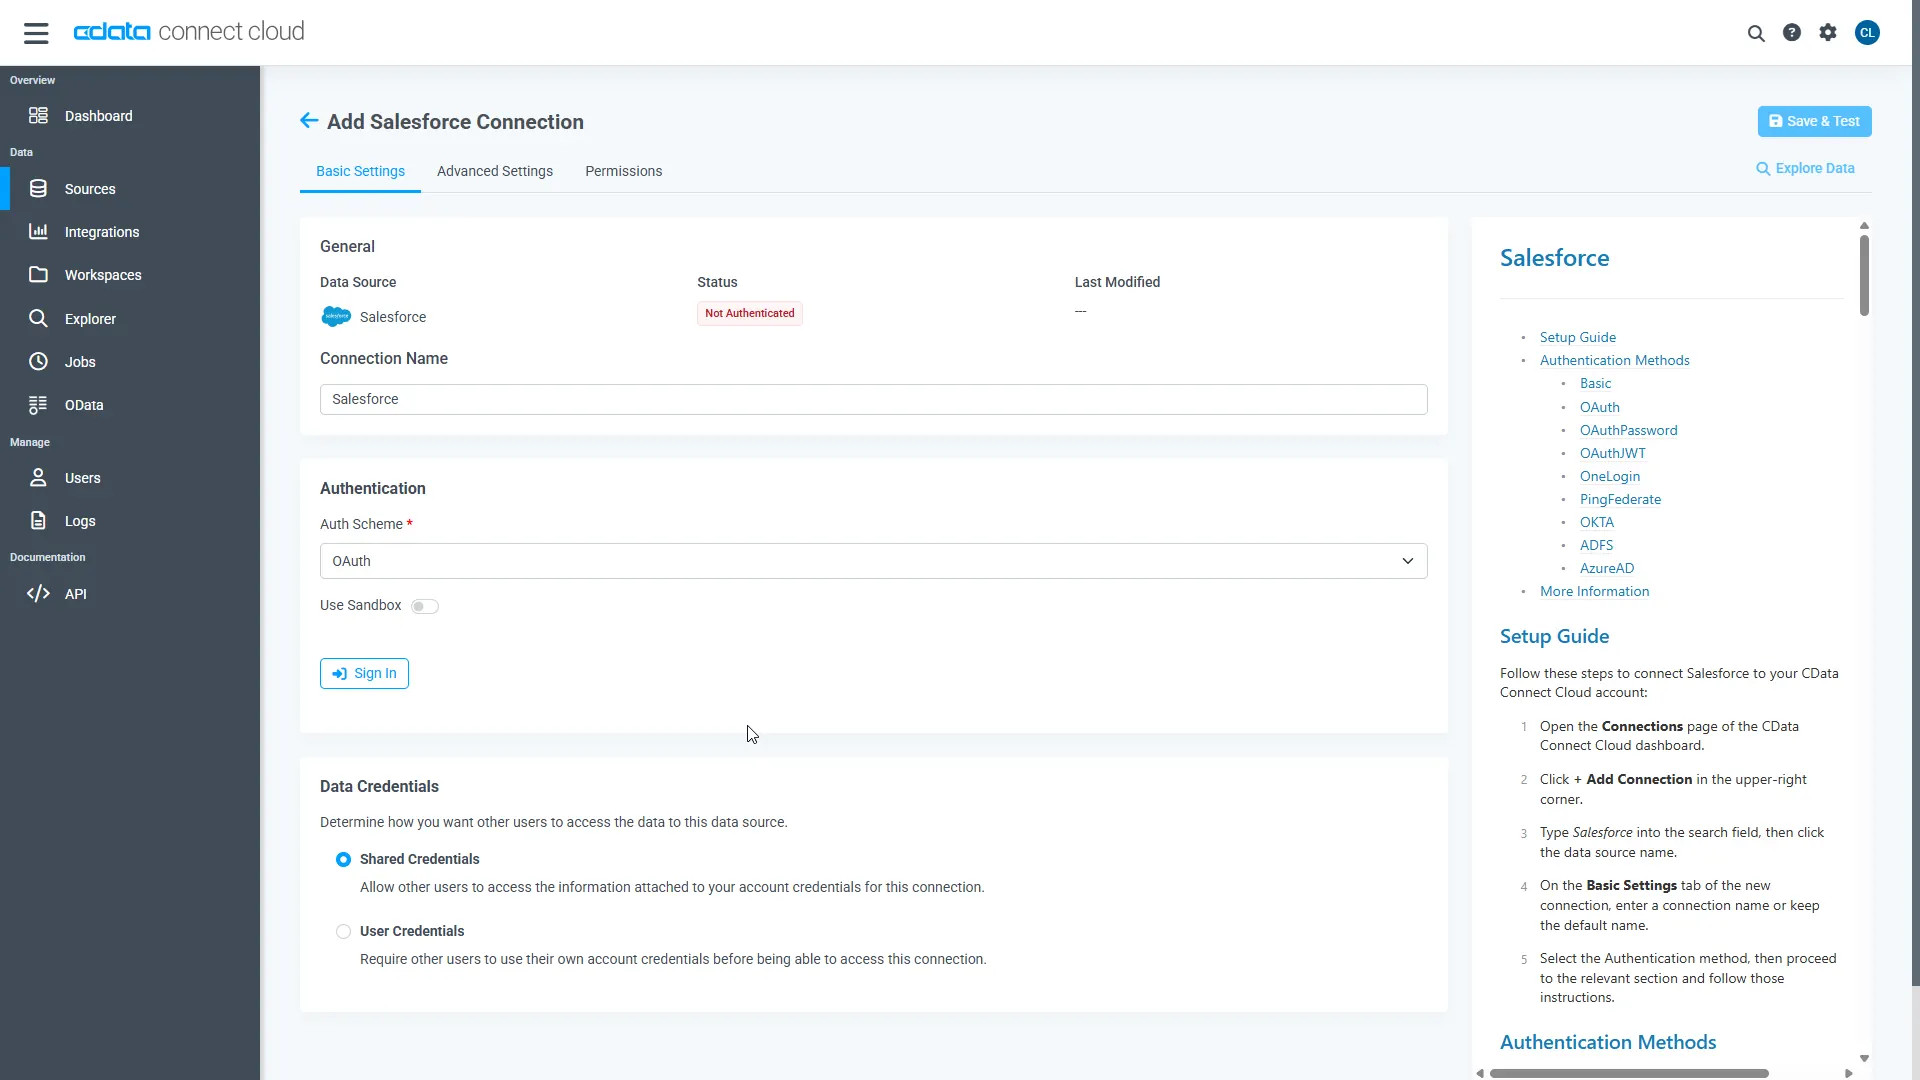
- Click Save & Test
-
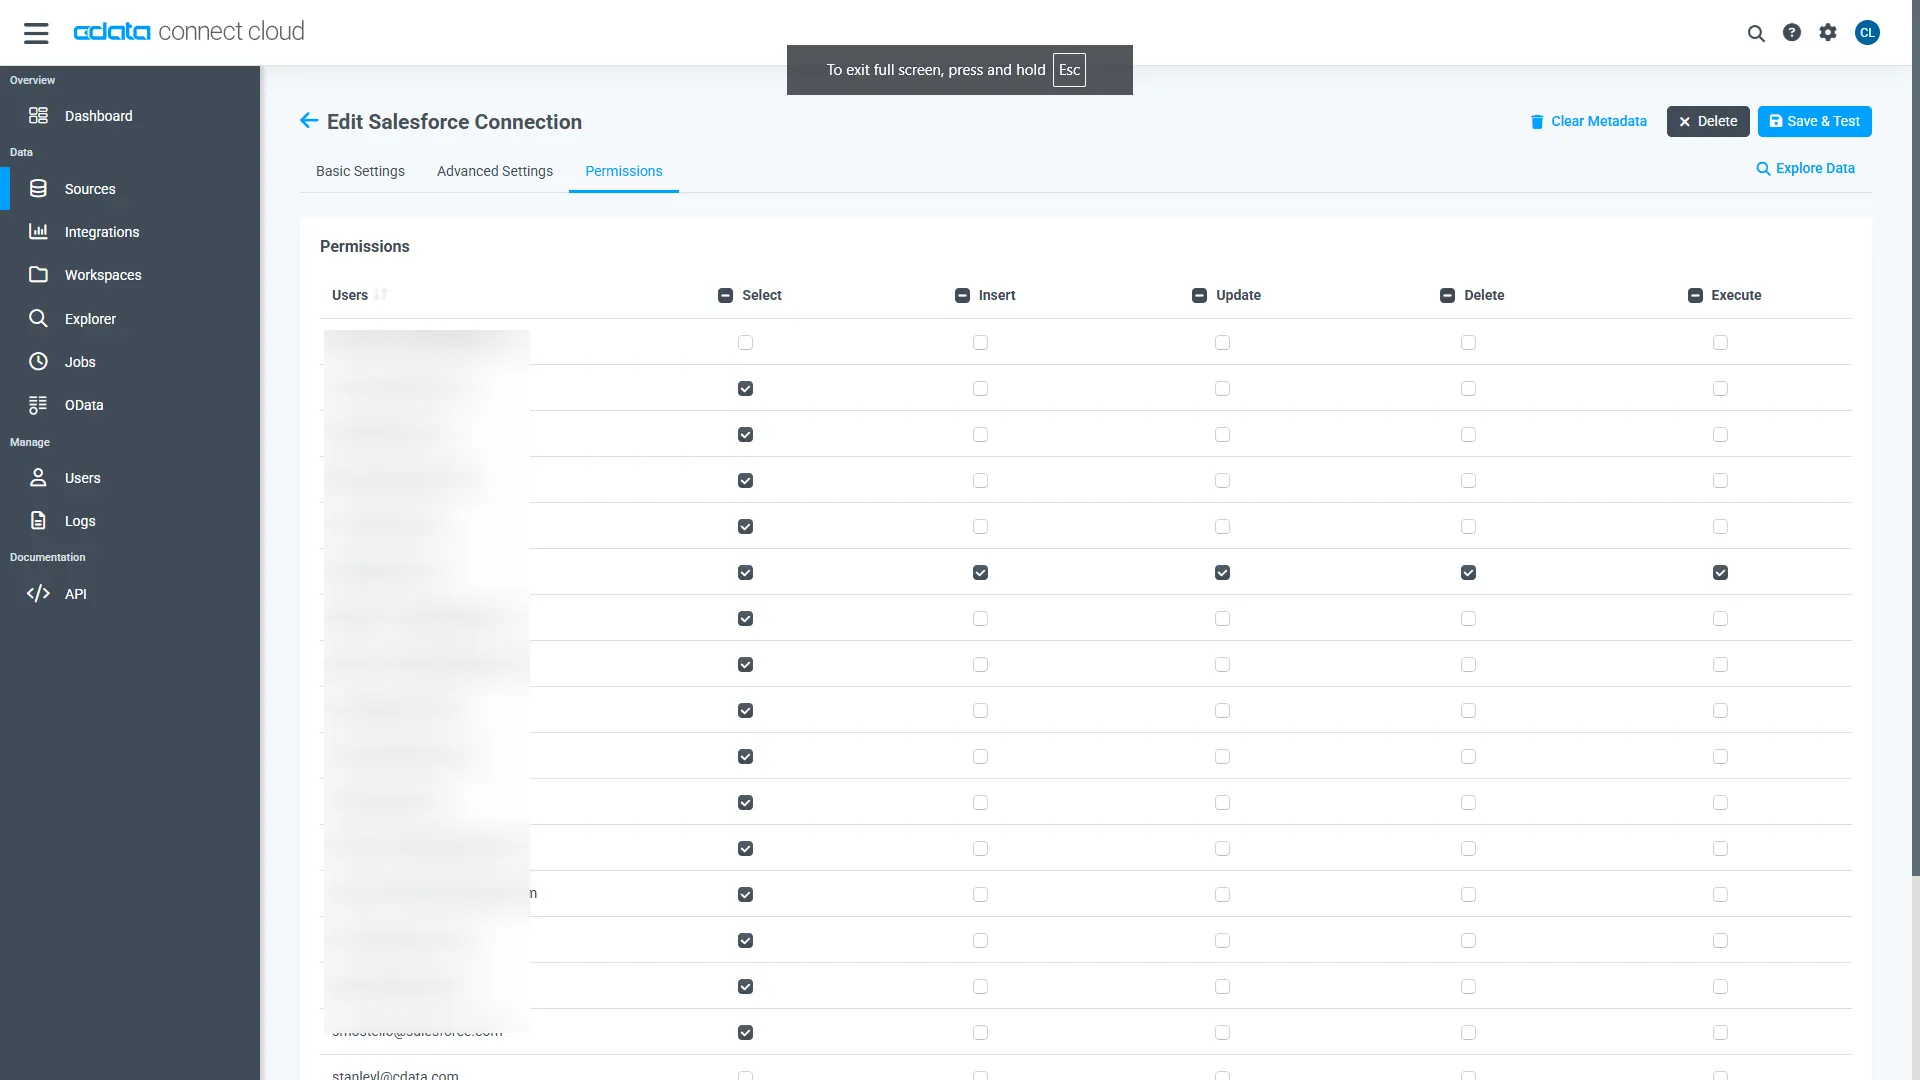
Navigate to the Permissions tab in the Add JD Edwards Connection page and update the User-based permissions.
With the connection configured, you are ready to connect to JD Edwards data from Looker Studio.
Visualize Live JD Edwards Data from Looker Studio
The steps below outline connecting to CData Connect AI from Looker Studio to create a new JD Edwards data source and build a simple visualization from the data.
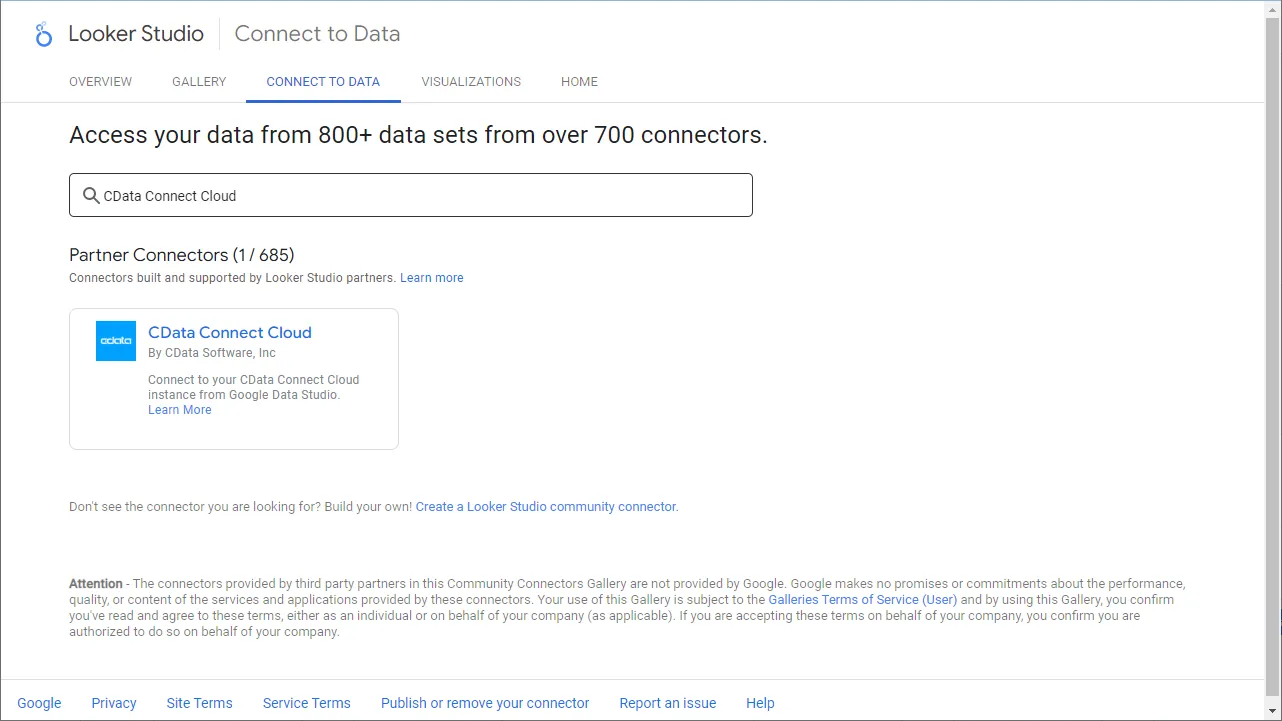
- Log into Looker Studio, click data sources, create a new data source, and choose CData Connect AI Connector.
- Click Authorize and allow access to your Google account.
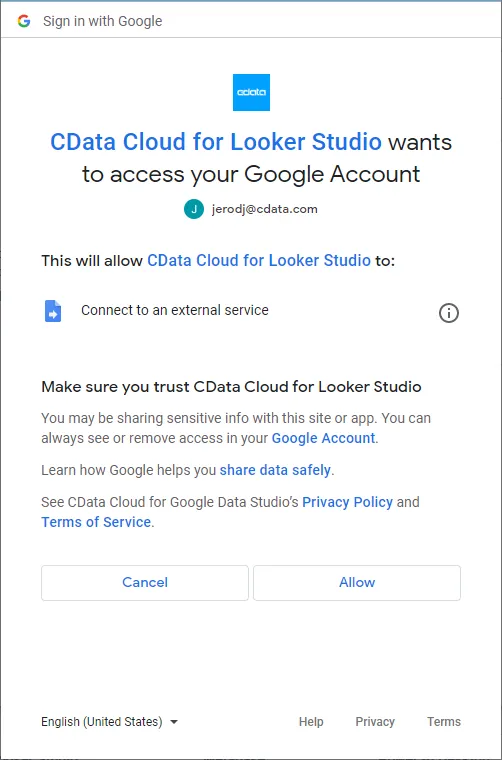
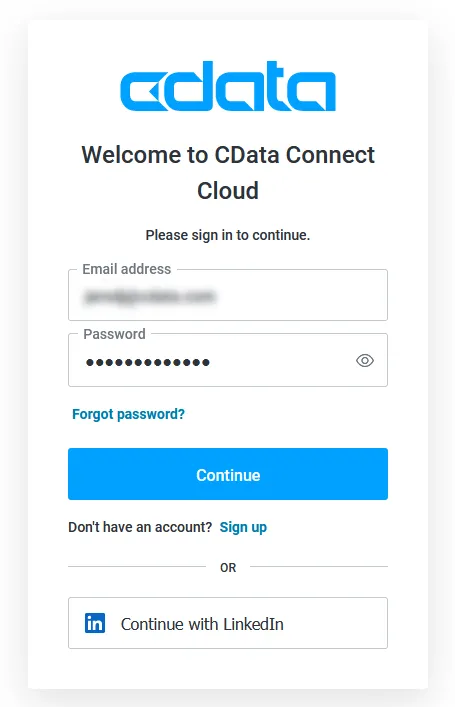
- Click Authorize to authenticate with your CData Connect AI instance
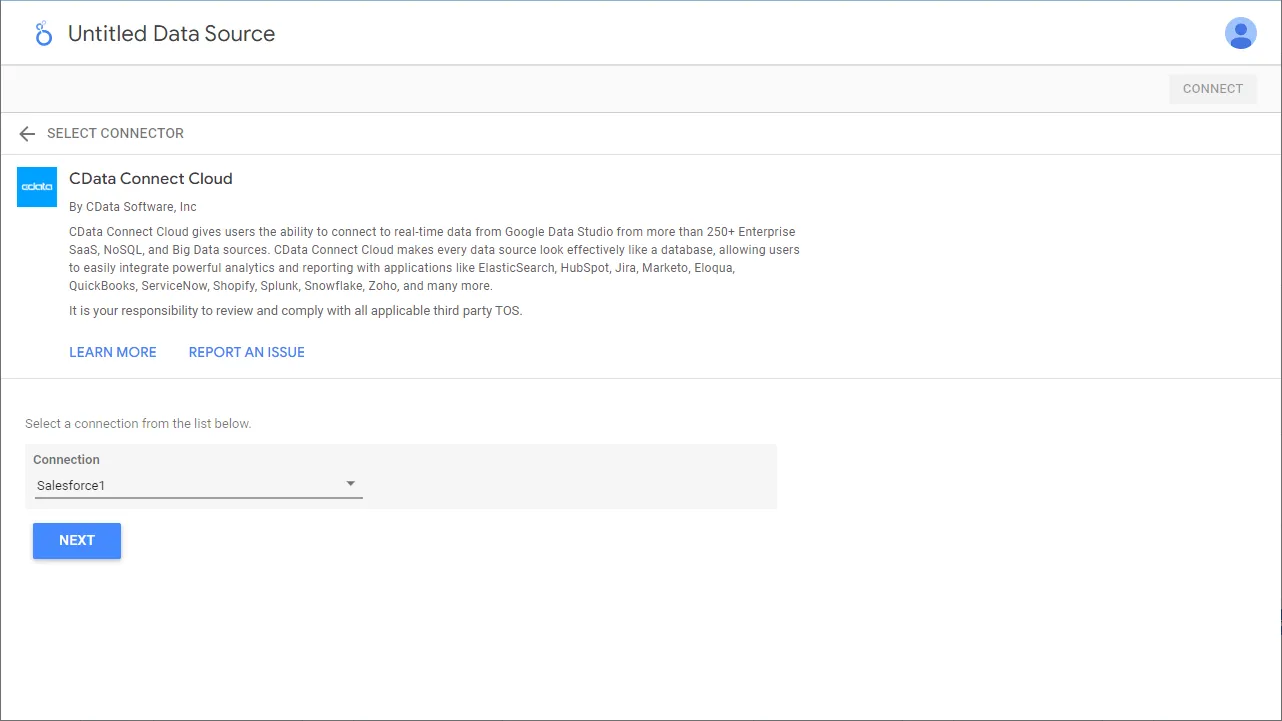
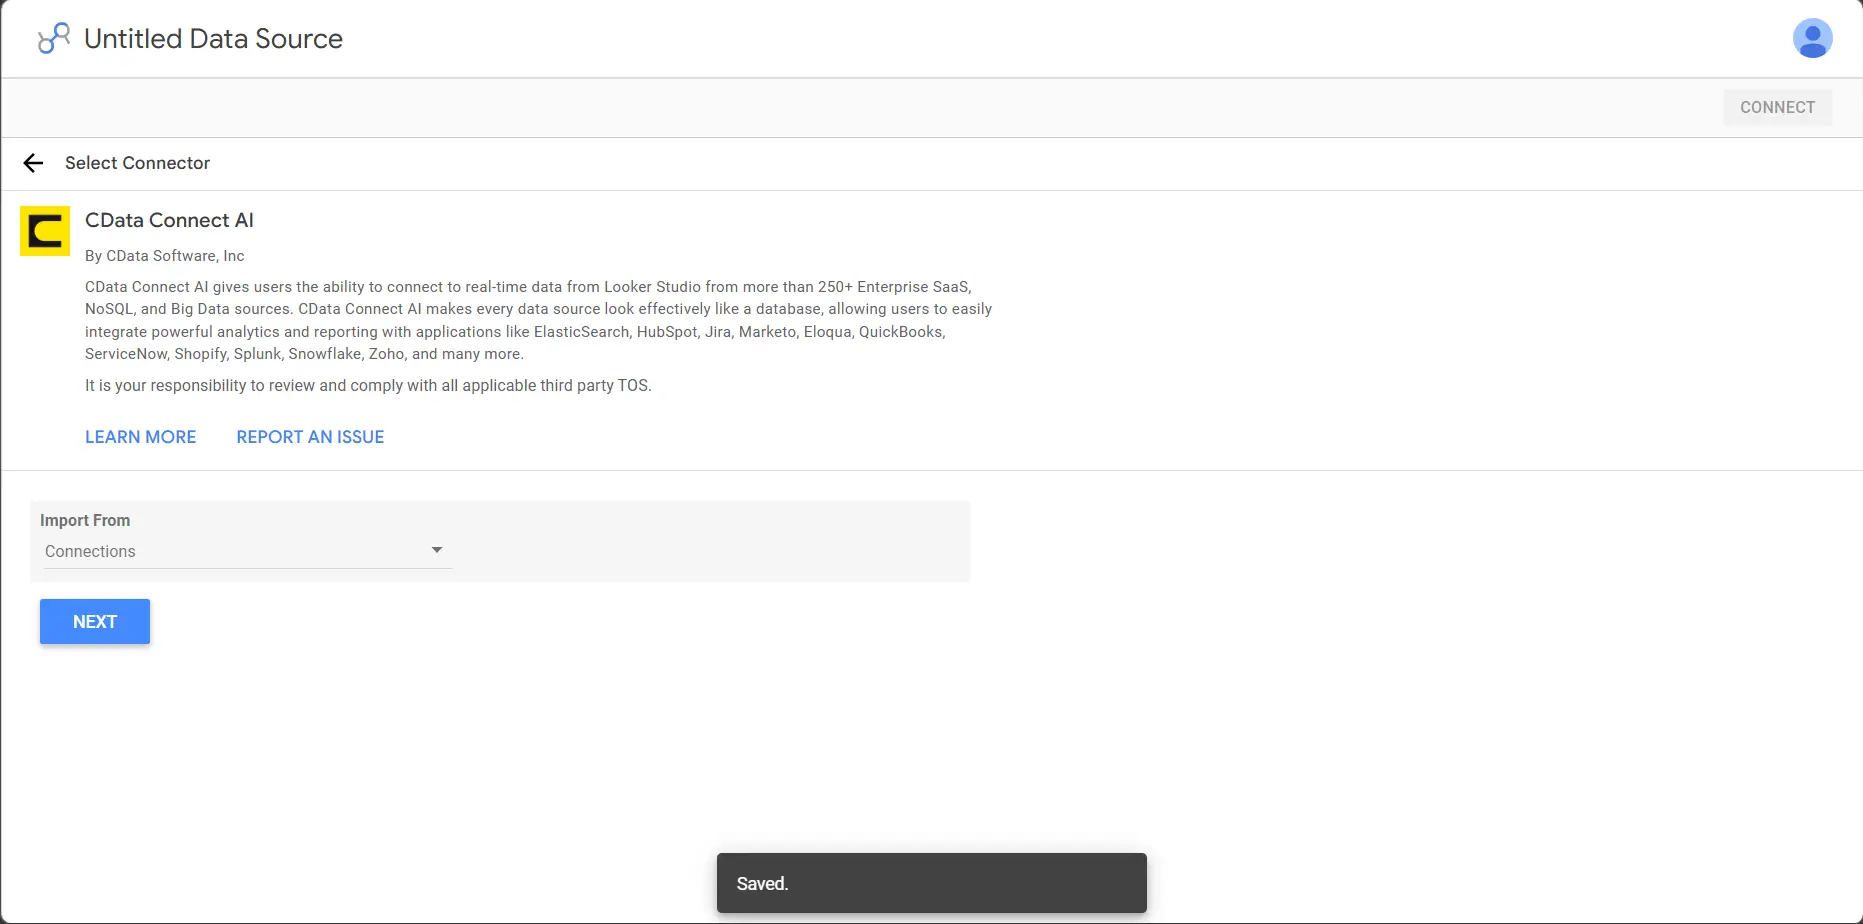
- In the CData Connect AI Connector in Looker Studio select Connections to import from the dropdown and click Next
- Now select a Connection (e.g. JDEdwards1) and click Next
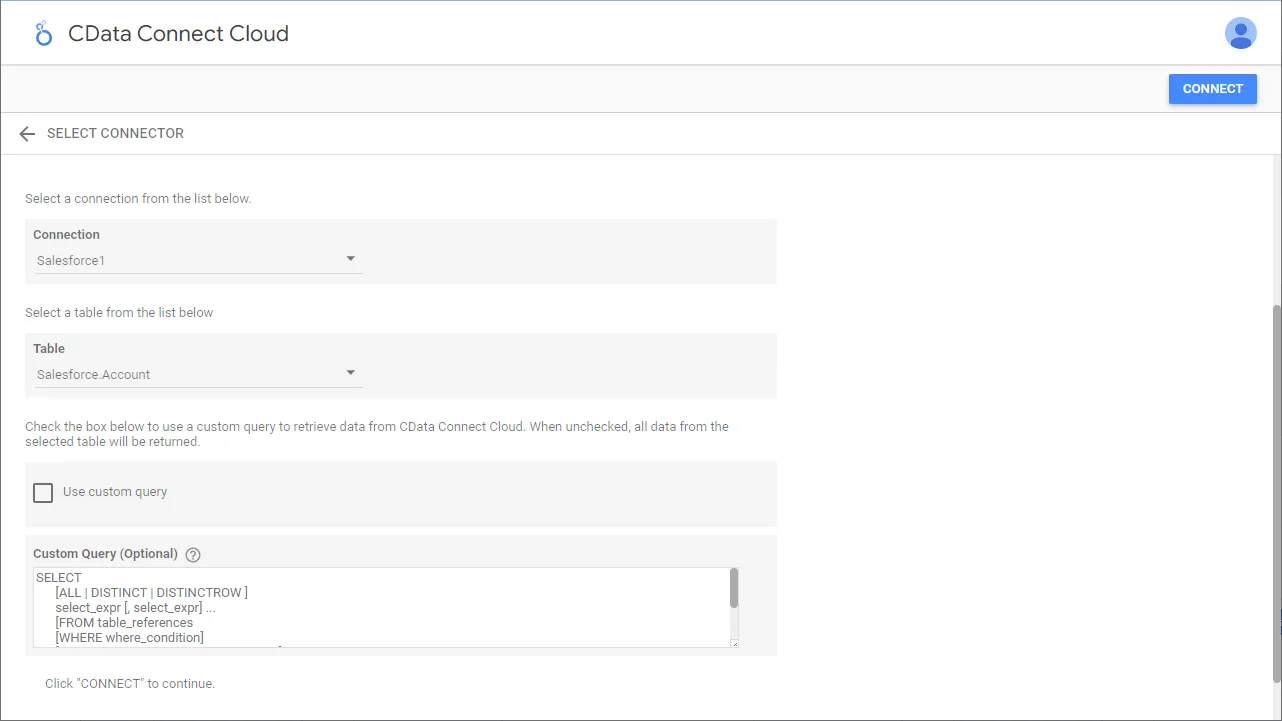
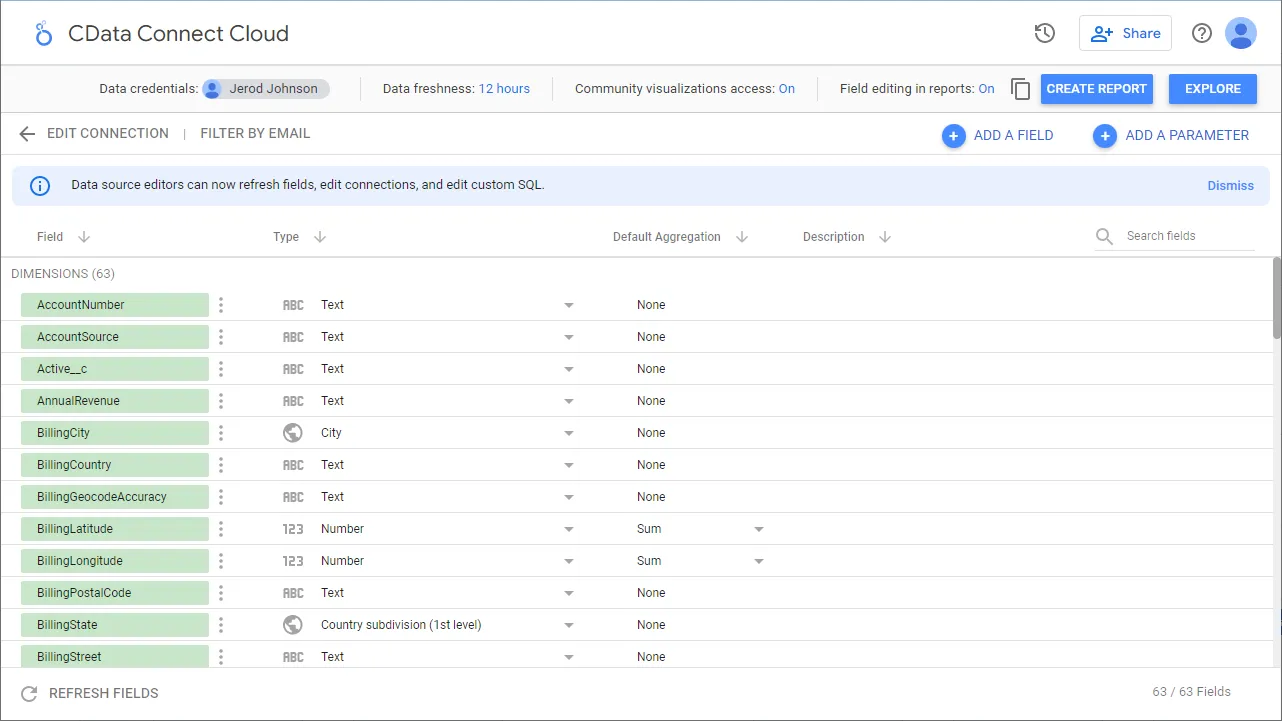
- Select a Table (e.g. AccountsPayable.AccountLedger) or use a Custom Query and click Connect to continue
- If needed, modify columns, click Create Report, and add the data source to the report.
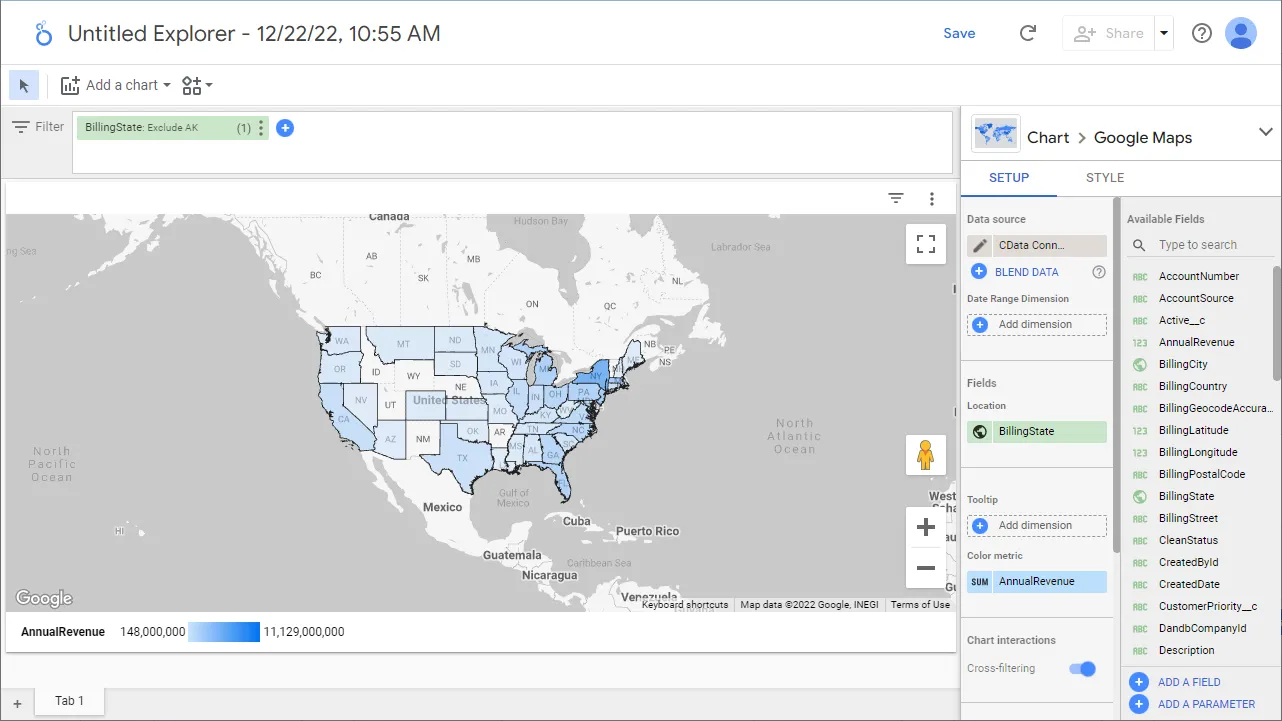
- Select a visualization style and add it to the report.
- Select Dimensions and Measures to customize your visualization.
Live Access to JD Edwards Data from Cloud Applications
Now you have a direct, cloud-to-cloud connection to live JD Edwards data from your Looker Studio workbook. You can create more data sources and new visualizations, build reports, and more — all without replicating JD Edwards data.
Try CData Connect AI and get real-time data access to hundreds of SaaS, Big Data, and NoSQL sources directly from your cloud applications.