




Visualize Sage X3 Cloud Data in TIBCO Spotfire through ODBC

This article walks you through using the CData ODBC Driver for Sage X3 Cloud in TIBCO Spotfire. You will use the data import wizard to connect to a DSN (data source name) for Salesforce and build on the sample visualizations to create a simple dashboard.
Connect to Sage X3 Cloud as an ODBC Data Source
If you have not already, first specify connection properties in an ODBC DSN (data source name). This is the last step of the driver installation. You can use the Microsoft ODBC Data Source Administrator to create and configure ODBC DSNs.
Sage X3 Cloud uses the OAuth 2.0 Client Credentials flow, and an X-API-Key is also required for API access. Set AuthScheme to OAuth and specify the following connection properties:
- URL: The base URL of your Sage X3 Cloud instance.
- OAuthAccessTokenUrl: The OAuth token endpoint (e.g., https://your-auth-domain/oauth/token).
- OAuthClientId: Your OAuth application client ID.
- OAuthClientSecret: Your OAuth application client secret.
- Audience: The API audience value for the token request.
- XAPIKey: The X-API-Key provided by your Sage X3 Cloud administrator.
- Folder: The Sage X3 folder name (e.g., SEED). This folder is used as the default schema.
- Folders (optional): A comma-separated list of Sage X3 folders (e.g., SEED,PERF). Each folder is exposed as a separate schema, so you can query across folders with the Schema.Table syntax.
The driver obtains an access token with the Client Credentials flow and sends it with the X-API-Key on every API request. With InitiateOAuth set to GETANDREFRESH (the default), the driver acquires and refreshes the token automatically.
When you configure the DSN, you may also want to set the Max Rows connection property. This will limit the number of rows returned, which is especially helpful for improving performance when designing reports and visualizations.
Create Visualizations of Sage X3 Cloud Tables
Follow the steps below to connect to the DSN and create real-time data visualizations:
- Click Data -> Add Data ...
- Click Other -> Load data with ODBC, OLE DB, or ADO.NET data provider.
- In the Data Source Type menu, select ODBC Data Provider and click Configure.
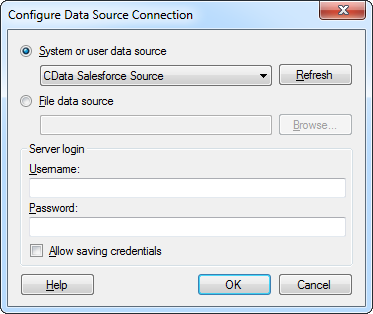
- Select the DSN.
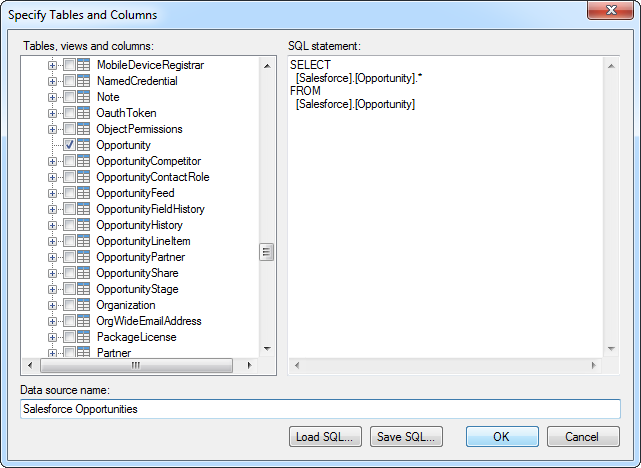
- Select the tables that you want to add to the dashboard. This example uses BPCUSTOMER. You can also specify an SQL query. The driver supports the standard SQL syntax.
- If you want to work with the live data, click the Keep Data Table External option. This option enables your dashboards to reflect changes to the data in real time.
If you want to load the data into memory and process the data locally, click the Import Data Table option. This option is better for offline use or if a slow network connection is making your dashboard less interactive.
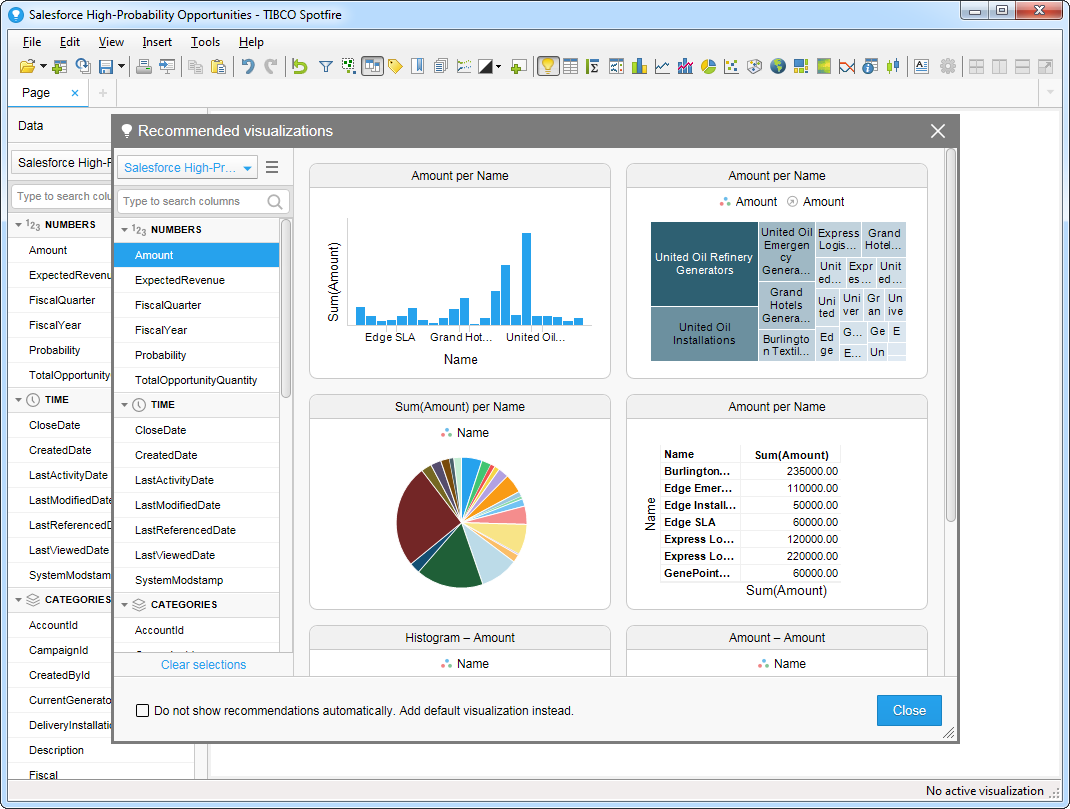
- After adding tables, the Recommended Visualizations wizard is displayed. When you select a table, Spotfire uses the column data types to detect number, time, and category columns. This example uses BPCNAM in the Numbers section and BPCNUM in the Categories section.
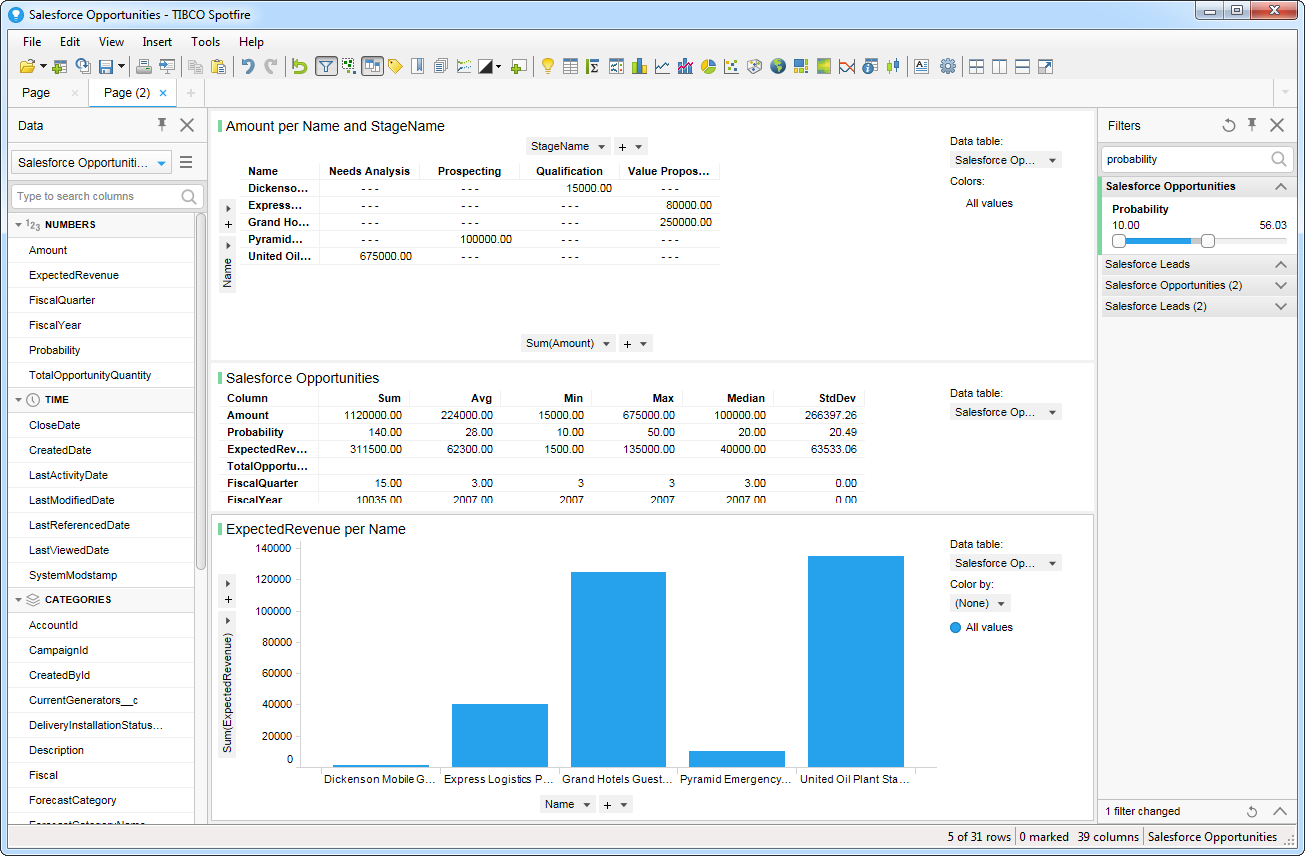
After adding several visualizations in the Recommended Visualizations wizard, you can make other modifications to the dashboard. For example, you can zoom in on high probability opportunities by applying a filter on the page. To add a filter, click the Filter button. The available filters for each query are displayed in the Filters pane.
Ready to get started?
Download a free trial of the Sage X3 Cloud ODBC Driver to get started:
Download NowLearn more:
 Sage X3 Cloud ODBC Driver
The Sage X3 Cloud ODBC Driver is a powerful tool that allows you to connect with live data from Sage X3 Cloud, directly from any applications that support ODBC connectivity.
Access Sage X3 Cloud data like you would a database - read, write, and update Sage X3 Cloud data through a standard ODBC Driver interface.