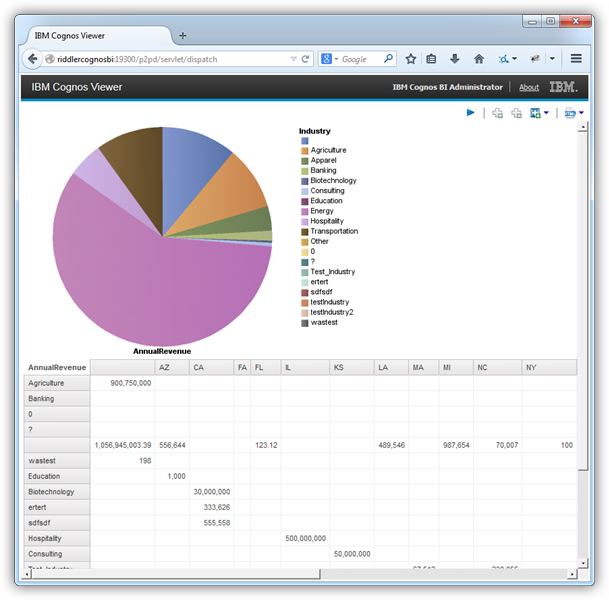
Create Data Visualizations in Cognos BI with UKG Pro WFM Data

You can use the CData ODBC driver for UKG Pro WFM to integrate UKG Pro WFM data with the drag-and-drop style of Cognos Report Studio. This article describes both a graphical approach to create data visualizations, with no SQL required, as well as how to execute any SQL query supported by UKG Pro WFM.
Configure and Publish the Data Source
If you have not already, first specify connection properties in an ODBC DSN (data source name). This is the last step of the driver installation. You can use the Microsoft ODBC Data Source Administrator to create and configure ODBC DSNs.
Start by setting the Profile connection property to the location of the UKGProWFM Profile on disk (e.g. C:\profiles\UKGProWFM.apip). Next, set the ProfileSettings connection property to the connection string for UKGProWFM (see below).
UKGProWFM API Profile Settings
UKG Pro Workforce Management uses OAuth 2.0 with the Resource Owner Password Credentials grant (grant_type=password) to authorize access to the API. Unlike most OAuth-based profiles, this does not use a browser redirect/authorization-code step: the driver exchanges your UKG Pro WFM username, password, client ID, and client secret directly for an access token.
Set the following connection properties to authenticate:
- AuthScheme: Set this to OAuthPassword.
- Host: Set this to the hostname of your UKG Pro Workforce Management datacenter/tenant (for example, yourcompany.mykronos.com). Do not include the protocol (https://) or a trailing slash.
- OAuthClientId: Set this to the client ID issued for your UKG Pro Workforce Management OAuth application.
- OAuthClientSecret: Set this to the client secret issued for your UKG Pro Workforce Management OAuth application.
- User: Set this to your UKG Pro Workforce Management username.
- Password: Set this to your UKG Pro Workforce Management password.
Access tokens are obtained from https://{Host}/api/authentication/access_token. Refresh tokens issued by UKG Pro Workforce Management expire after 7 days; if a refresh attempt fails because the refresh token itself has expired, the driver must re-authenticate with your User/Password credentials to obtain a new access token.
When you configure the DSN, you may also want to set the Max Rows connection property. This will limit the number of rows returned, which is especially helpful for improving performance when designing reports and visualizations.
If you are running Cognos from a 64-bit machine and want to modify the DSN or create other UKG Pro WFM DSNs, you must use a system DSN. You will also need to open the 32-bit ODBC Data Source Administrator. You can open it with the following command:
C:\Windows\sysWOW64\odbcad32.exe After creating a DSN, you can then publish the data source:
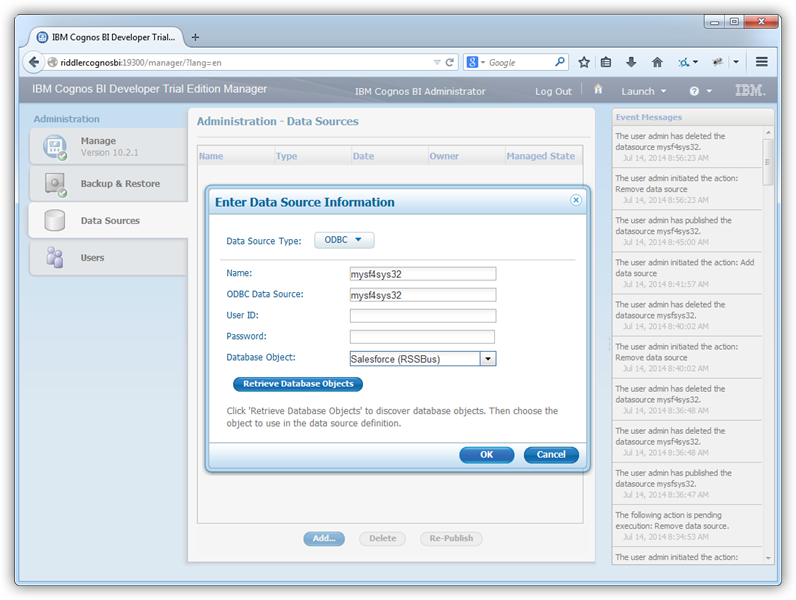
- Open Cognos Administration and click Data Source Connections to add a new data source:
-
Select the ODBC option and enter the DSN, CData API Sys, and a user-friendly name.
- Click Retrieve Objects and choose the CData UKG Pro WFM database object.
Add Data Visualizations to a Report
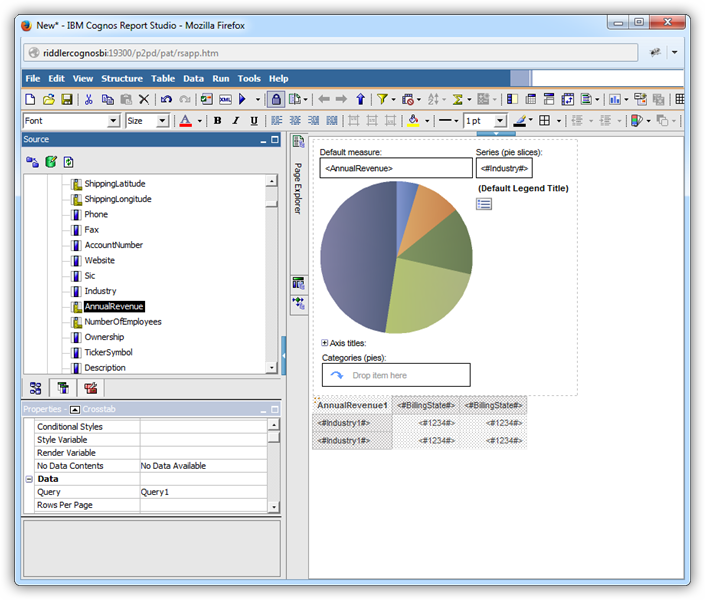
You can now create reports on UKG Pro WFM data in Cognos Report Studio by dragging and dropping table columns from the Source Explorer onto report objects. The sections below show how to create a simple report with a chart that shows up-to-date data.
As you build the report, Cognos Report Studio will generate SQL queries and rely on the driver to execute them. The driver will convert queries into requests to the UKG Pro WFM API. To execute queries to the live UKG Pro WFM data, the driver depends on the capabilities of the underlying API.
Create a Chart Based on an Aggregate
You can populate almost any report object in Cognos with UKG Pro WFM data by simply dragging and dropping columns from the Source Explorer onto the dimensions of the object. The column in the Series dimension of the chart is automatically grouped.
Additionally, Cognos sets a logical default aggregate function for the measure dimension based on the data type. For this example, override the default by clicking the UserName column in the Data Items tab and set the Aggregate Function property to Not Applicable. The Rollup Aggregate Function property must be set to Automatic.
Convert a Query Object to SQL
When you know the query you need, or if you want to adjust the generated query, convert a query object into an SQL statement. After a query has been converted to SQL, the UI controls are not available for the query object. Follow the procedure below to populate a chart with user-defined SQL.
Cognos will rely on the driver to execute the user-defined query. Using the driver's SQL engine ensures that queries will always return up-to-date results, as there is no cached copy of the data.
- Hover over the Query Explorer and click the Queries folder to display the query objects in your report.
-
If you want to edit the autogenerated query, click the button in the Generated SQL property for the query object. In the resulting dialog, click Convert.
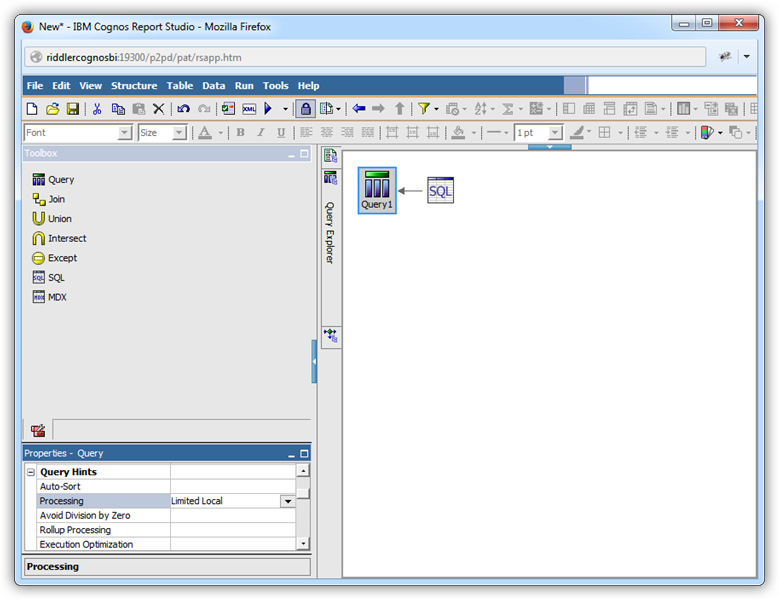
If you want to enter a new SQL statement, drop an SQL object in-line with the query object.
- Modify the properties for the SQL object: Select the UKG Pro WFM data source in the SQL properties and set the SQL Syntax property to Native.
Click the button in the SQL property and enter the SQL query in the resulting dialog. This example uses the query below:
SELECT PersonNumber, UserName FROM Employees WHERE PersonId = '12345'Modify the properties for the query object: Set the Processing property to "Limited Local". This value is required to convert a query object to SQL.
Fill a Chart with the Results of a Query
You can now access the results of the SQL query as objects in the Data Items tab. Follow the procedure below to create a chart with the results; for example, the UserName for each PersonNumber from the Employees table.
- Return to the page by hovering over the Page Explorer and then clicking the page object.
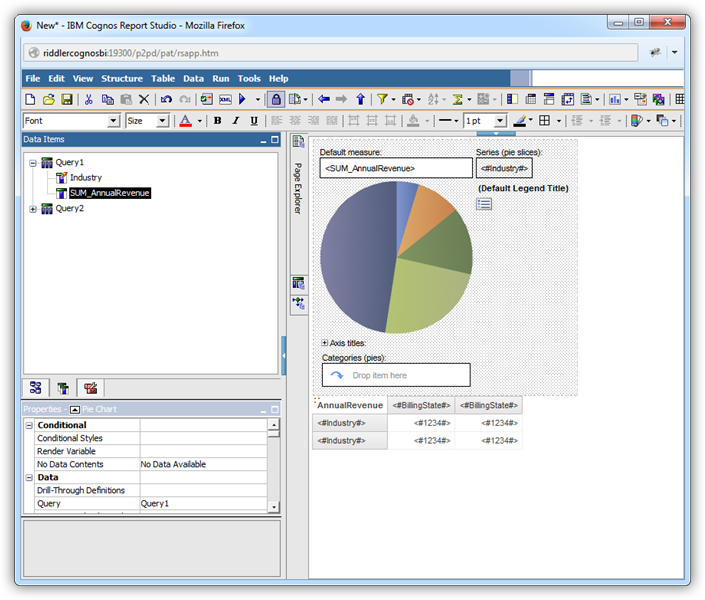
- Drag a pie chart from the toolbox onto the workspace.
- In the properties for the chart, set the Query property to the name of the query you created above.
- Click the Data Items tab and drag columns onto the x- and y-axes. In this example, drag the PersonNumber column to the Series (pie slices) box and the UserName column to the Default Measure box.
-
Modify the default properties for the Default Measure (the UserName values): In the Aggregate Function box, select the Total option.
Run the report to add the results of the query.