Using ThreadID in CData Driver Logs to Debug Multi-Threaded Operations
CData Drivers include a ThreadID in their log output, making it easier to trace activity across threads in multi-threaded applications. The ThreadID appears in fixed-width format to maintain readability and alignment, even in verbose logs.
This feature helps teams quickly link specific log lines to background threads, concurrent processes, or isolated operations—especially useful in highly parallel environments such as complex ETL pipelines, multi-session data syncs, or web integrations running simultaneous API requests. By identifying which thread generated each log entry, you can separate overlapping operations and pinpoint concurrency issues with greater accuracy.
In this guide, we'll show how to read the ThreadID value in a log file and use it to analyze and debug multi-threaded activity. You'll learn how to correlate log entries across threads, isolate errors to a specific execution path, and improve visibility into concurrent driver behavior.
We'll use the CData Salesforce ODBC Driver for this example, but the same approach applies to all CData drivers that support logging.
Let's begin!
Prerequisites
- A CData Salesforce ODBC Driver (or the driver for your specific data source) version 24.2 or higher.
- An active Salesforce (or corresponding data source) account with valid credentials.
Steps Overview
Below is a quick overview of the steps we'll follow:
- Log: Configure a connection to your data source and generate a log file.
- Analyze: Examine the generated log to identify and interpret ThreadID values.
Step 1: Connect to the Data Source and Generate a Log File
- Download and install the CData PostgreSQL ODBC Driver (or your respective CData driver) for your operating system. Make sure you are installing and using v24.2 or higher.
- Run the installer and follow the on-screen setup instructions.
-
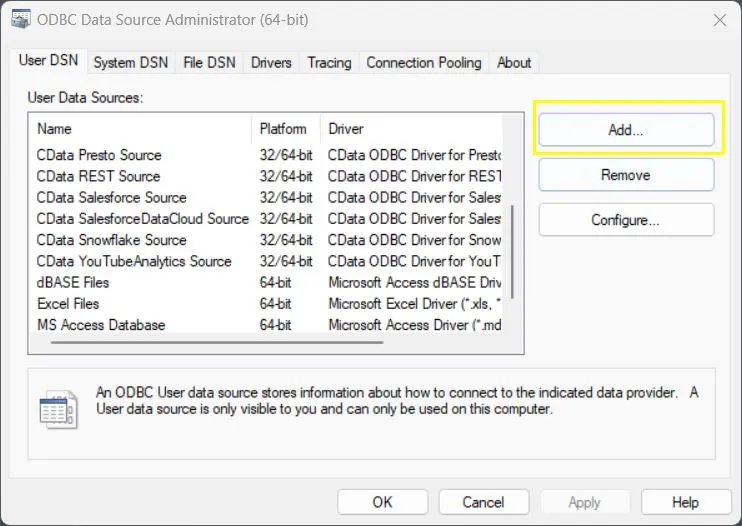
Once installed, open the ODBC Data Source Administrator to configure a new DSN:
- Windows: Search for ODBC Data Sources (64-bit) in the Start menu and open it.
- macOS: Open Applications > Utilities > ODBC Manager.
- Linux: Use unixODBC and edit your odbc.ini file.
-
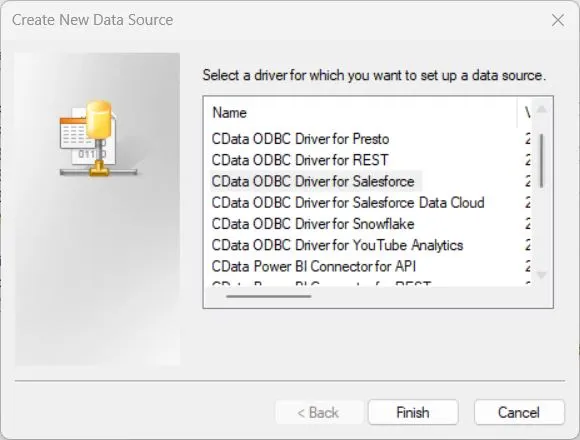
Click Add and select CData ODBC Driver for Salesforce (or your data source driver).
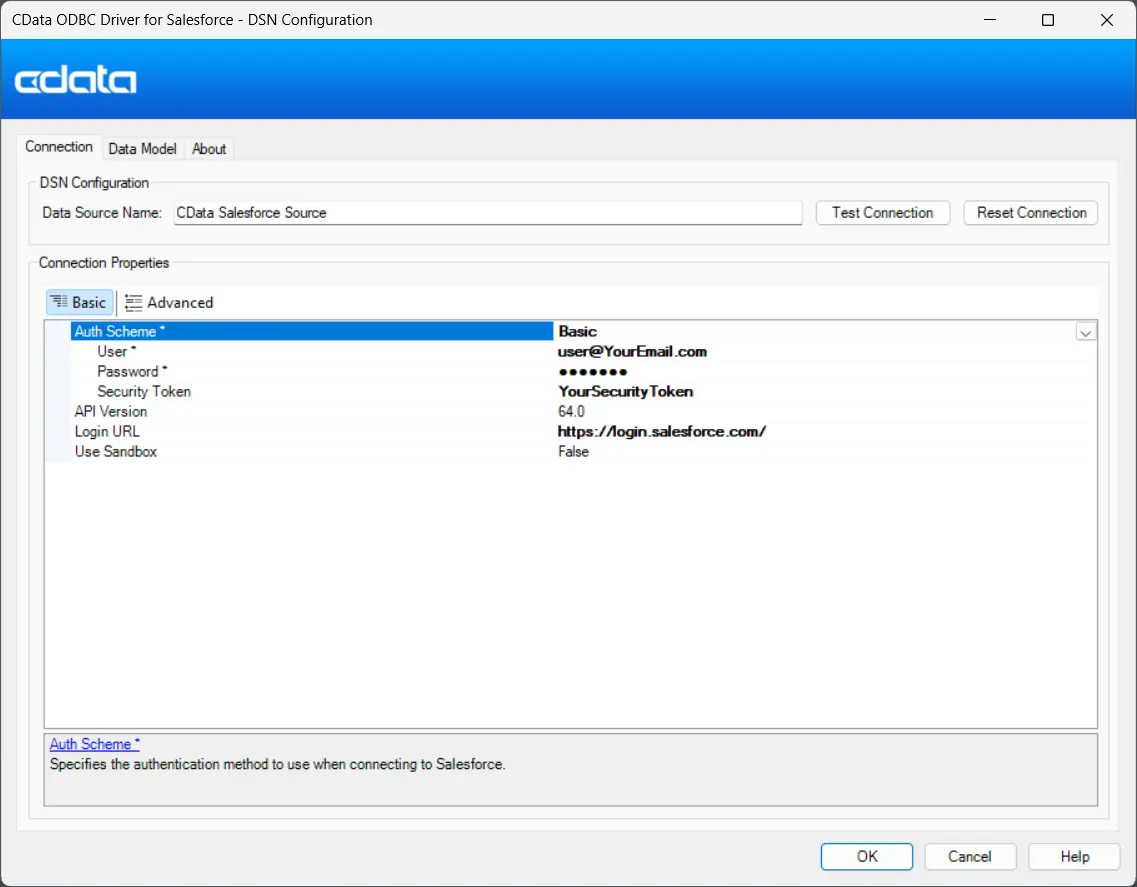
- Fill out the authentication details based on your Auth Scheme (Basic, OAuth, Okta, etc.).
-
For example, under the Basic Auth Scheme, provide:
- User: Your data source username.
- Password: Your data source password.
- Security Token: Your data source security token (if applicable).
-
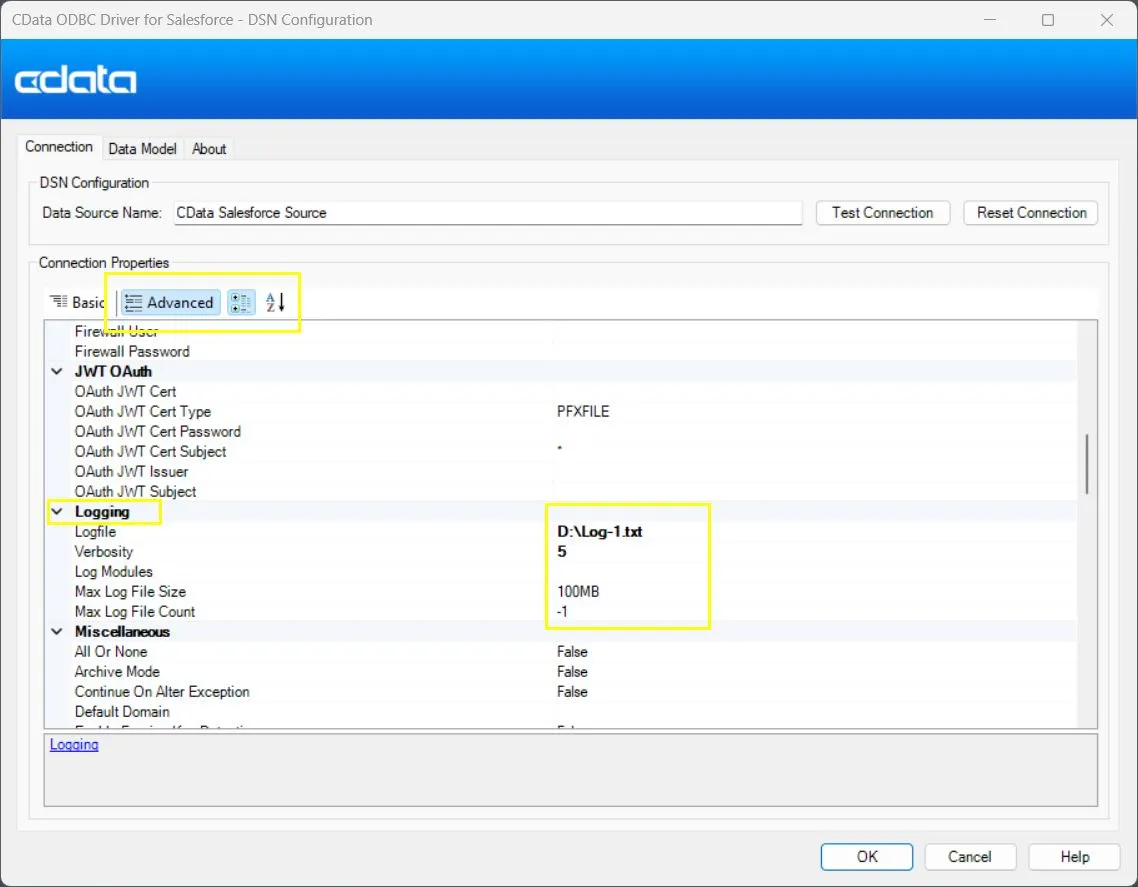
Switch to the Advanced tab and scroll down to the Logging section.
Configure the following:
- Logfile: The location of your log file. Specify or create a text file (e.g., C:\Logs\Log-1.txt).
- Verbosity: Controls how much detail is written to the log. Levels range from 1 (basic) to 5 (most detailed). For ThreadID analysis, use level 5 to include connection, HTTP, and thread-level details.
- Leave all other options at their default values.
- Click Test Connection to save your DSN configuration. The driver will now generate a detailed log file whenever a connection is made or a query is executed, capturing any errors or connection details for troubleshooting.
Step 2: Review and Analyze the Log File
Open the generated log file in a text editor such as Notepad++ or VS Code. Look for entries in the format:
In the following example, the error is an authentication error:
2025-09-01T06:08:57.998+05:30 2 [ 2| Q-Id| 13] [INFO|Connec] Connection Property: ReportExactPicklistLength = False
To read the ThreadID in this example:
- 2 → Connection ID
- Q-Id → Query or Context Identifier
- 13 → ThreadID (the thread handling this operation)
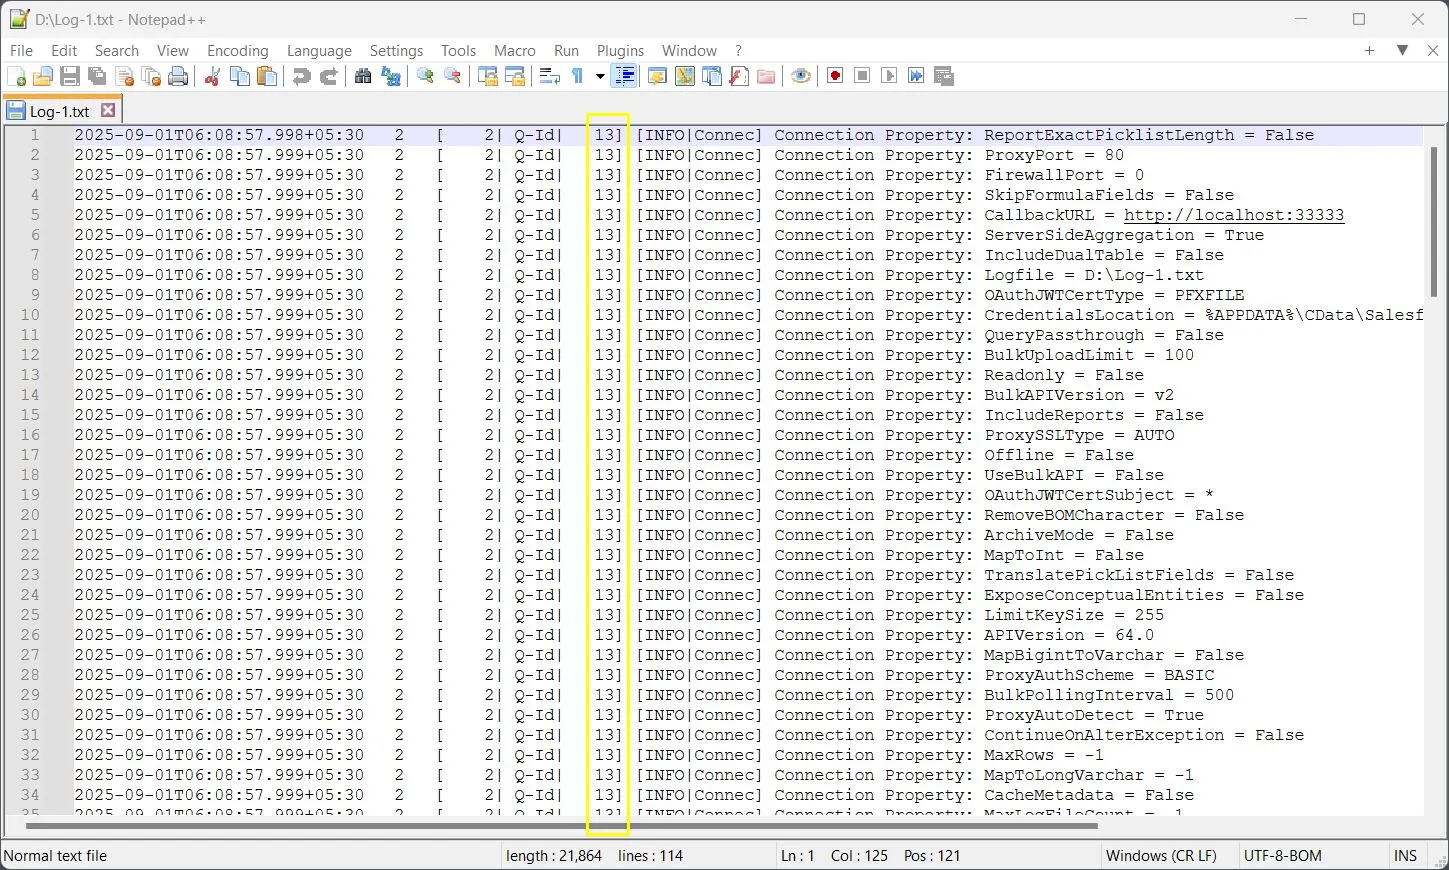
Use these identifiers to trace which thread produced each log line and to correlate concurrent operations within multi-threaded workloads. This approach helps you isolate performance bottlenecks, identify thread-specific errors, and validate concurrent driver behavior.
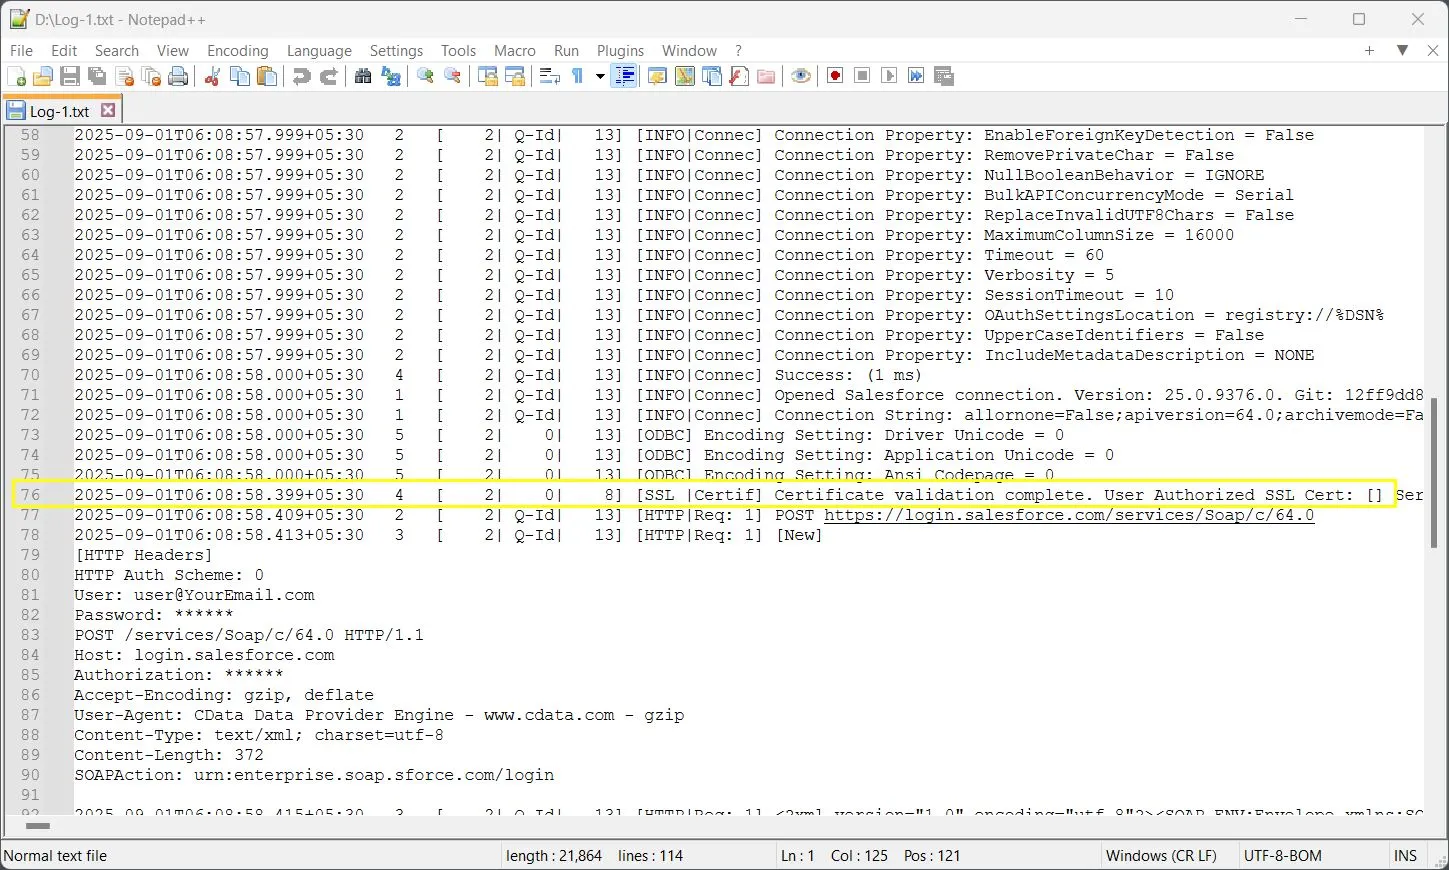
2025-09-01T06:08:58.399+05:30 4 [ 2| 0| 8] [SSL |Certif] Certificate validation complete. User Authorized SSL Cert: [] Server Cert:
This indicates a new thread started processing the SSL validation operation, which you can confirm by comparing subsequent log lines that share the same ThreadID (8). Each unique ThreadID represents a separate execution path in the driver's concurrent operations.
Try CData Drivers for Free
Ready to explore powerful connectivity and diagnostics firsthand? Download a free trial of any CData Driver to experience seamless data access, real-time integration, and detailed logging capabilities like ThreadID tracing. Each driver provides enterprise-grade performance and visibility across more than 300+ data sources.
Start your free trial today at cdata.com/drivers and see how easily you can connect, analyze, and troubleshoot multi-threaded operations with precision and control.

