








Visualize Live AfterShip Data in Power BI (via CData Connect AI)

Power BI transforms your company's data into rich visuals for you to collect and organize so you can focus on what matters to you. When paired with CData Connect AI, you get access to AfterShip data for visualizations, dashboards, and more. This article shows how to use CData Connect to create a live connection to AfterShip, connect to AfterShip data from Power BI and then create reports on AfterShip data in Power BI.
Configure AfterShip Connectivity for Power BI
Connectivity to AfterShip from Power BI is made possible through CData Connect AI. To work with AfterShip data from Power BI, we start by creating and configuring a AfterShip connection.
- Log into Connect AI, click Sources, and then click Add Connection
- Select "AfterShip" from the Add Connection panel
-
Enter the necessary authentication properties to connect to AfterShip.
Start by setting the Profile connection property to the location of the AfterShip Profile on disk (e.g. C:\profiles\Aftership.apip). Next, set the ProfileSettings connection property to the connection string for AfterShip (see below).
AfterShip API Profile Settings
Obtain your API key from the AfterShip account management panel by navigating to My Account > Settings > API Keys.
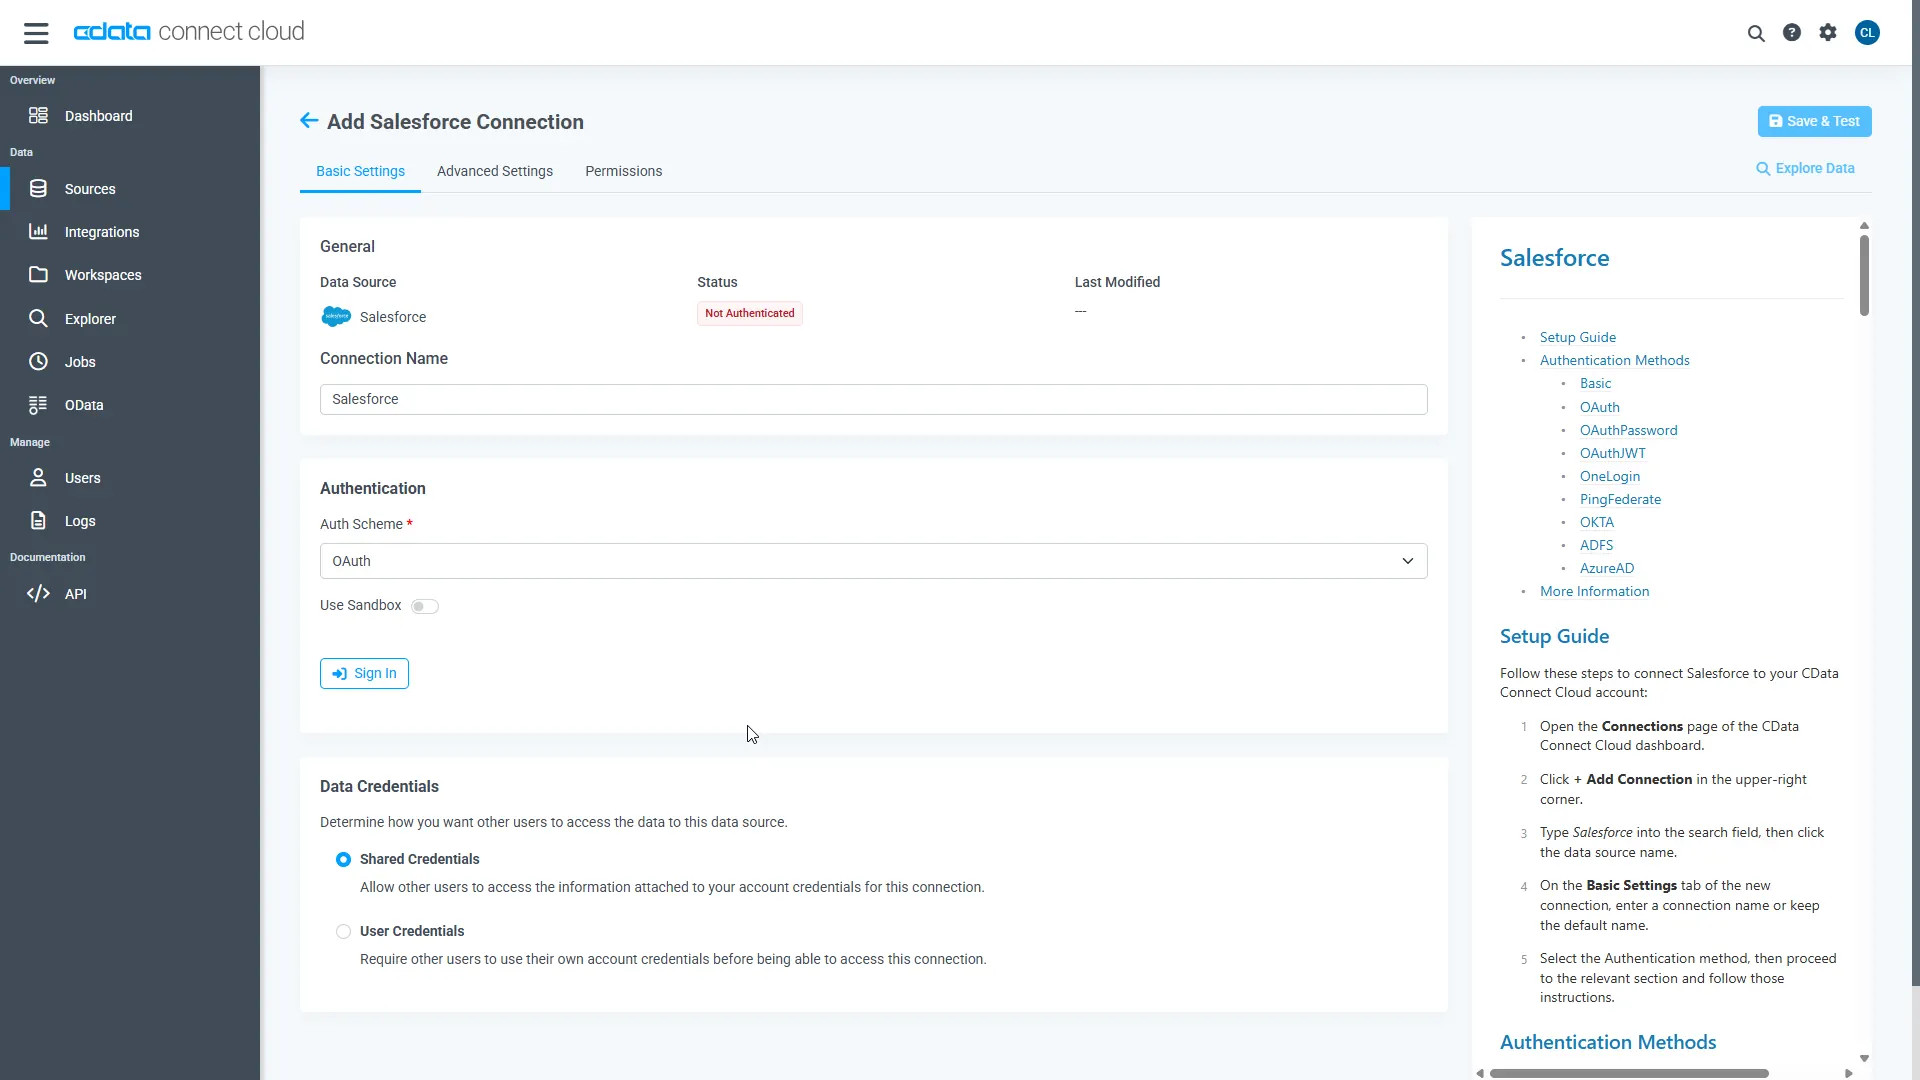
- Click Save & Test
-
Navigate to the Permissions tab in the Add AfterShip Connection page and update the User-based permissions.
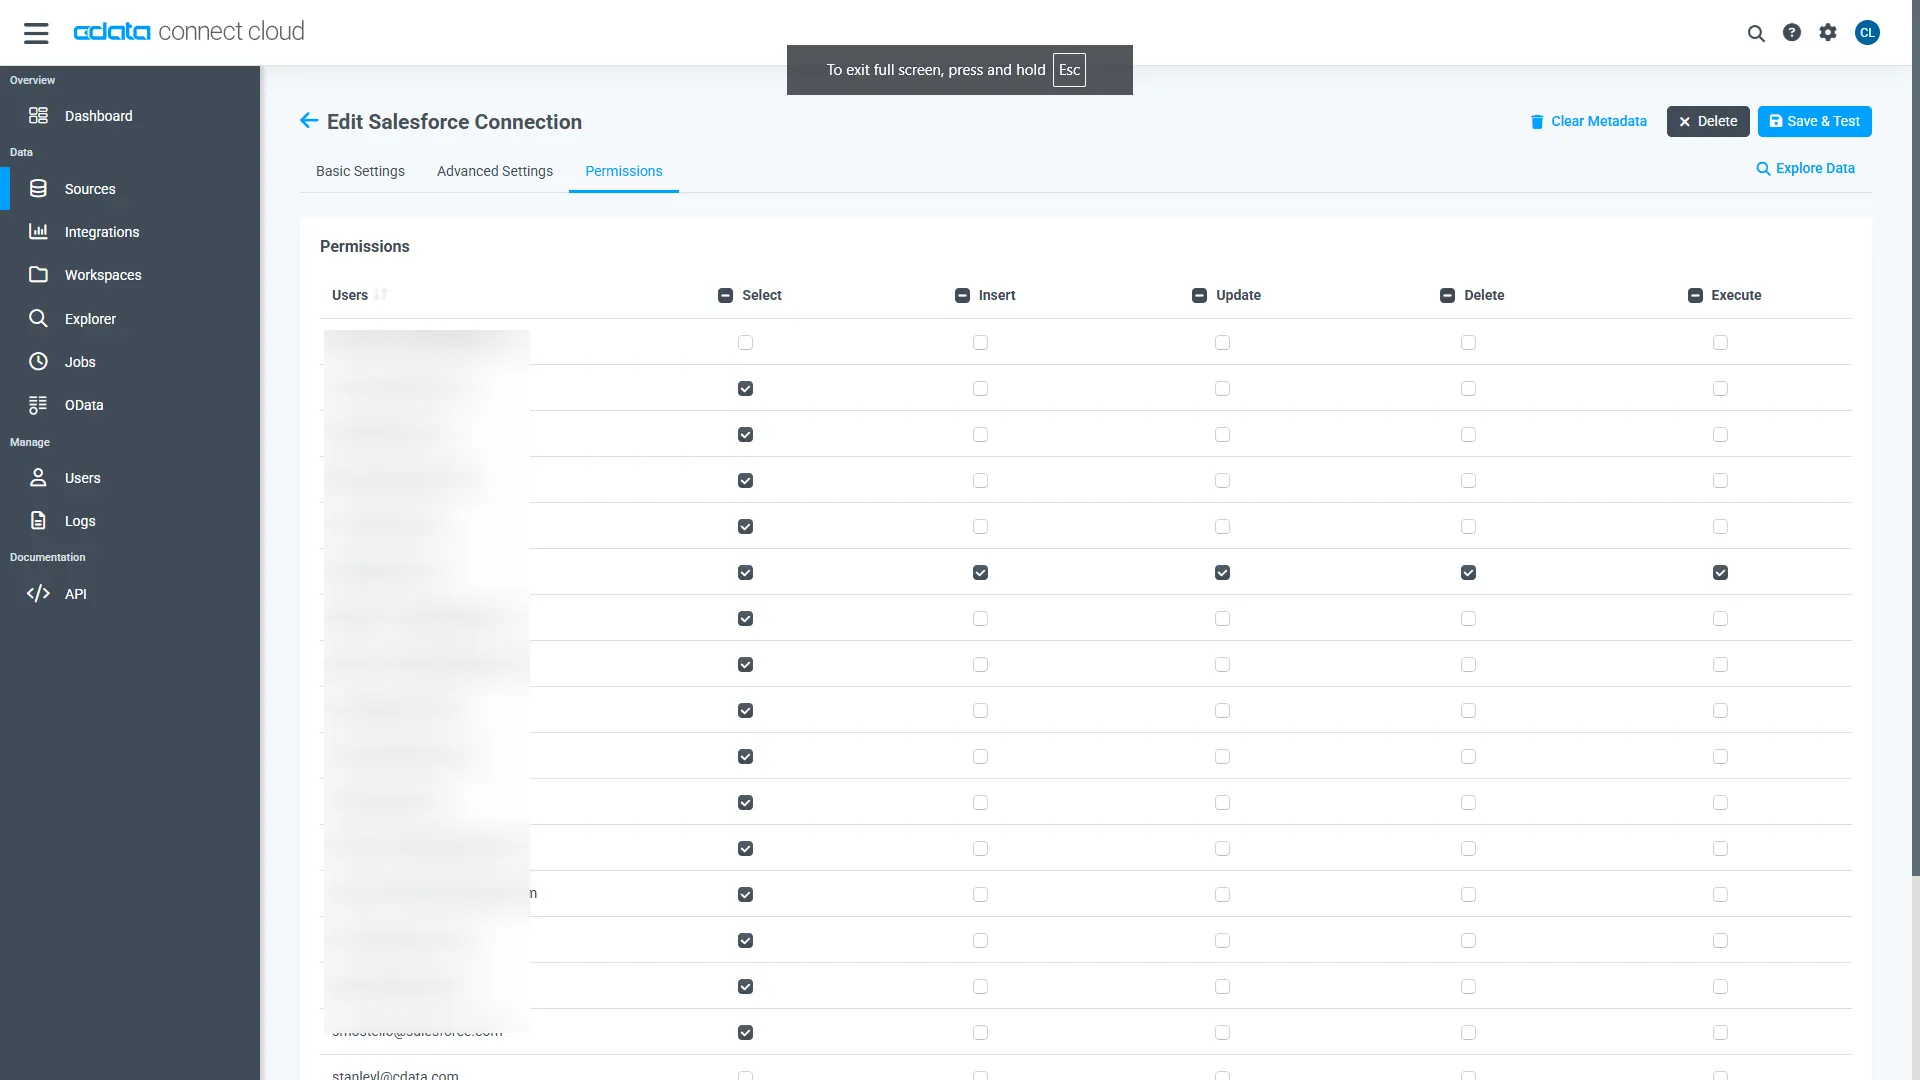
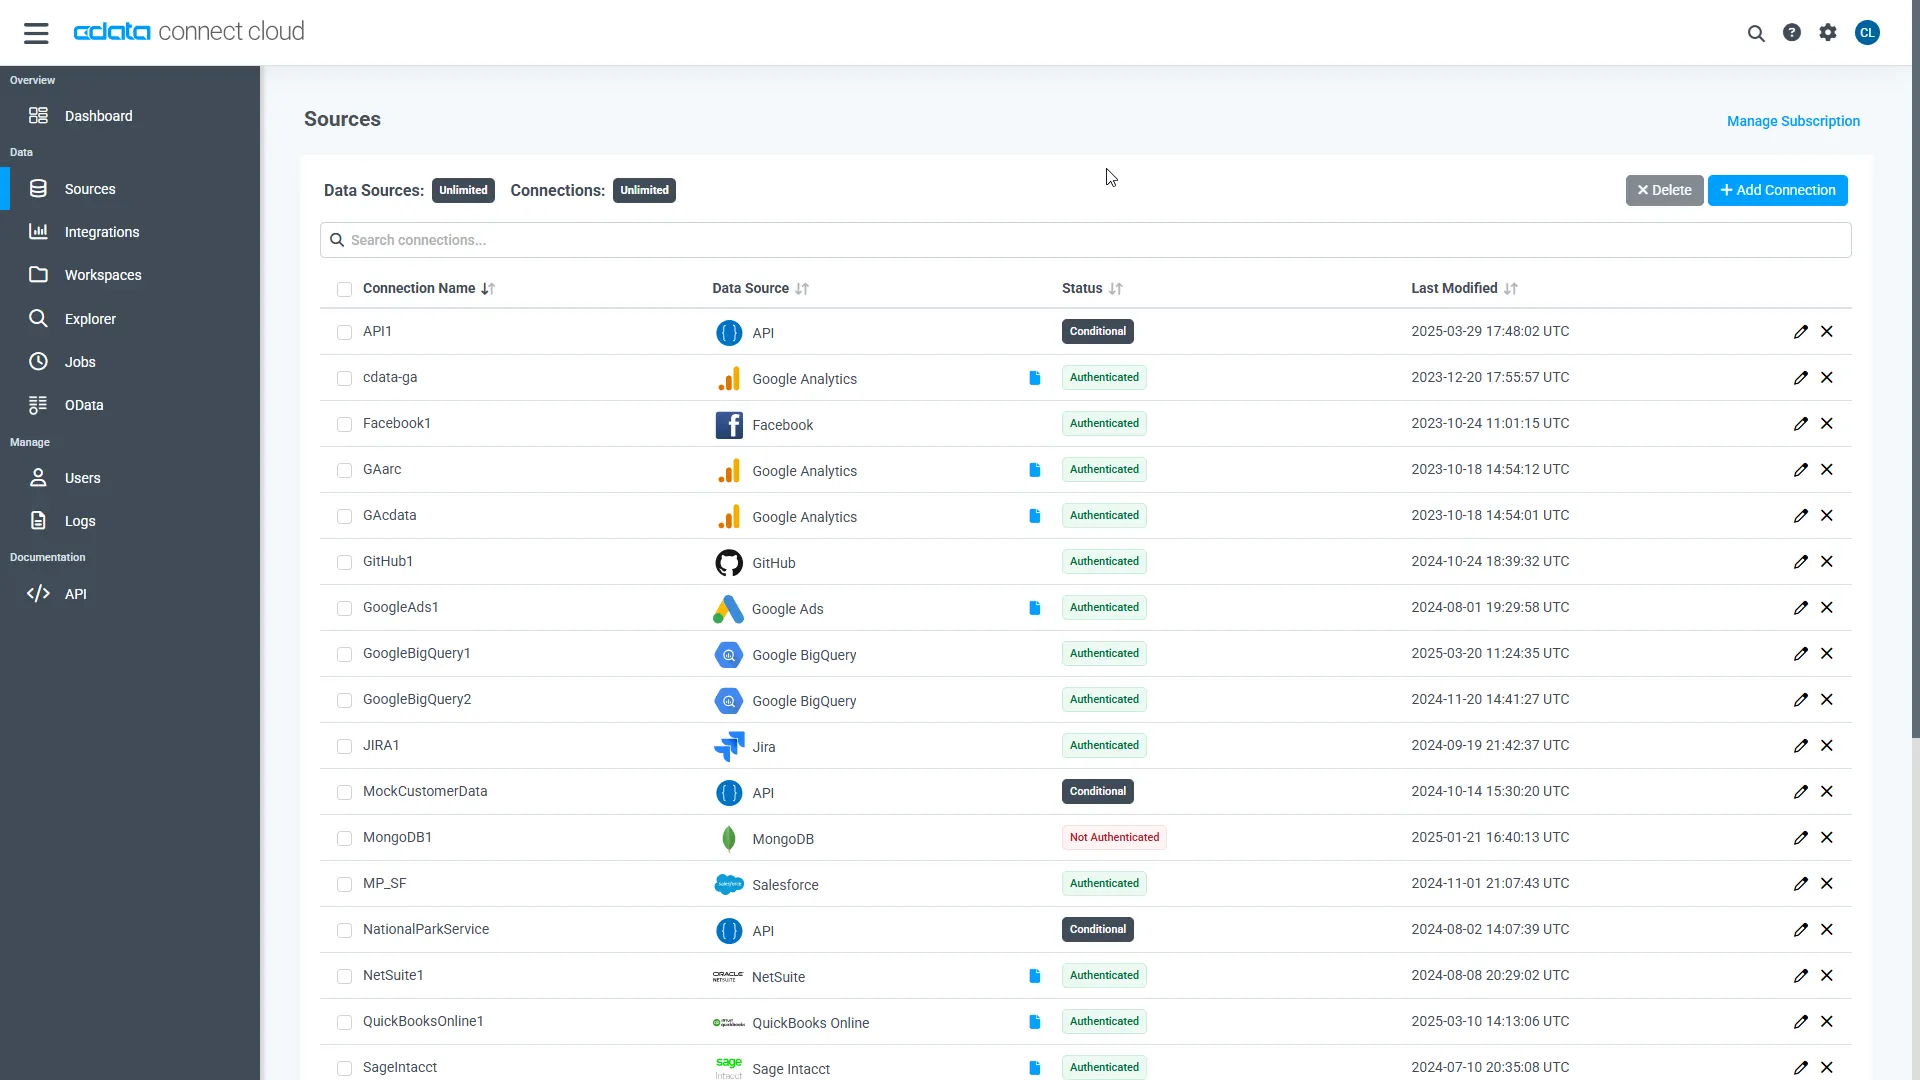
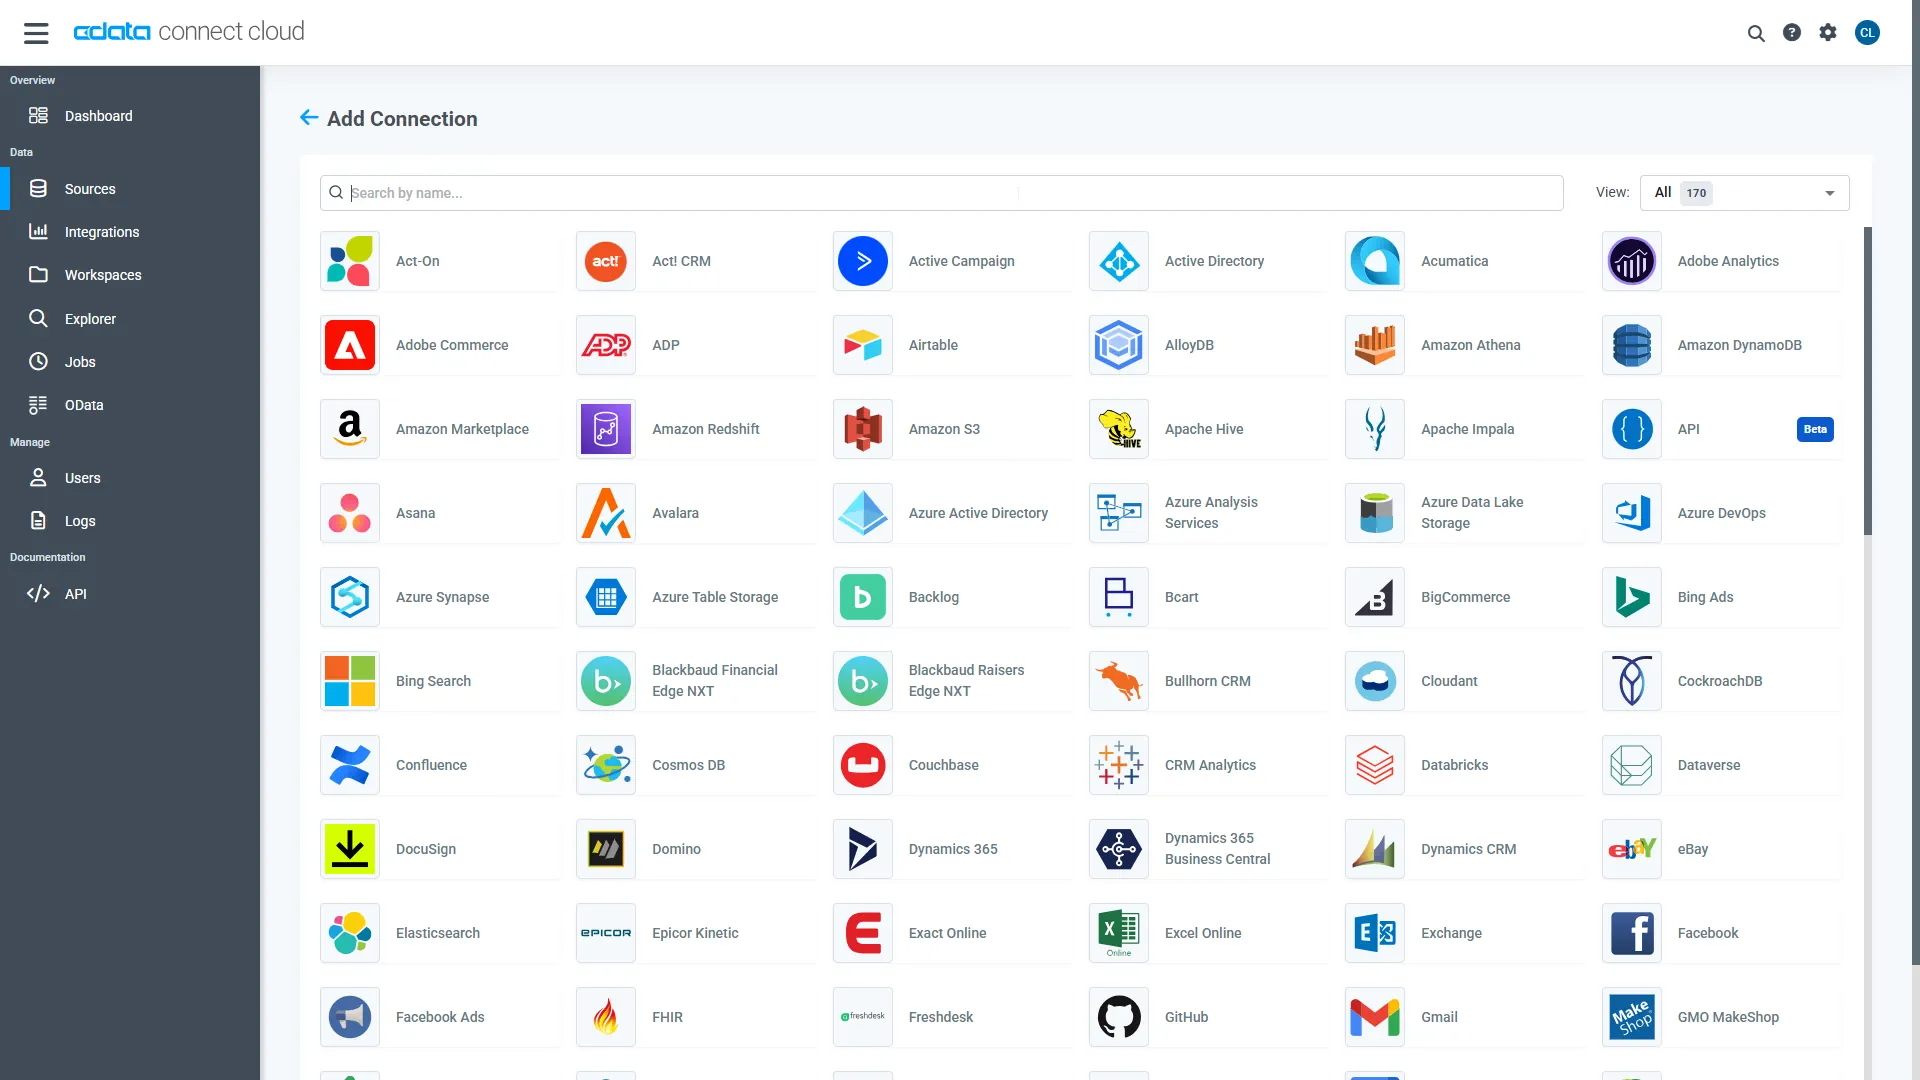
With the connection configured, you are ready to connect to AfterShip data from Power BI.
Query AfterShip Tables
Follow the steps below to build a query to pull AfterShip data into the report:
- Open Power BI Desktop and click Get Data -> Online Services -> CData Connect AI and click "Connect"
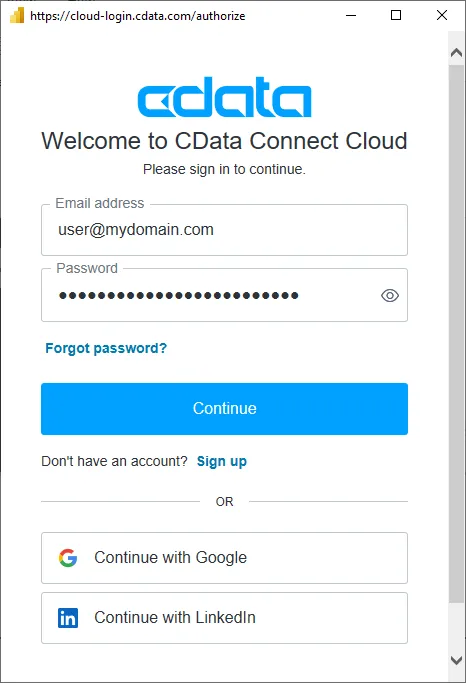
- Click "Sign in" and authenticate with your CData Connect AI account
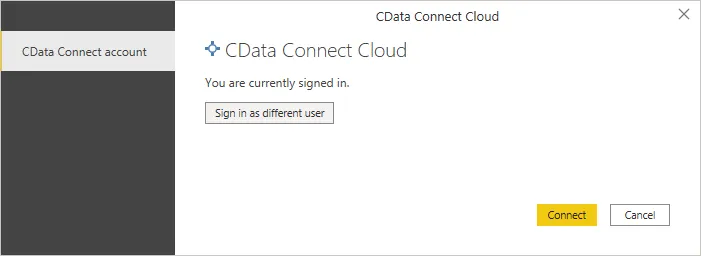
- After signing in, click "Connect"
- Select tables in the Navigator dialog
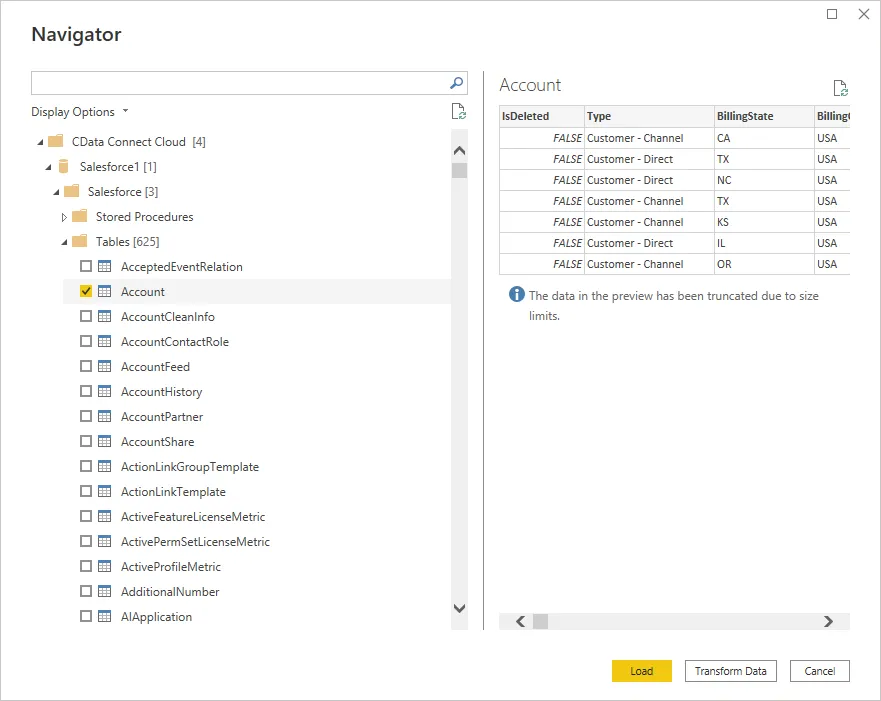
- Click Load to establish the connection to your AfterShip data from Power BI
Create AfterShip Data Visualizations
After connecting to the data into Power BI, you can create data visualizations in the Report view by dragging fields from the Fields pane onto the canvas. Select the dimensions and measures you wish to visualize along with the chart type.
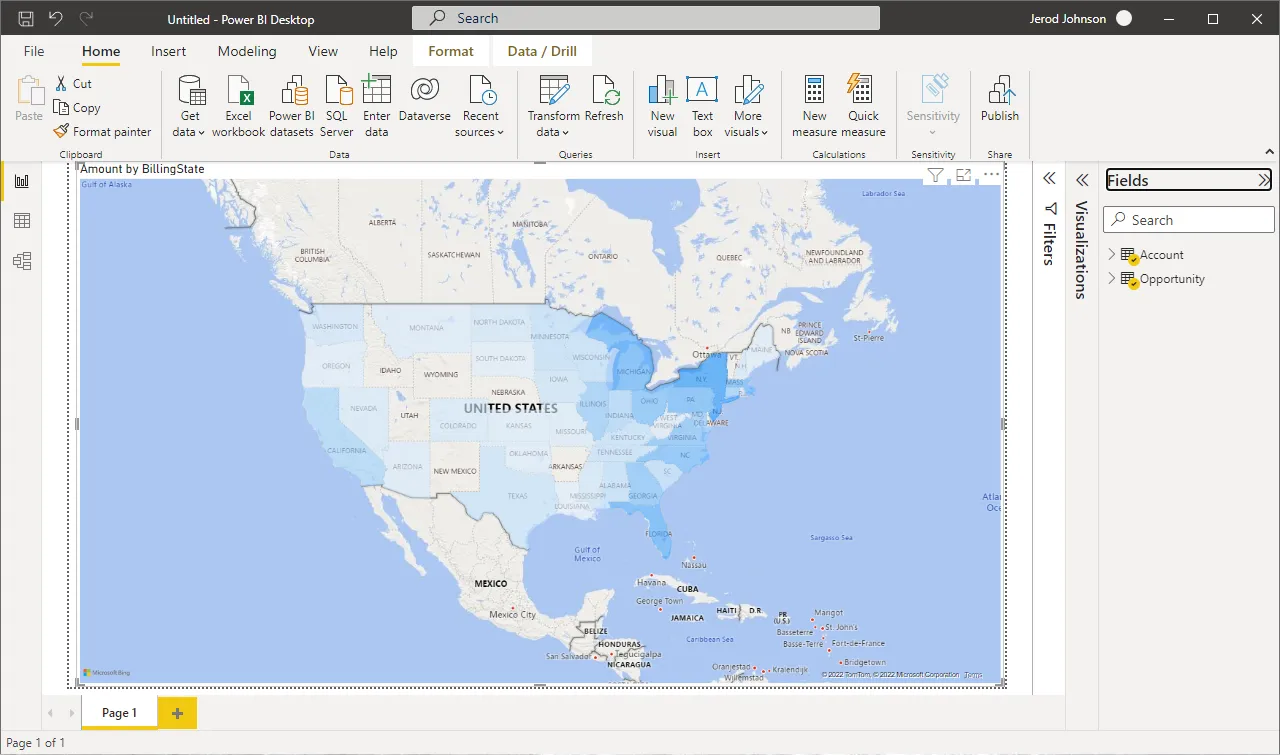
Click Refresh to synchronize your report with any changes to the data.
Live Access to AfterShip Data from Data Applications
With CData Connect AI you have a direct connection to AfterShip data from Power BI. You can import more data, create new visualizations, build reports, and more — all without replicating AfterShip data.
To get SQL data access to hundreds of SaaS, Big Data, and NoSQL sources (including AfterShip) directly from your on-premise BI, reporting, ETL and other data applications, visit the CData Connect AI page and start a free trial.