




Build Dashboards with Alchemy Data in DBxtra

The CData ODBC driver for Alchemy enables access to live data from Alchemy under the ODBC standard, allowing you work with Alchemy data in a wide variety of BI, reporting, and ETL tools and directly, using familiar SQL queries. This article shows how to connect to Alchemy data as a generic ODBC Data Provider and create charts, reports, and dashboards based on Alchemy data in DBxtra.
Connect to Alchemy Data
- If you have not already done so, provide values for the required connection properties in the data source name (DSN). You can configure the DSN using the built-in Microsoft ODBC Data Source Administrator. This is also the last step of the driver installation. See the "Getting Started" chapter in the Help documentation for a guide to using the Microsoft ODBC Data Source Administrator to create and configure a DSN.
Start by setting the Profile connection property to the location of the Alchemy Profile on disk (e.g. C:\profiles\Alchemy.apip). Next, set the ProfileSettings connection property to the connection string for Alchemy (see below).
Alchemy API Profile Settings
Alchemy uses API key authentication. The API key is supplied in the request URL path. To obtain an API key:
- Sign in to your Alchemy account at https://dashboard.alchemy.com.
- Open an existing app or create a new one.
- Copy the app's API key from the API Key dialog.
After obtaining your API key, set the following connection properties:
- AuthScheme: Set this to APIKey.
- Network: Optional. The blockchain network slug for NFT API requests (for example, eth-mainnet, base-mainnet, polygon-mainnet). Defaults to eth-mainnet.
Set the following in the ProfileSettings connection property:
- APIKey: Set this to your Alchemy app API key.
When you configure the DSN, you may also want to set the Max Rows connection property. This will limit the number of rows returned, which is especially helpful for improving performance when designing reports and visualizations.
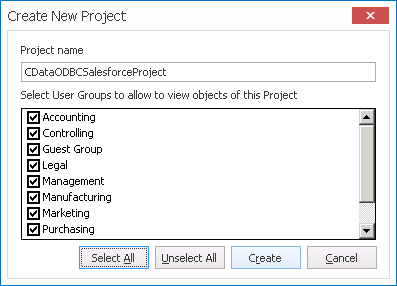
- Open the DBxtra application and in the New menu click Project and name the Project.
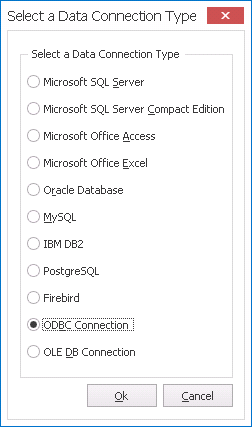
- Select ODBC Connection as the Data Connection Type.
- Click the browse option () for the Data Source.
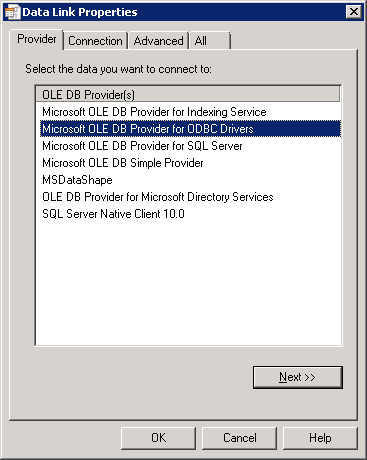
- In the Data Link Properties window, select Microsoft OLE DB Provider for ODBC Drivers on the Provider tab.
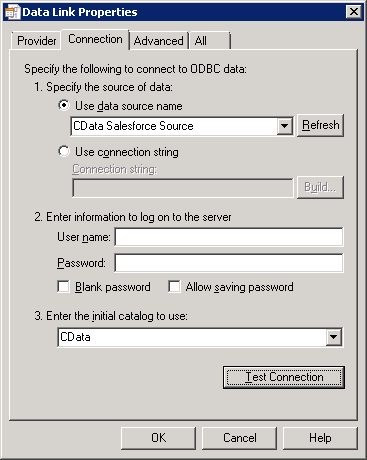
- On the Connection tab, select the Data Source Name and the initial catalog to use (CData).
- Name the Connection and select the appropriate User Groups.
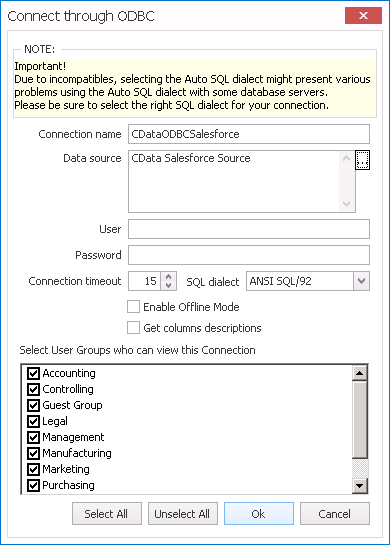
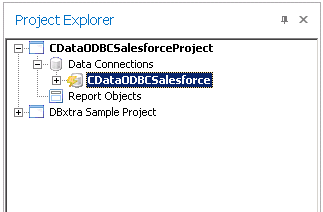
- Double-click the Connection from within the Project to connect to the data.
Create a Dashboard with Alchemy Data
You are now ready to create a dashboard with Alchemy data.
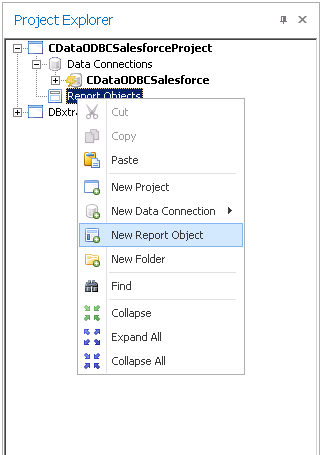
- Right-click Report Objects under the Project and select New Report Object.
- In the new Report Object, click the link to create the Query.
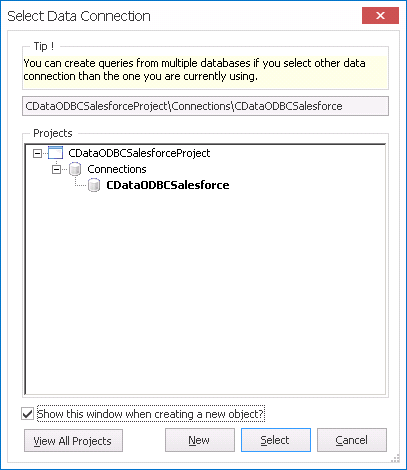
- In the Select Data Connection window, select the newly created data connection.
- On the Query tab, expand the connection objects and select the Tables, Views, and specific columns you wish to include in your dashboard. You can specify search requirements and even create complex queries which include JOINs and aggregations.
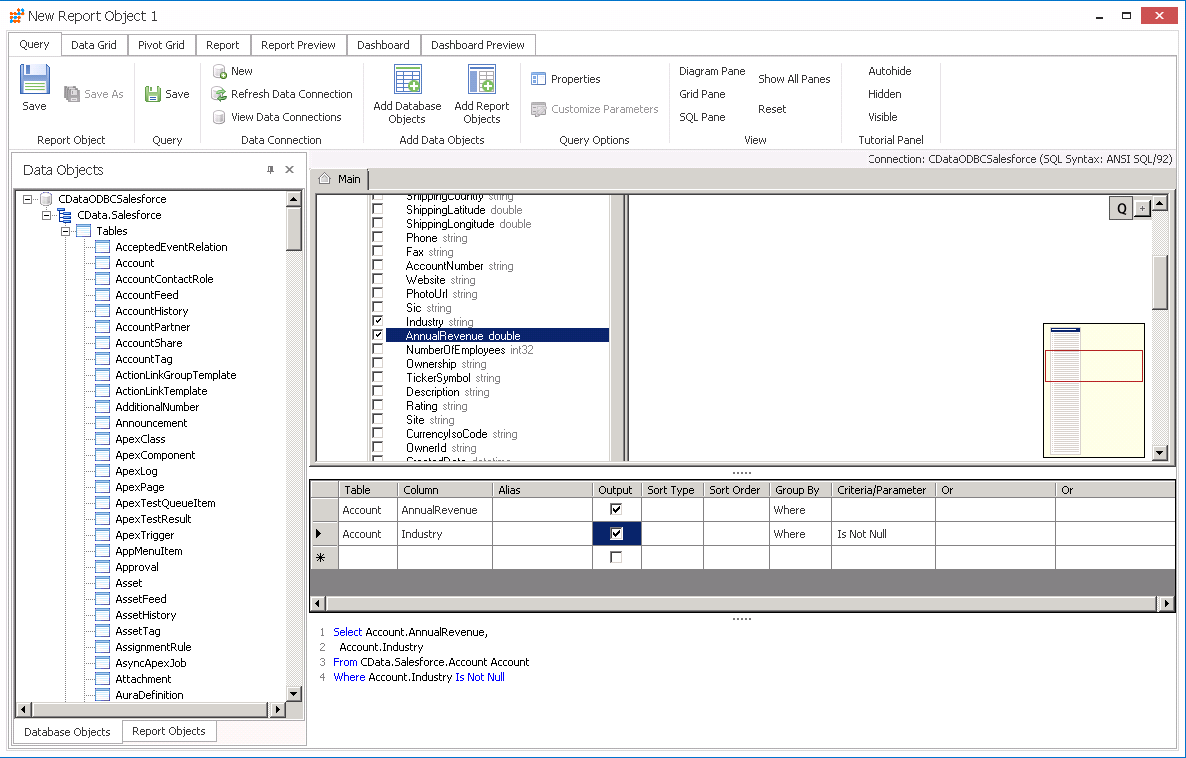
- On the Dashboard tab, select the visualizations and features for your dashboard. Assign the data values from the query to the appropriate fields for the Dashboards items (Values, Series, etc.)
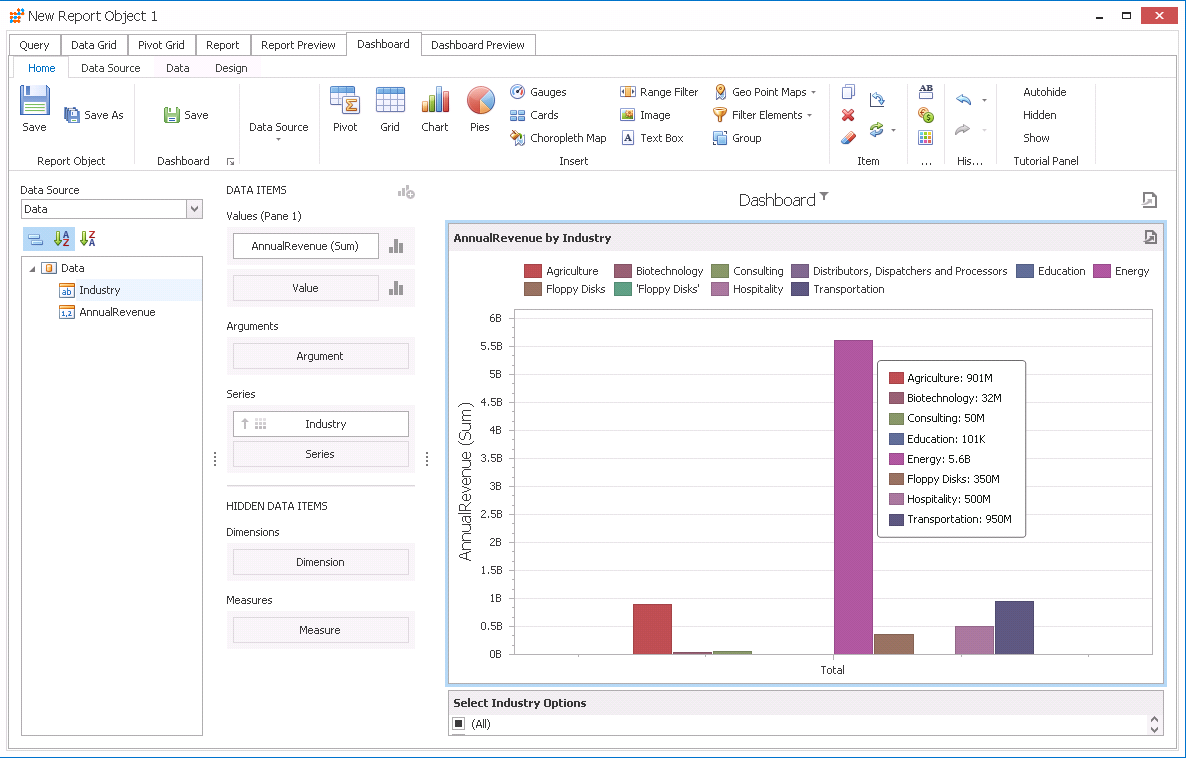
With a new Dashboard created, you are ready to begin analysis of Alchemy data. Thanks to the ODBC Driver for Alchemy, you can refresh the Dashboard and immediately see any changes made at the source. In the same way, you can create and view Reports with live, up-to-date Alchemy data.