




Build Charts with Claude Compliance Data in Clear Analytics

The CData ODBC driver for Claude Compliance enables access to live data from Claude Compliance under the ODBC standard, allowing you work with Claude Compliance data in a wide variety of BI, reporting, and ETL tools and directly, using familiar SQL queries. This article shows how to use Clear Analytics, a Microsoft Excel Add-In, to connect to Claude Compliance as an ODBC source and create queries, tables, and charts (including PivotTables) based on Claude Compliance data.
Connect to Claude Compliance Data
Configure the ODBC Data Source Name
If you have not already done so, provide values for the required connection properties in the data source name (DSN). You can use the built-in Microsoft ODBC Data Source Administrator to configure the DSN. This is also the last step of the driver installation. See the "Getting Started" chapter in the help documentation for a guide to using the Microsoft ODBC Data Source Administrator to create and configure a DSN.
The driver connects to Claude Compliance using a Compliance Access Key, the only supported authentication method. Set the following connection property:
- APIKey: The Compliance Access Key you created.
Creating a Compliance Access Key
- Enable the Compliance API for your organization.
- Sign in to claude.ai as a primary owner or organization owner and open Organization settings > API > Keys.
- Select Create Key and assign only the scopes your integration needs:
- read:compliance_activities for Activities and the typed activity views.
- read:compliance_org_data for organizations, roles, groups, and settings.
- read:compliance_user_data for users, chats, files, projects, and downloads.
- delete:compliance_user_data for the explicit Delete stored procedures.
- Create the key and copy it when it appears. The key starts with sk-ant-api01- and is shown only once.
Optionally, set OrganizationUUID to limit organization-scoped views (such as OrganizationUsers and ComplianceRoles) to a single linked organization. If it is left empty, those views default to the first available organization and do not include data from all linked organizations.
When you configure the DSN, you may also want to set the Max Rows connection property. This will limit the number of rows returned, which is especially helpful for improving performance when designing reports and visualizations.
Configure the Data Source in Clear Analytics
- Open Excel and navigate to the CLEAR ANALYTICS ribbon. Once there, open the Data Manager.
- Select Database as the data source.
- In the Set Connection section, click the option to create a new database.
- Select Microsoft ODBC Data Source as the data source and click OK.
- Select the DSN you already configured from the drop-down menu.
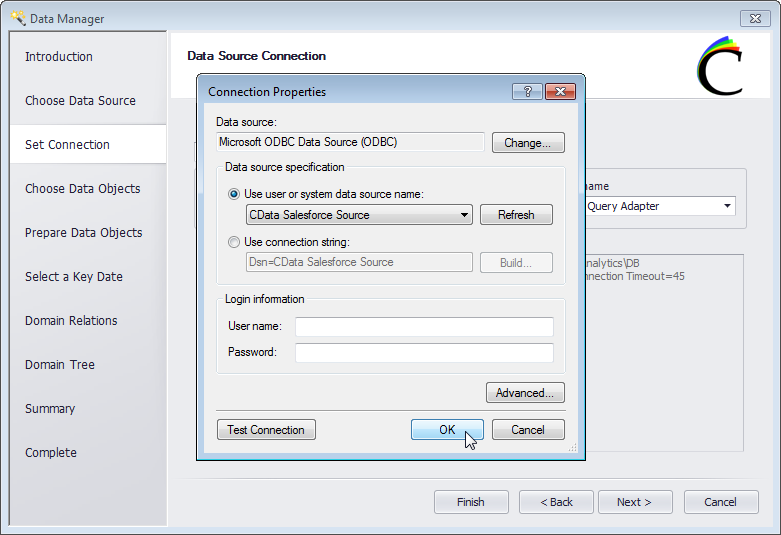
- Back on the Set Connection section, select Standard (ANSI ODBC) Query Builder as the SQL Builder Provider and click Next.
- Select the Schema/Owner and choose the domains (tables) that you wish to use in Clear Analytics.
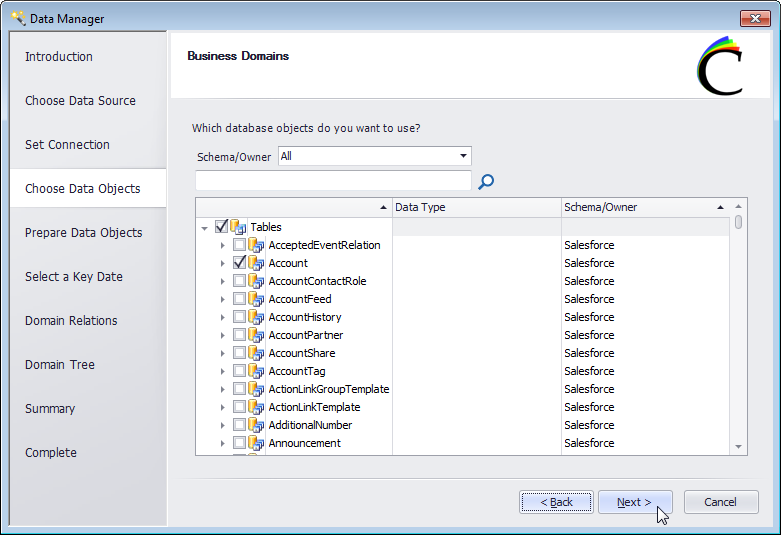
- Prepare your data objects as needed by customizing the display names and descriptions of the tables and columns.
- For the vast majority of the CData ODBC Drivers, you will not set a key date for your domains.
- In the Domain Relations section, add any relational information between tables.
- In the Domain Tree section, create groups for your data and add the available items to the groups.
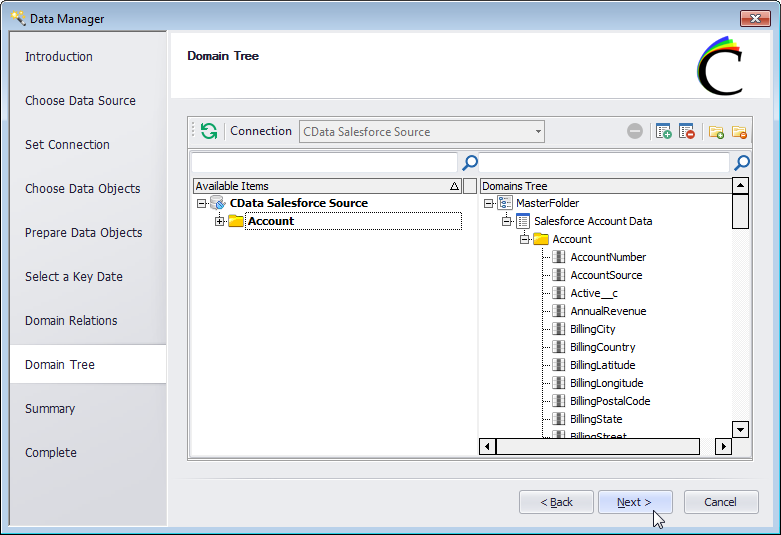
- Review the summary of your data and click Finish.
Create a Chart with Claude Compliance Data
You are now ready to create a chart with Claude Compliance data.
Create a New Query
- Click Repository in the CLEAR ANALYTICS ribbon.
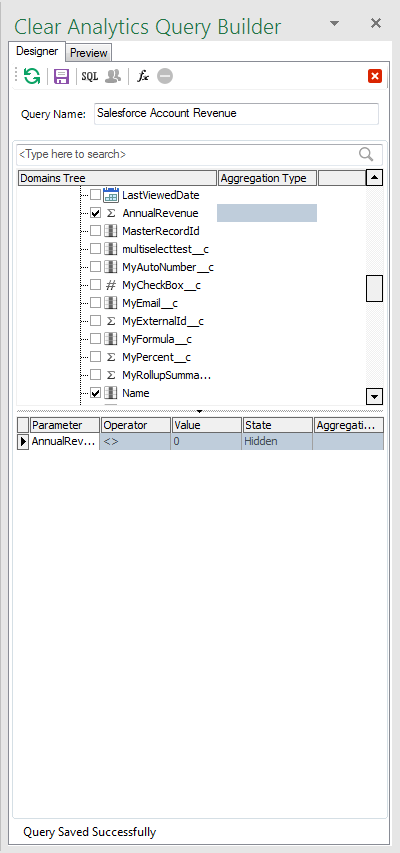
- Create a new query.
- Select the columns you wish to retrieve.
- Set the aggregation type for your data (use the blank entry if you do not wish to aggregate the data).
- Set filters and formulas by dragging columns to the lower window.
- Name your query and click Save.
Build a Chart Based on a Query Report
With the query created, you are now ready to execute a report and display a chart.- Click Report Explorer in the CLEAR ANALYTICS ribbon.
- In the Report Explorer pane, click the 'New Report' icon in the toolbar.
- Select the query you just created.
- Name the report and click 'Save and Execute'.
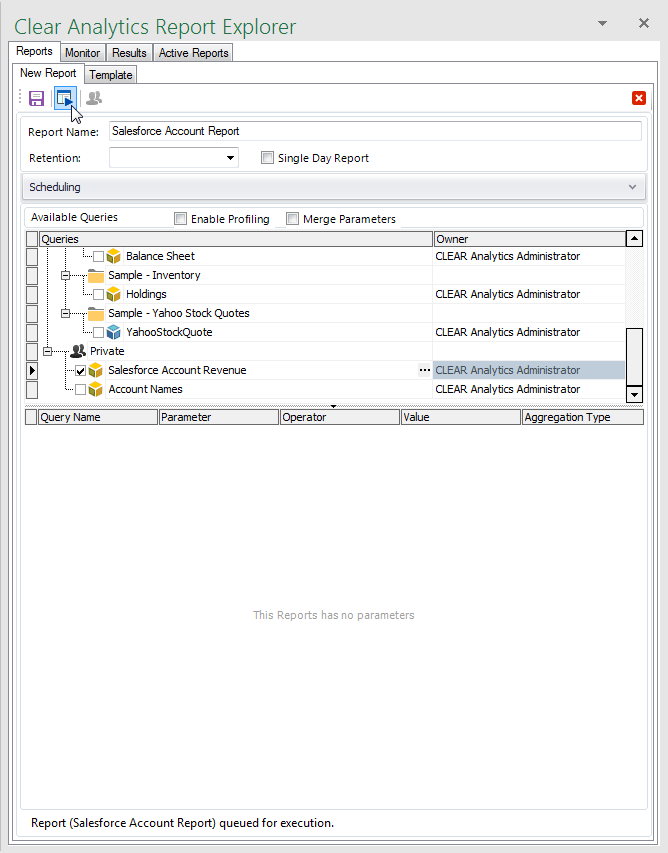
- Click the Results tab within the Report Explorer
- Expand your report and drag the chart to the Excel spreadsheet.
- In the resulting PivotChart window, drag the fields (columns) to the Filters, Legends, Axis (Categories), and Values windows.
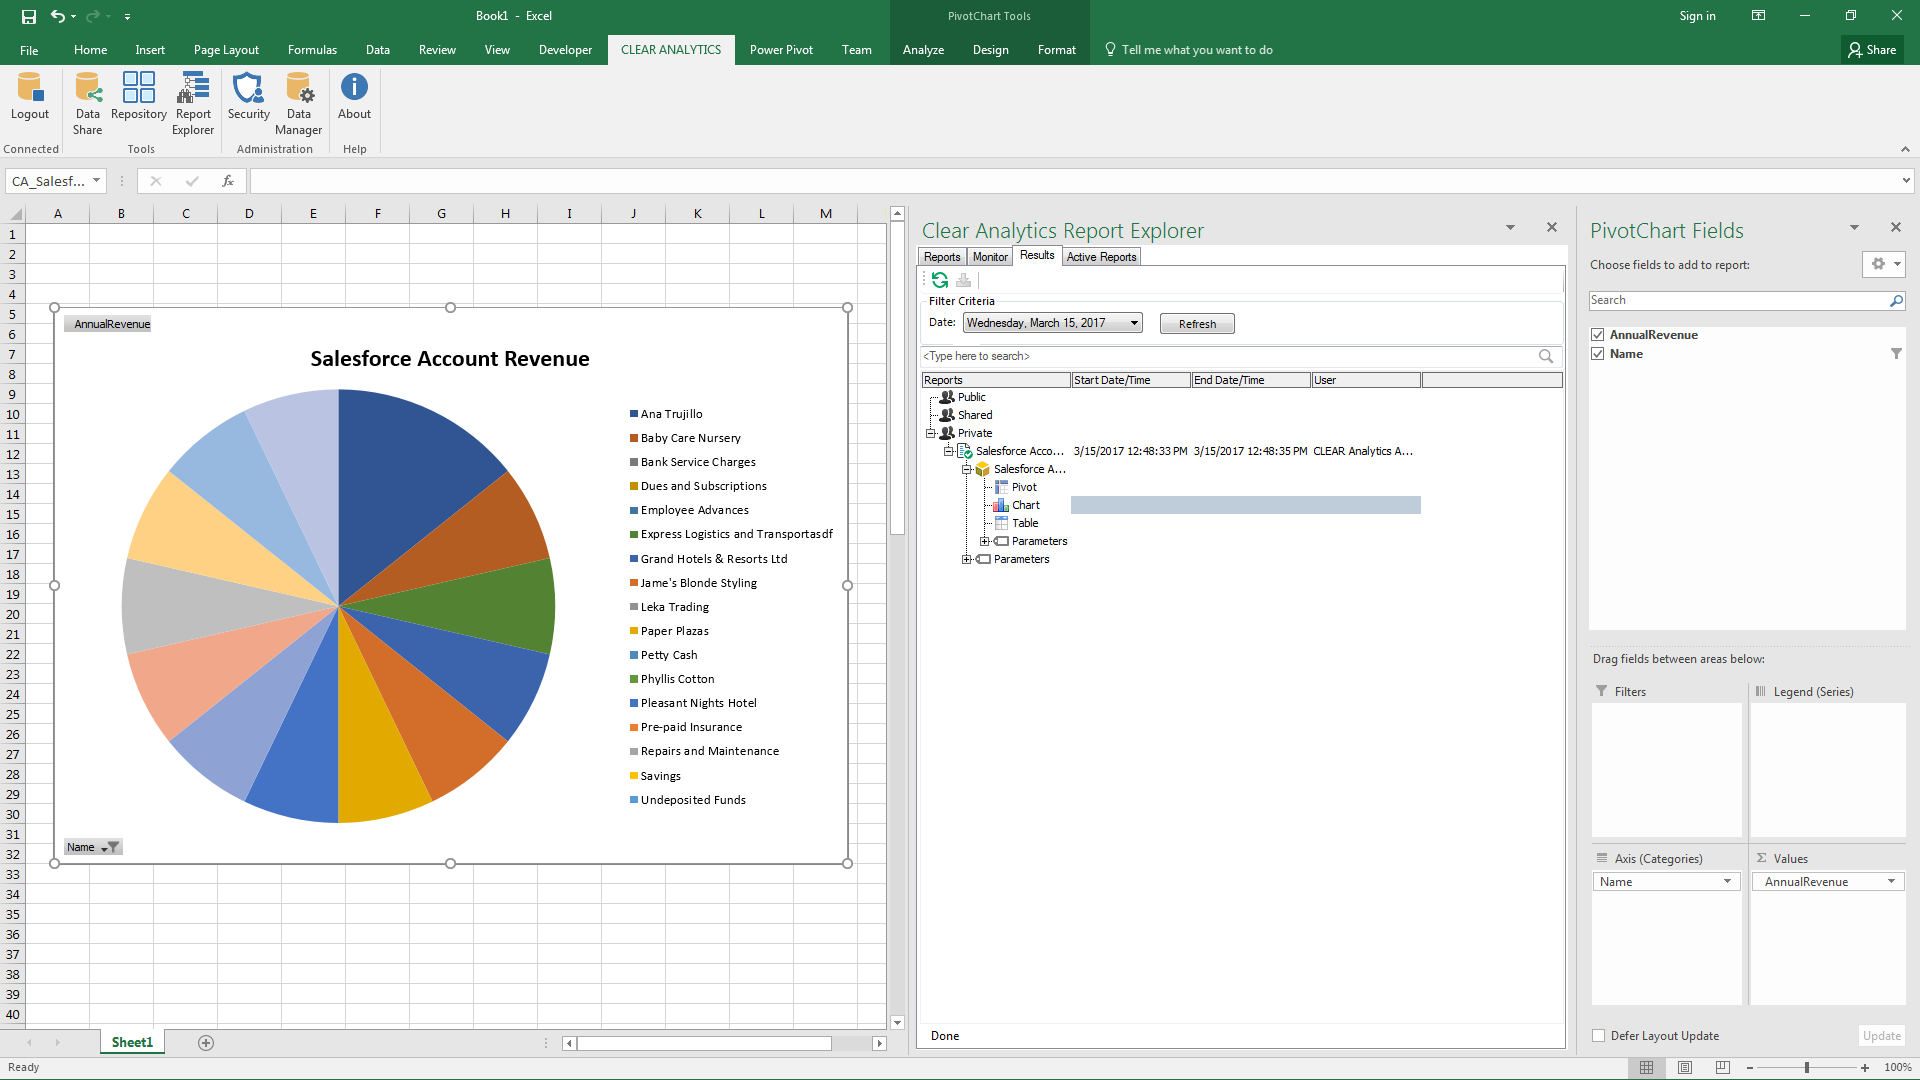
With a new data source in Clear Analytics established and a chart created, you are ready to begin analysis of Claude Compliance data. With the ODBC Driver for Claude Compliance and Clear Analytics, you can perform self-service analytics in Excel with live data, directly from Claude Compliance.
Ready to get started?
Download a free trial of the Claude Compliance ODBC Driver to get started:
Download NowLearn more:
 Claude Compliance ODBC Driver
The Claude Compliance ODBC Driver is a powerful tool that allows you to connect with live data from Claude Compliance, directly from any applications that support ODBC connectivity.
Access Claude Compliance data like you would a database - read Claude Compliance Activities, Chats, ChatMessages, CodeArtifacts, ComplianceRoles, Organizations, OrganizationUsers, Projects, etc. through a standard ODBC Driver interface.