








Build Grafana-Connected Visualizations in datapine

datapine is a browser-based business intelligence platform. When paired with the CData Connect AI, you get access to your Grafana data directly from your datapine visualizations and dashboards. This article describes connecting to Grafana in CData Connect AI and building a simple Grafana-connected visualization in datapine.
CData Connect AI provides a pure SQL Server interface for Grafana, allowing you to query data from Grafana without replicating the data to a natively supported database. Using optimized data processing out of the box, CData Connect AI pushes all supported SQL operations (filters, JOINs, etc.) directly to Grafana, leveraging server-side processing to return the requested Grafana data quickly.
Configure Grafana Connectivity for datapine
Connectivity to Grafana from datapine is made possible through CData Connect AI. To work with Grafana data from datapine, we start by creating and configuring a Grafana connection.
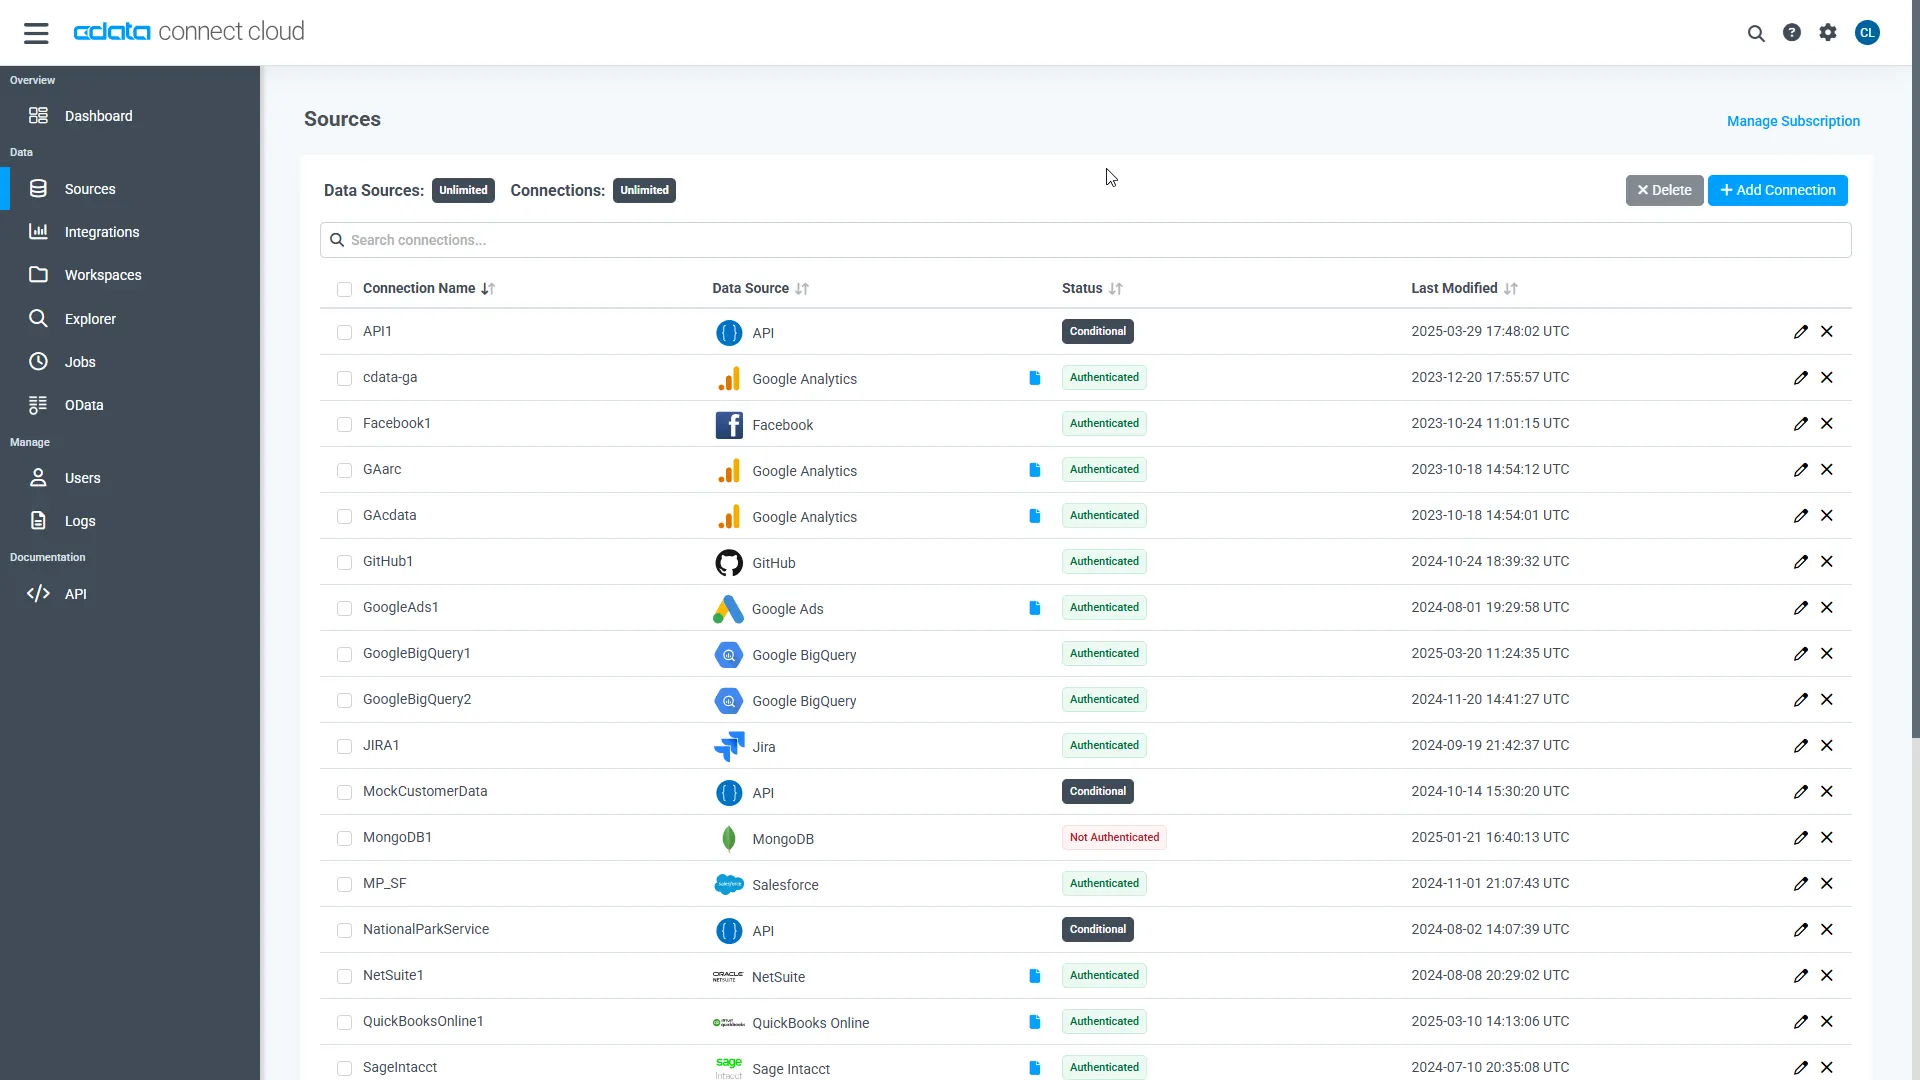
- Log into Connect AI, click Sources, and then click Add Connection
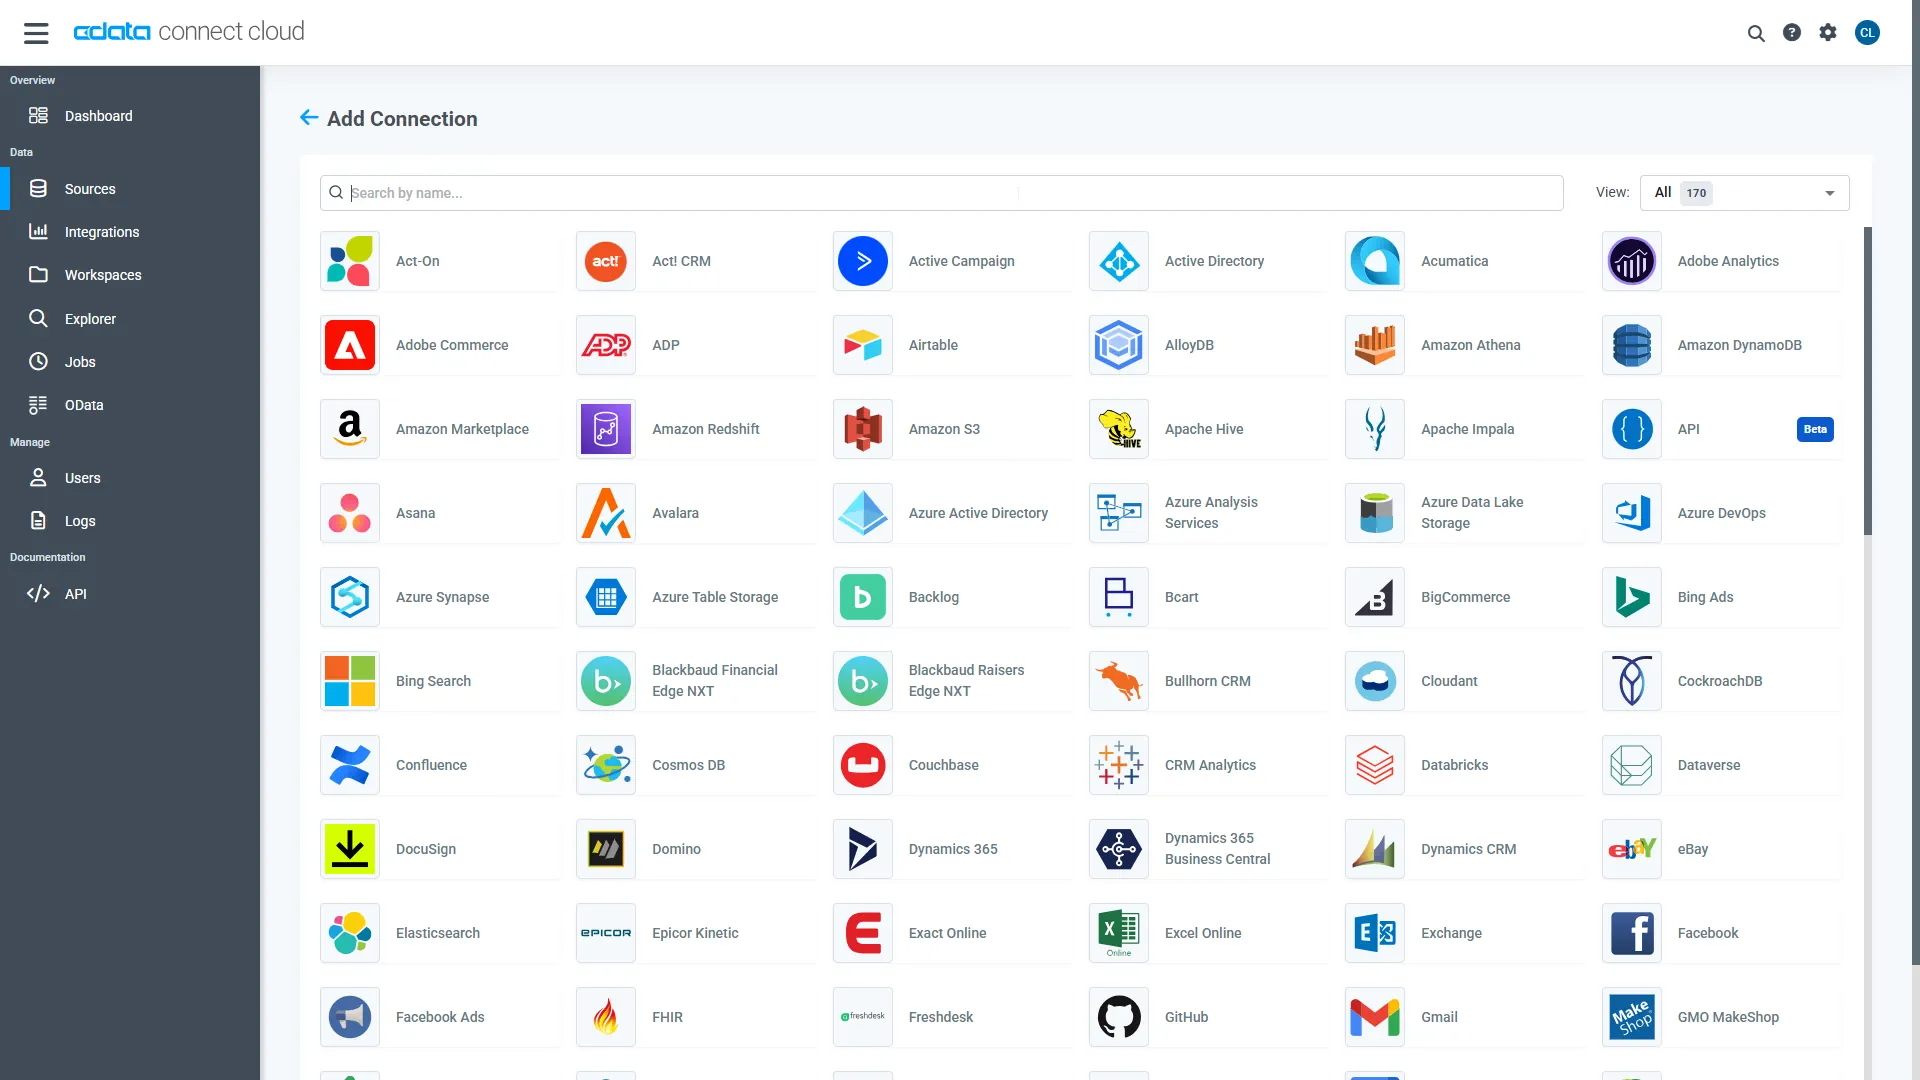
- Select "Grafana" from the Add Connection panel
-
Enter the necessary authentication properties to connect to Grafana.
Start by setting the Profile connection property to the location of the Grafana Profile on disk (e.g. C:\profiles\Grafana.apip). Next, set the ProfileSettings connection property to the connection string for Grafana (see below).
Grafana API Profile Settings
In Grafana, navigate to Administration > Users and Access > Service accounts, create a service account, then click Add service account token to generate a token.
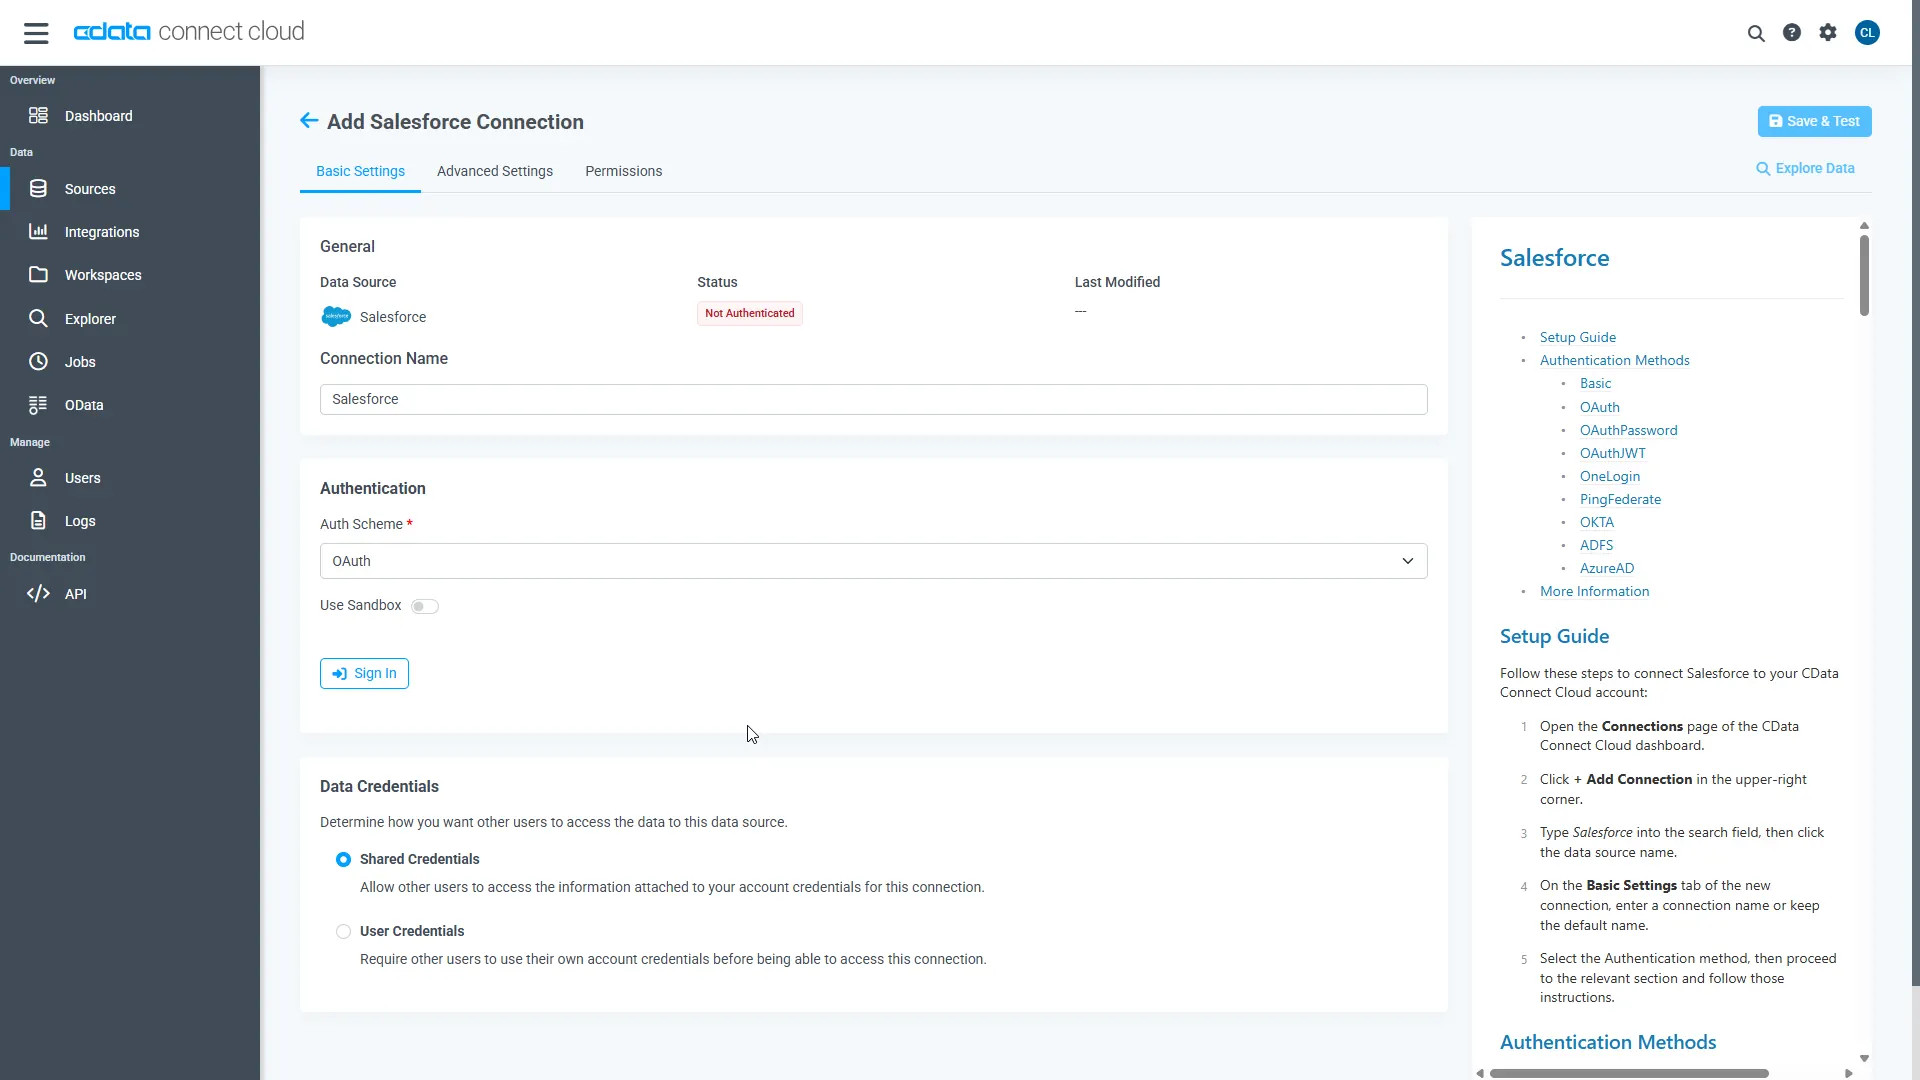
- Click Save & Test
-
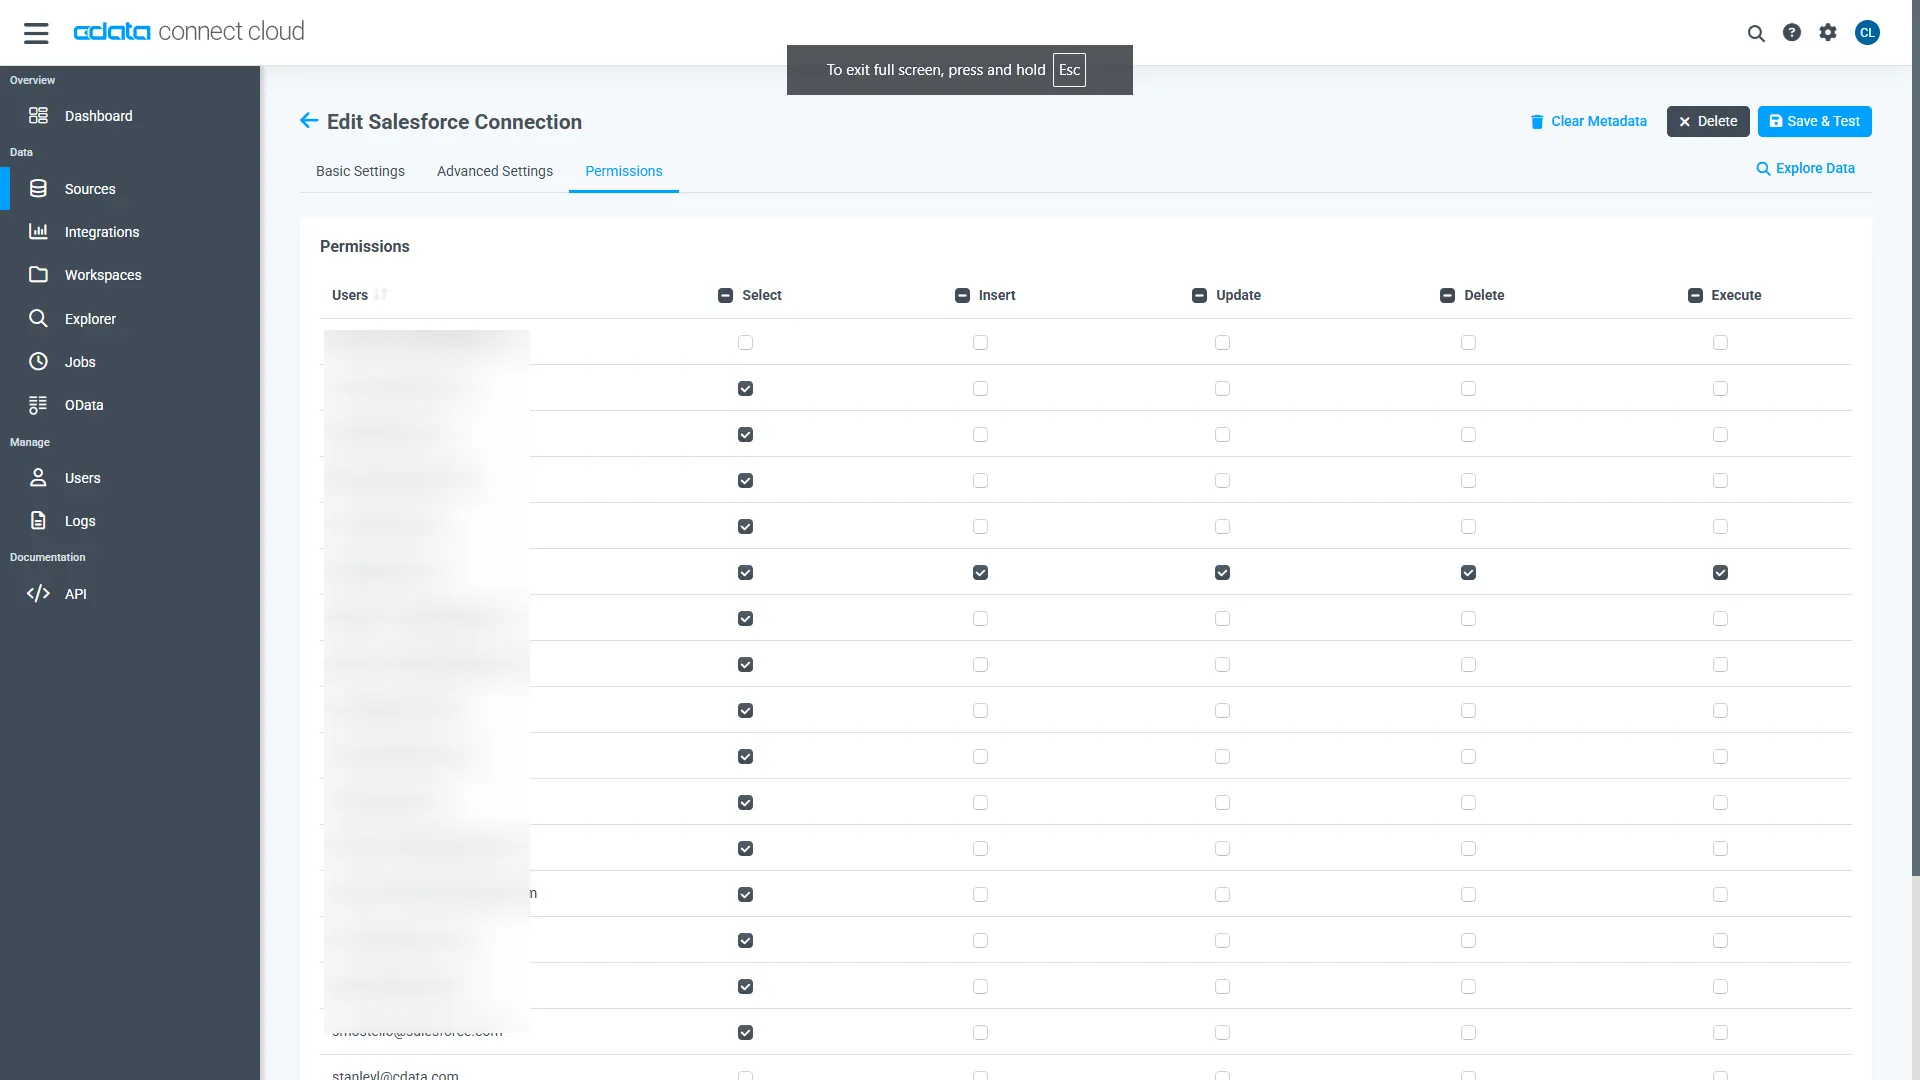
Navigate to the Permissions tab in the Add Grafana Connection page and update the User-based permissions.
Add a Personal Access Token
When connecting to Connect AI through the REST API, the OData API, or the Virtual SQL Server, a Personal Access Token (PAT) is used to authenticate the connection to Connect AI. It is best practice to create a separate PAT for each service to maintain granularity of access.
- Click on the Gear icon () at the top right of the Connect AI app to open the settings page.
- On the Settings page, go to the Access Tokens section and click Create PAT.
-
Give the PAT a name and click Create.
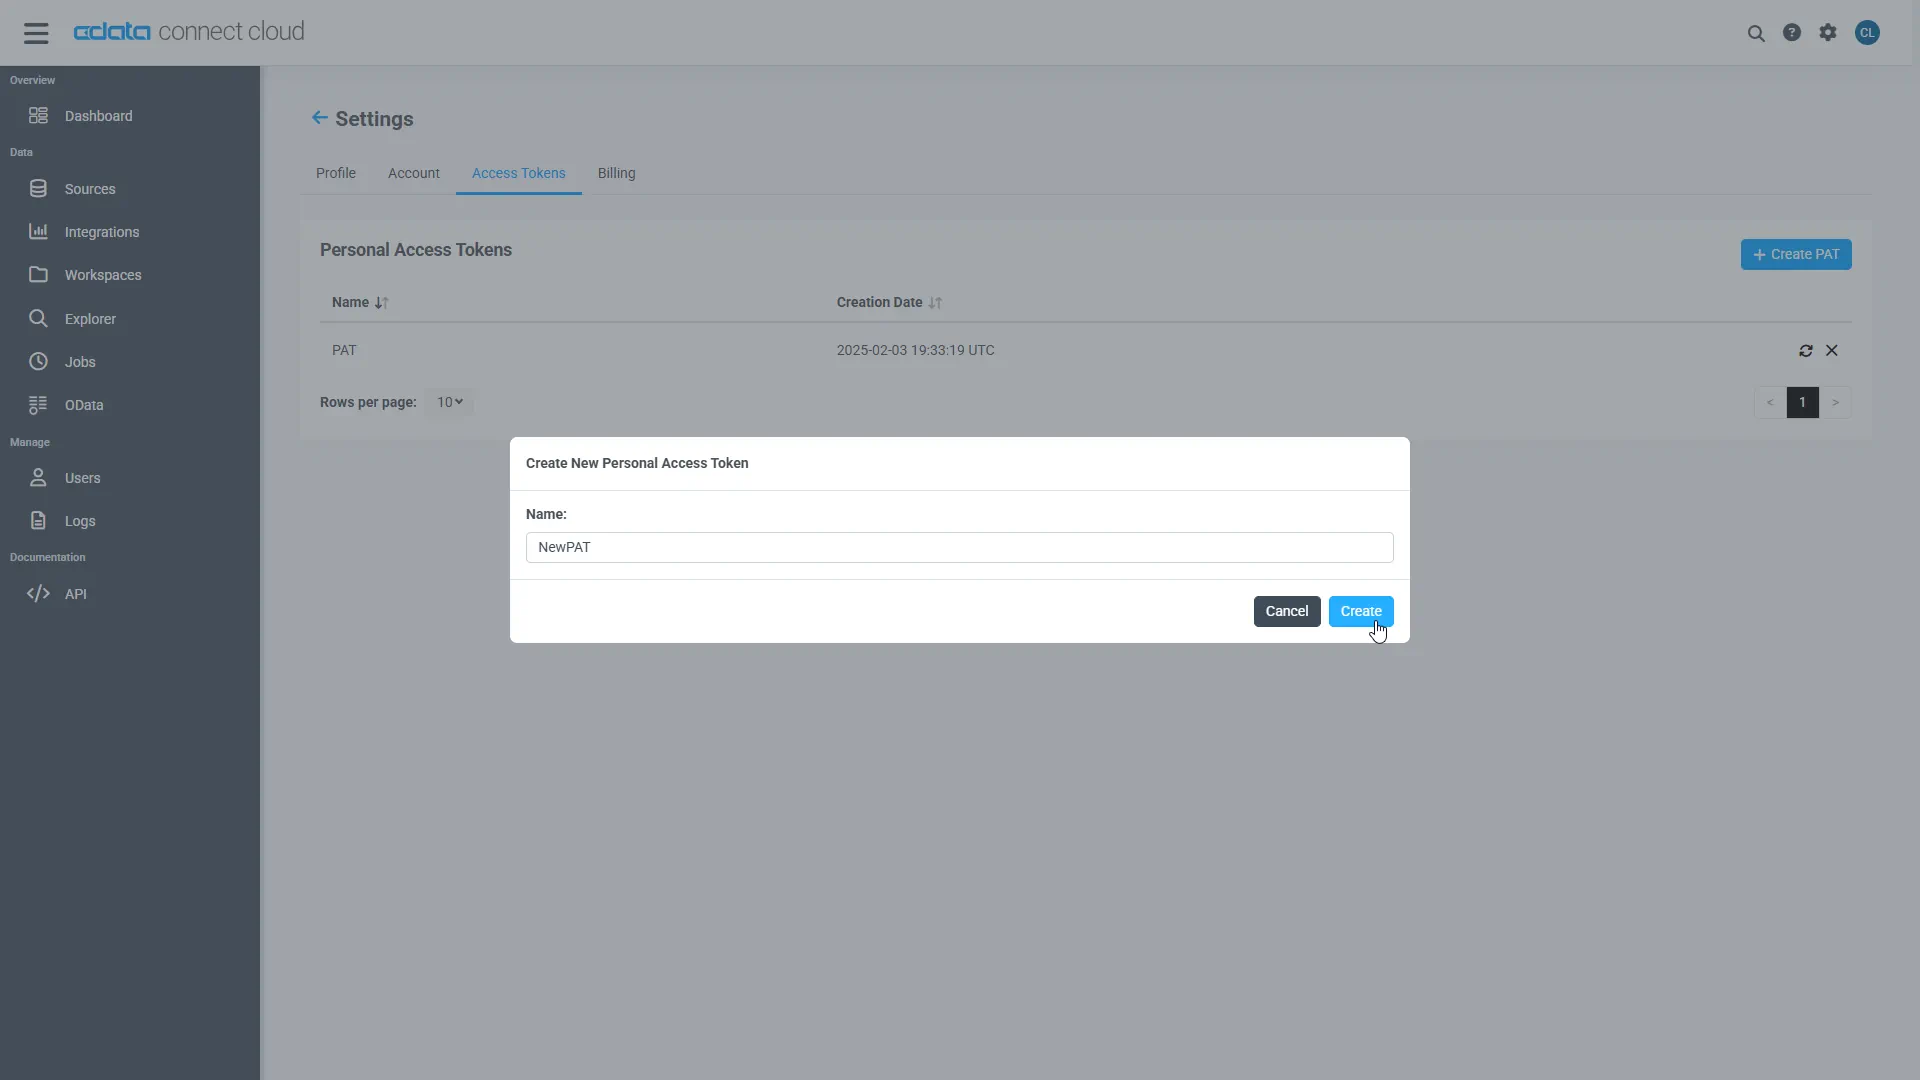
- The personal access token is only visible at creation, so be sure to copy it and store it securely for future use.
With the connection configured and a PAT generated, you are ready to connect to Grafana data from datapine.
Connecting to Grafana from datapine
Once you configure your connection to Grafana in Connect AI, you are ready to connect to Grafana from datapine.
- Log into datapine
- Click Connect to navigate to the "Connect" page
- Select MS SQL Server as the data source
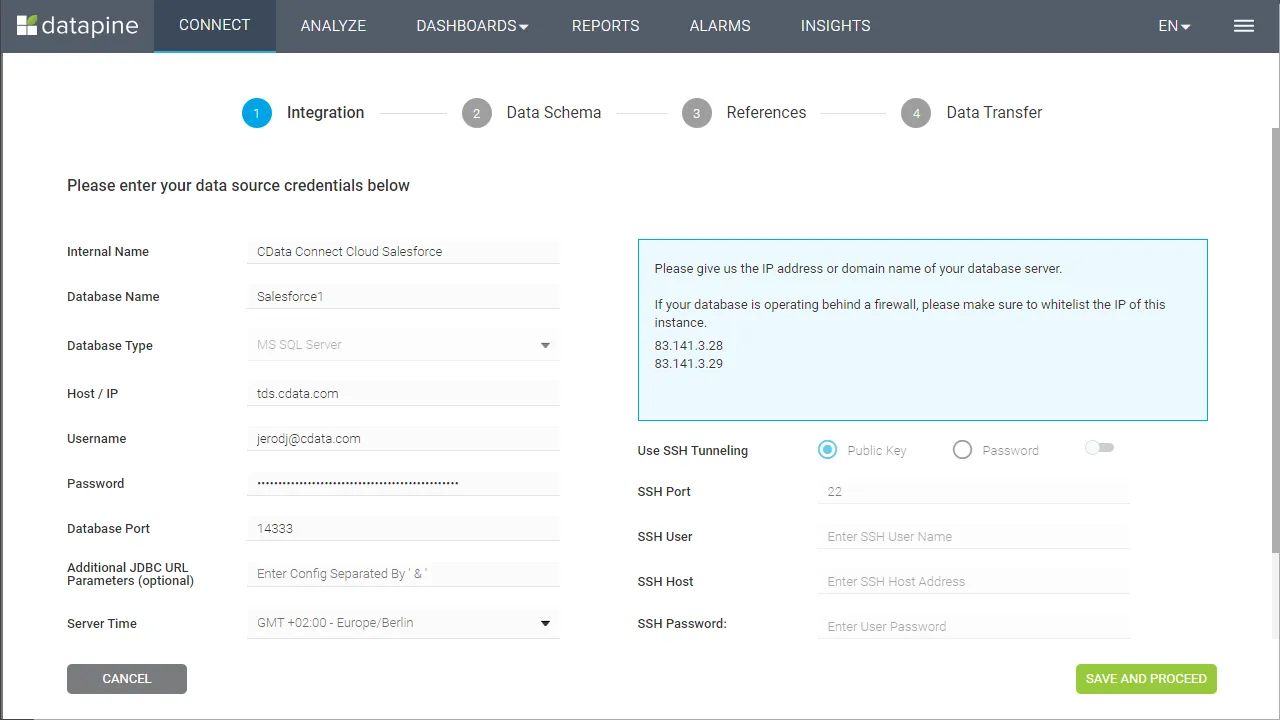
- In the Integration step, fill in the connection properties and click "Save and Proceed"
- Set the Internal Name
- Set Database Name to the name of the connection we just configured (e.g. API1)
- Set Host / IP to "tds.cdata.com"
- Set Username to your Connect AI username (e.g. [email protected])
- Set Password to the corresponding PAT
- Set Database Port to "14333"
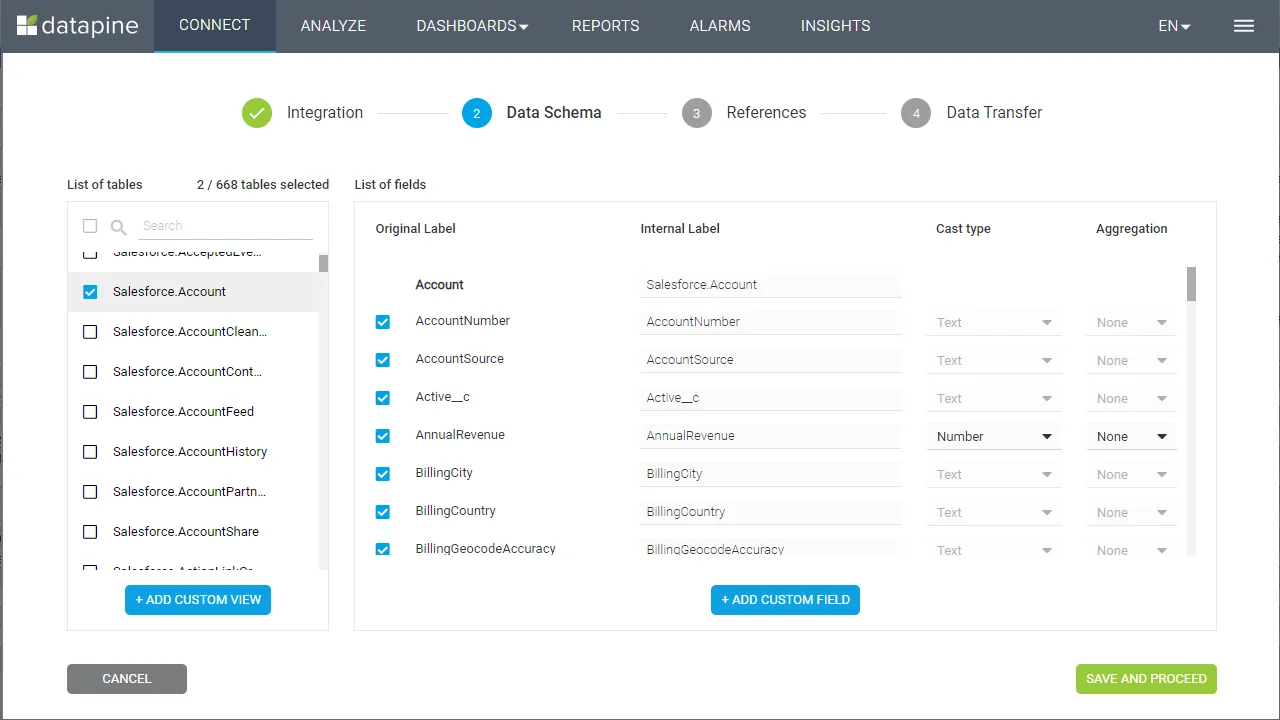
- In the Data Schema step, select the tables and fields to visualize and click "Save and Proceed"
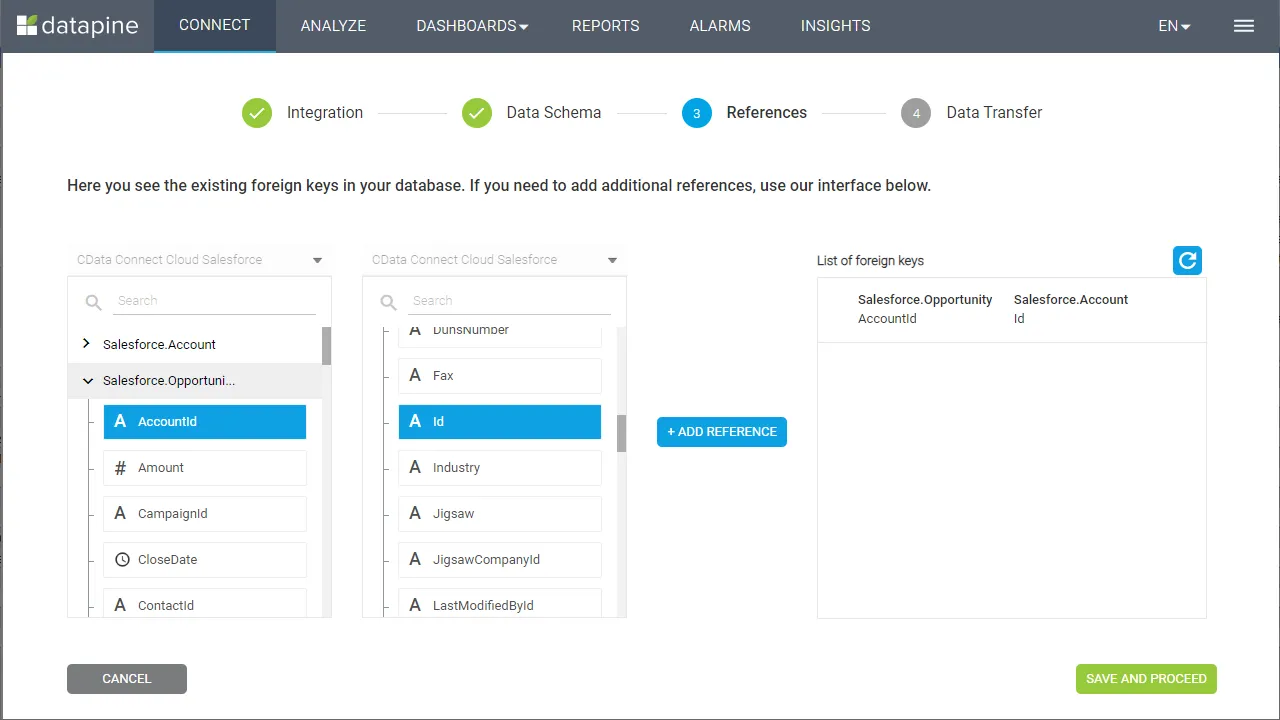
- In the References step, define any relationships between your selected tables and click "Save and Proceed"
- In the Data Transfer step, click "Go to Analyzer"
Visualize Grafana Data in datapine
After connecting to CData Connect AI, you are ready to visualize your Grafana data in datapine. Simply select the dimensions and measures you wish to visualize!
Having connect to Grafana from datapine, you are now able to visualize and analyze real-time Grafana data no matter where you are. To get live data access to hundreds of SaaS, Big Data, and NoSQL sources directly from datapine, try CData Connect AI today!