








Analyze Klipfolio Data in Infragistics Reveal

Reveal, an offering from Infragistics, serves as a data visualization tool that seamlessly integrates with CData Connect AI. Together, they empower users to deliver dynamic dashboards using real-time data from a diverse range of data sources, including Klipfolio data. In this article, we will guide you through the process of connecting to Klipfolio via Connect AI and subsequently linking Connect AI with Infragistics Reveal to construct a straightforward dashboard.
Connect to Klipfolio from Infragistics Reveal
To work with live Klipfolio data in Infragistics Reveal, we need to connect to Klipfolio from Connect AI, provide user access to the connection, and create a Workspace for the Klipfolio data.
Connect to Klipfolio from Connect AI
CData Connect AI uses a straightforward, point-and-click interface to connect to data sources.
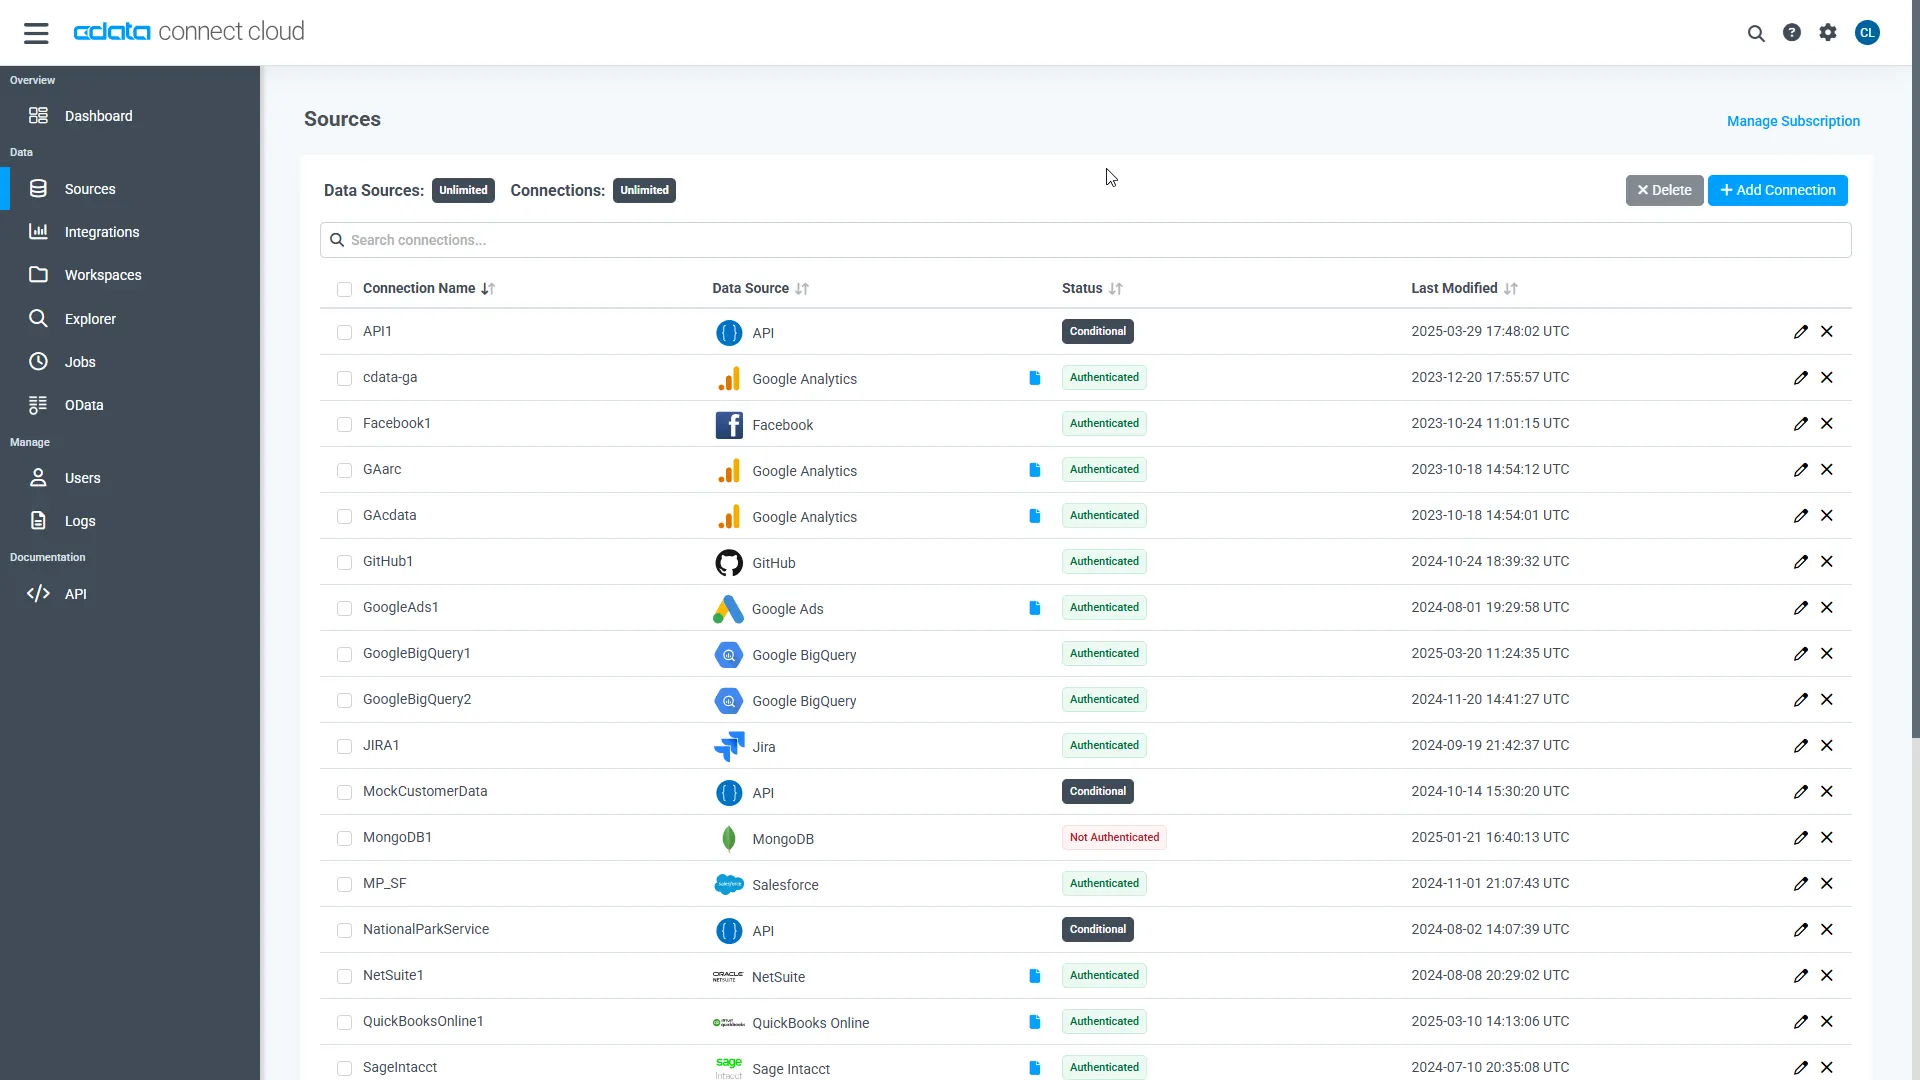
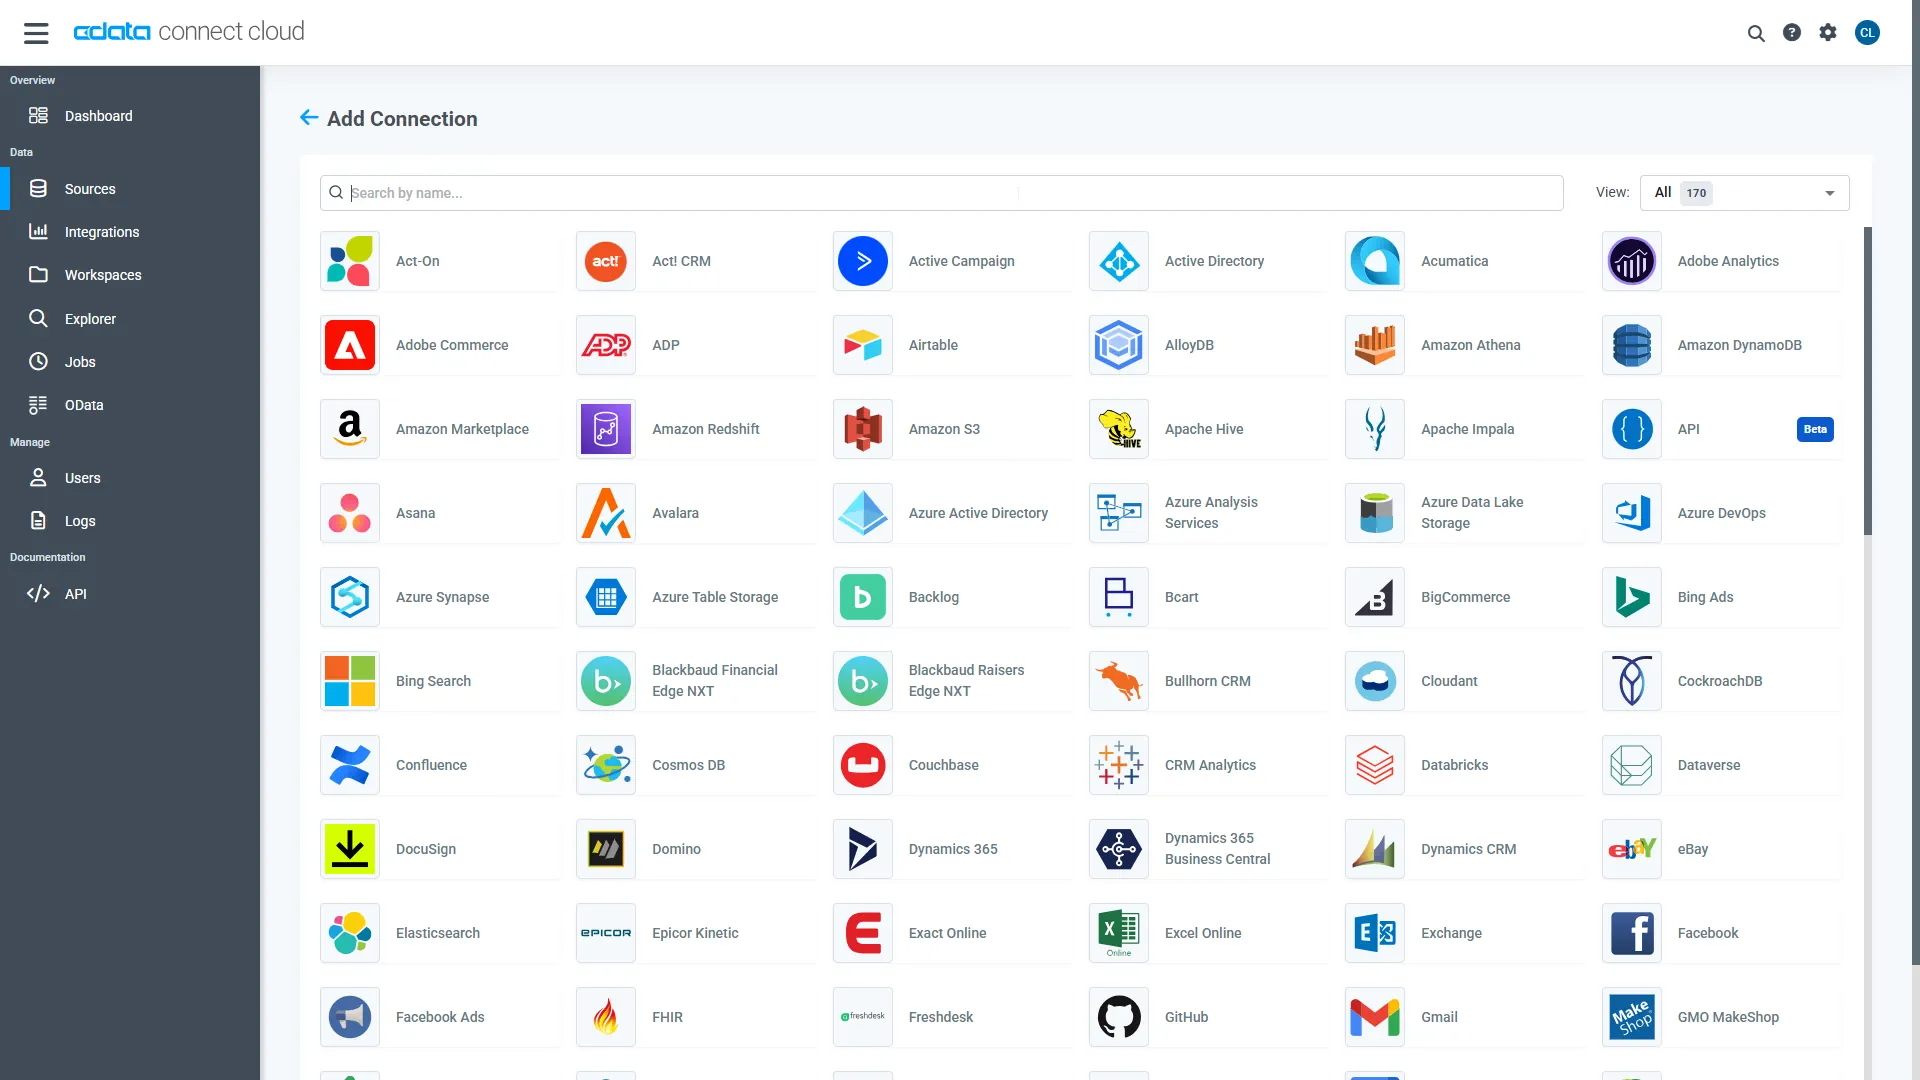
- Log into Connect AI, click Sources, and then click Add Connection
- Select "Klipfolio" from the Add Connection panel
-
Enter the necessary authentication properties to connect to Klipfolio.
Start by setting the Profile connection property to the location of the Klipfolio Profile on disk (e.g. C:\profiles\Klipfolio.apip). Next, set the ProfileSettings connection property to the connection string for Klipfolio (see below).
Klipfolio API Profile Settings
In order to authenticate to Klipfolio, you'll need to provide your API Key. You can generate an API key from the Klipfolio Dashboard app through either the My Profile page or from Users if you are an administrator (you must have the user.manage permission). Set the API Key in the ProfileSettings property to connect.
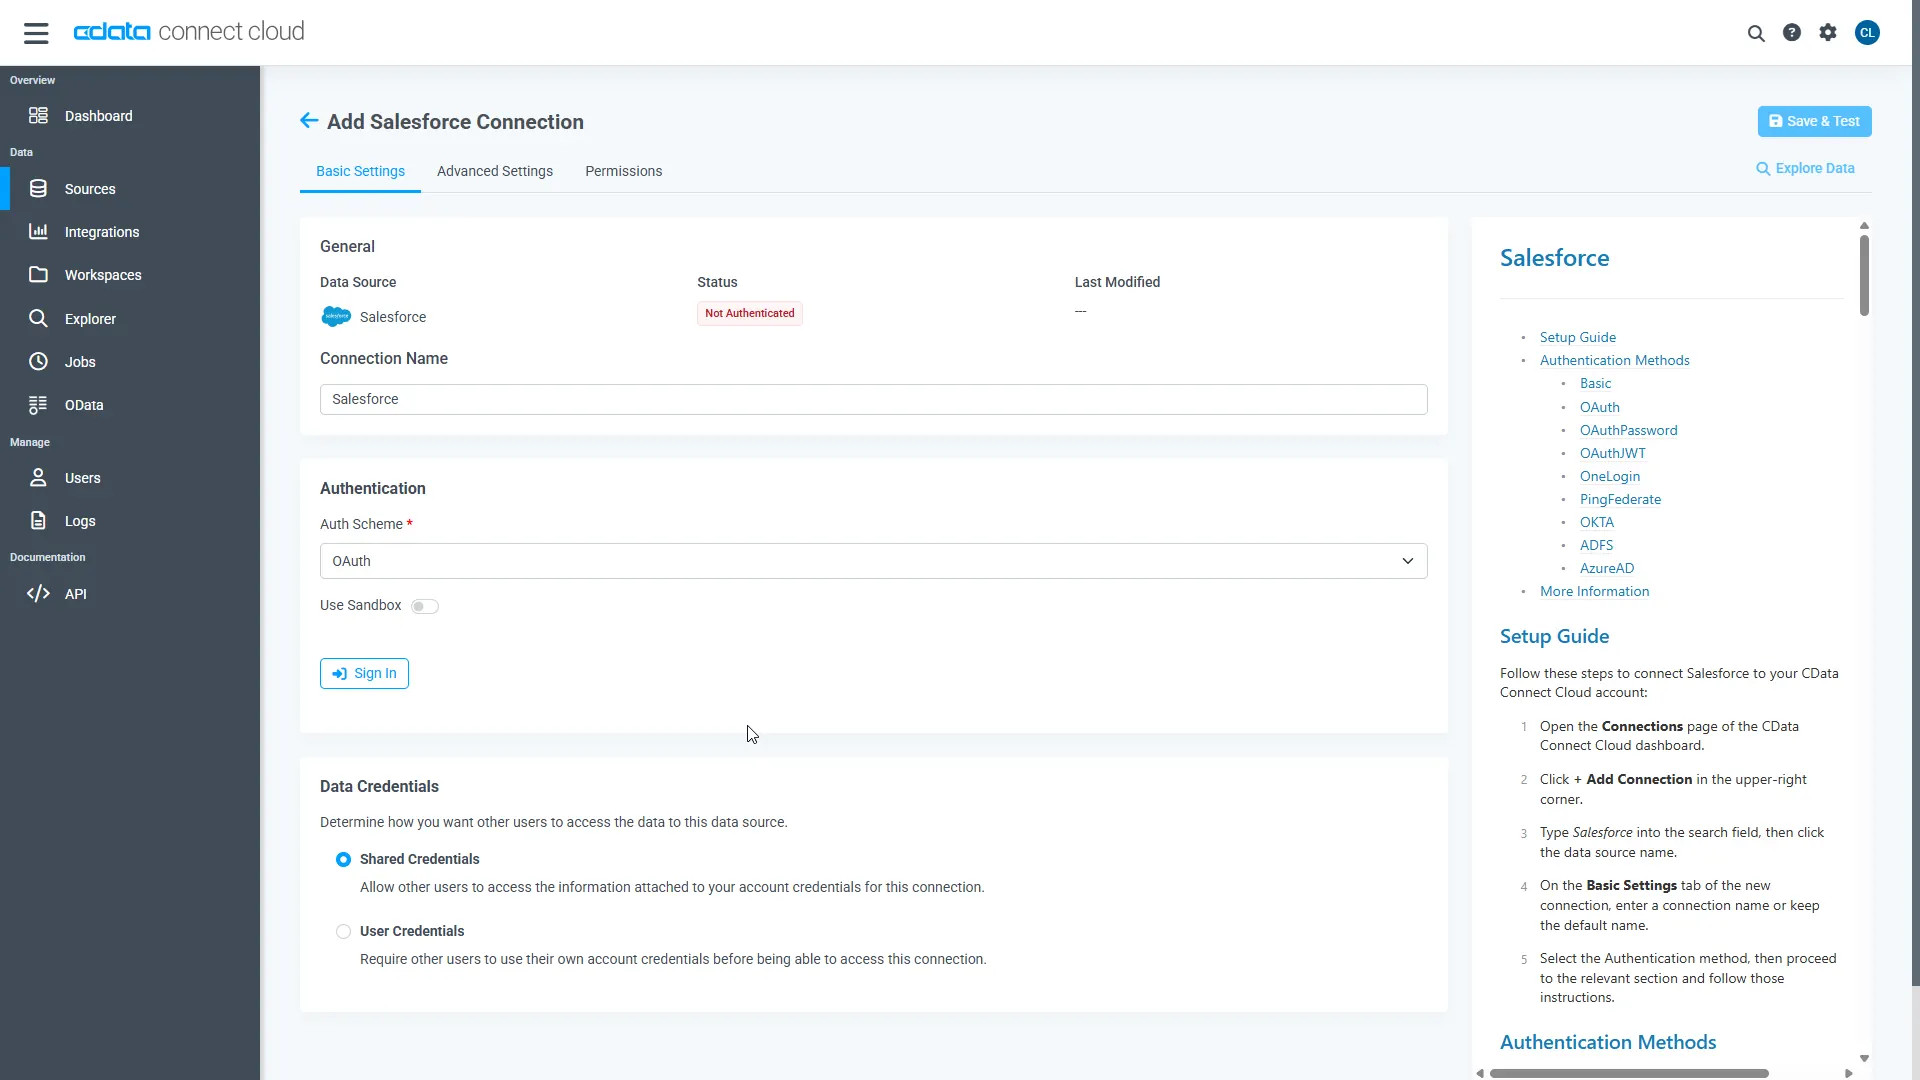
- Click Save & Test
-
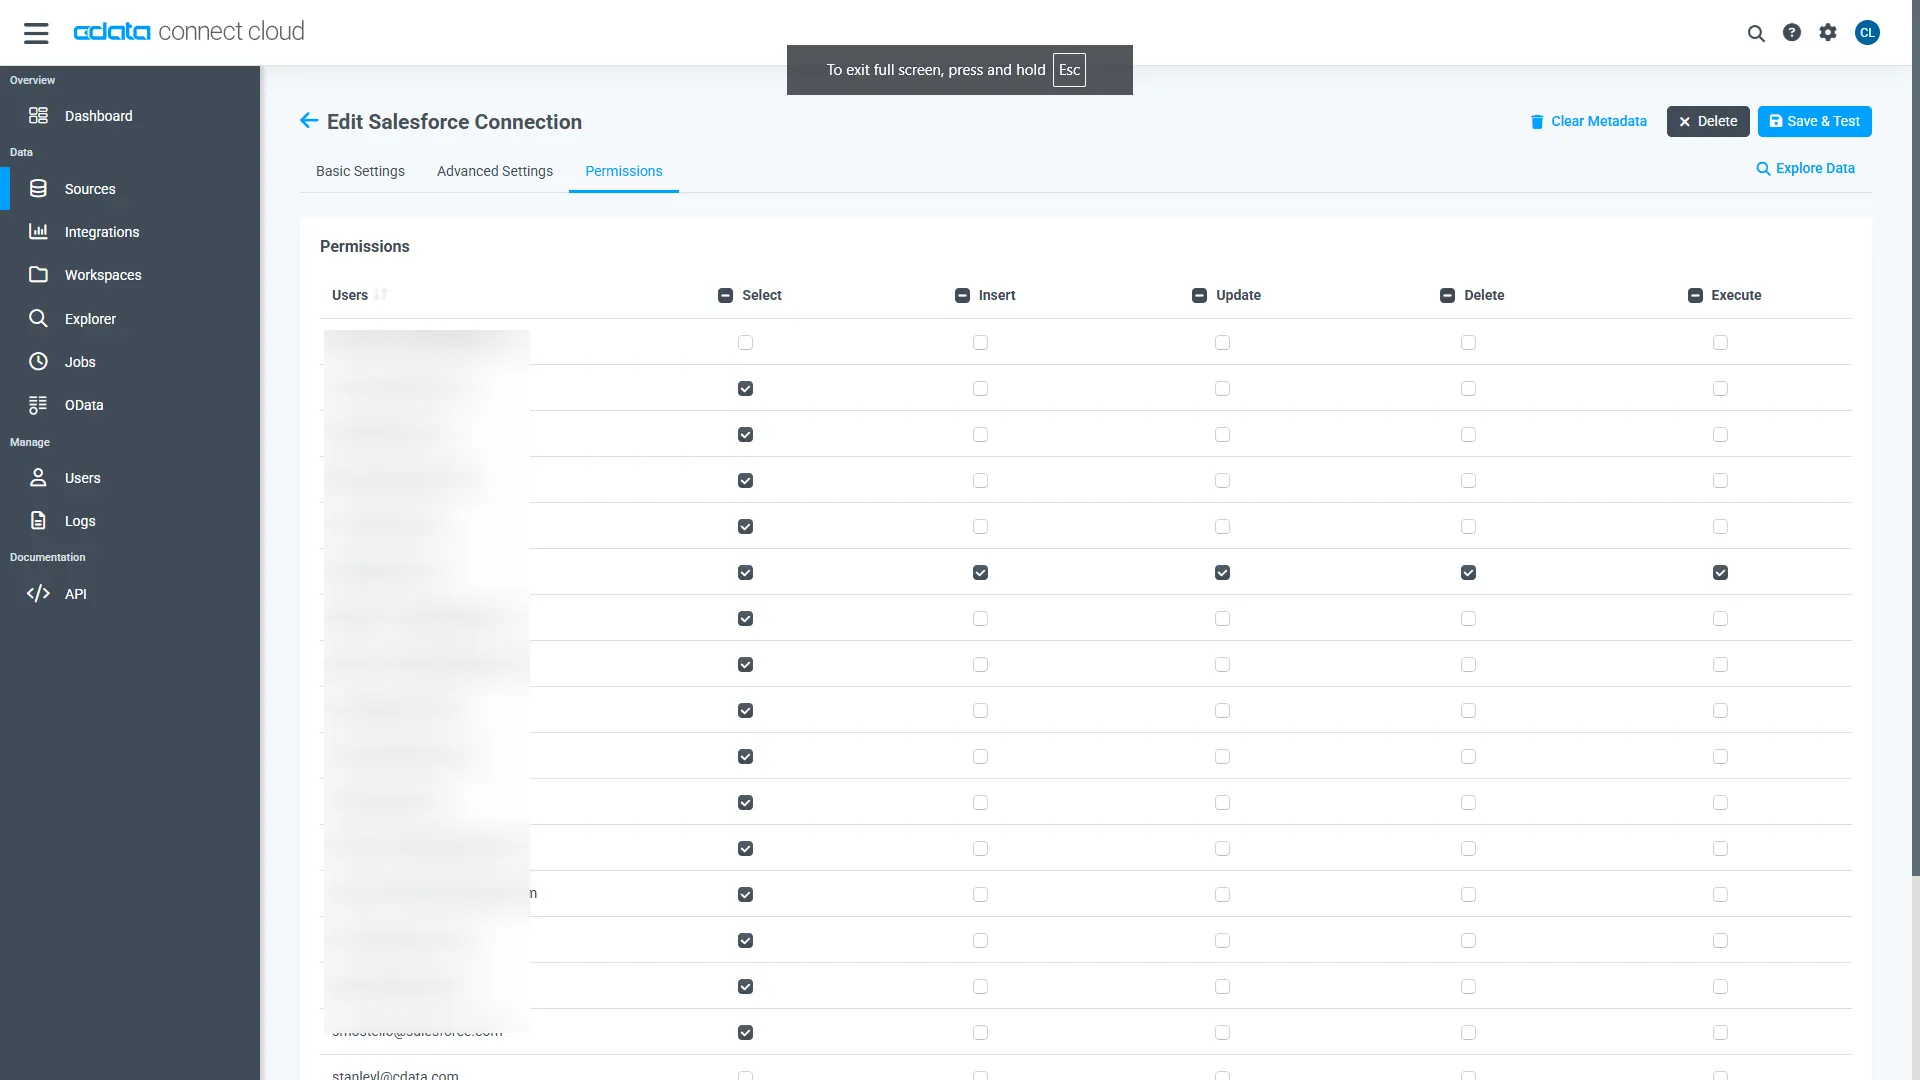
Navigate to the Permissions tab in the Add Klipfolio Connection page and update the User-based permissions.
Add a Personal Access Token
When connecting to Connect AI through the REST API, the OData API, or the Virtual SQL Server, a Personal Access Token (PAT) is used to authenticate the connection to Connect AI. It is best practice to create a separate PAT for each service to maintain granularity of access.
- Click on the Gear icon () at the top right of the Connect AI app to open the settings page.
- On the Settings page, go to the Access Tokens section and click Create PAT.
-
Give the PAT a name and click Create.
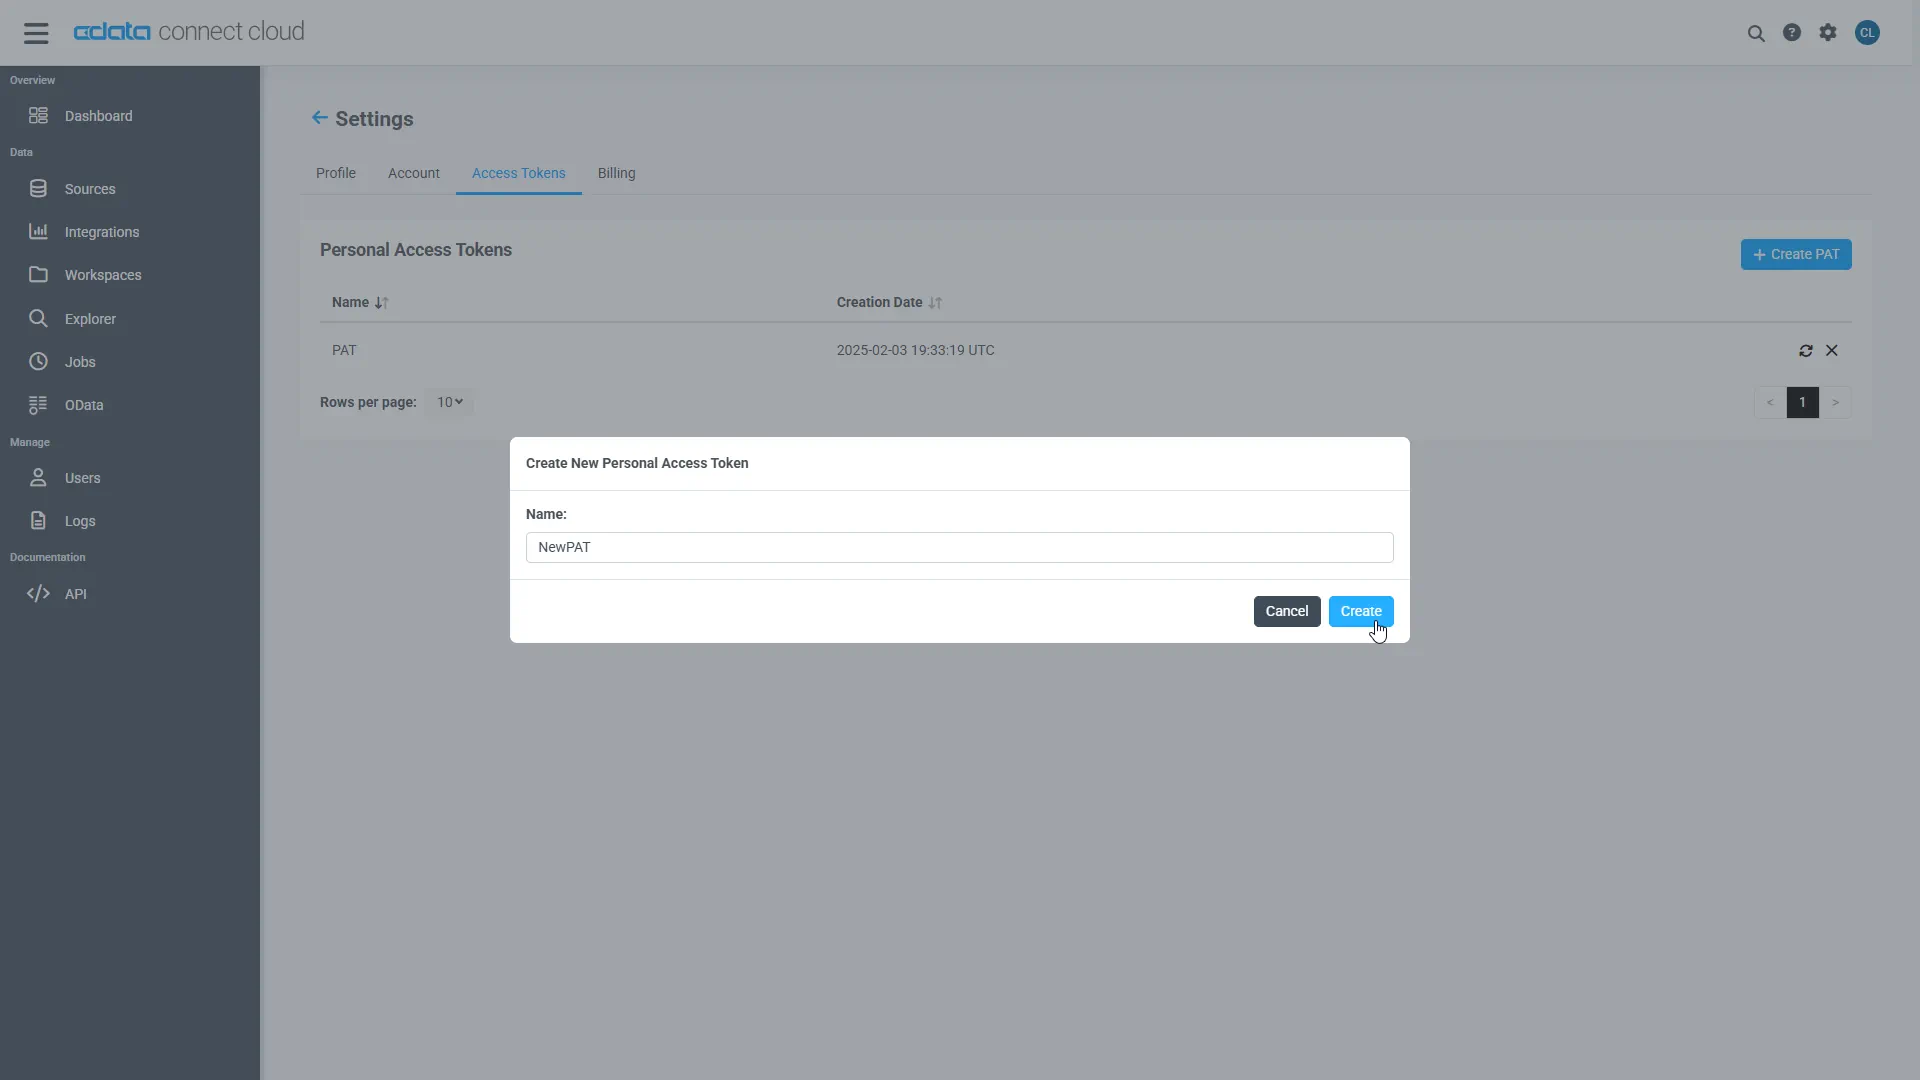
- The personal access token is only visible at creation, so be sure to copy it and store it securely for future use.
Configure Klipfolio Endpoints for Infragistics Reveal
After connecting to Klipfolio, create a workspace for your desired table(s).
-
Navigate to the Workspaces page and click Add to create a new Workspace (or select an existing workspace).
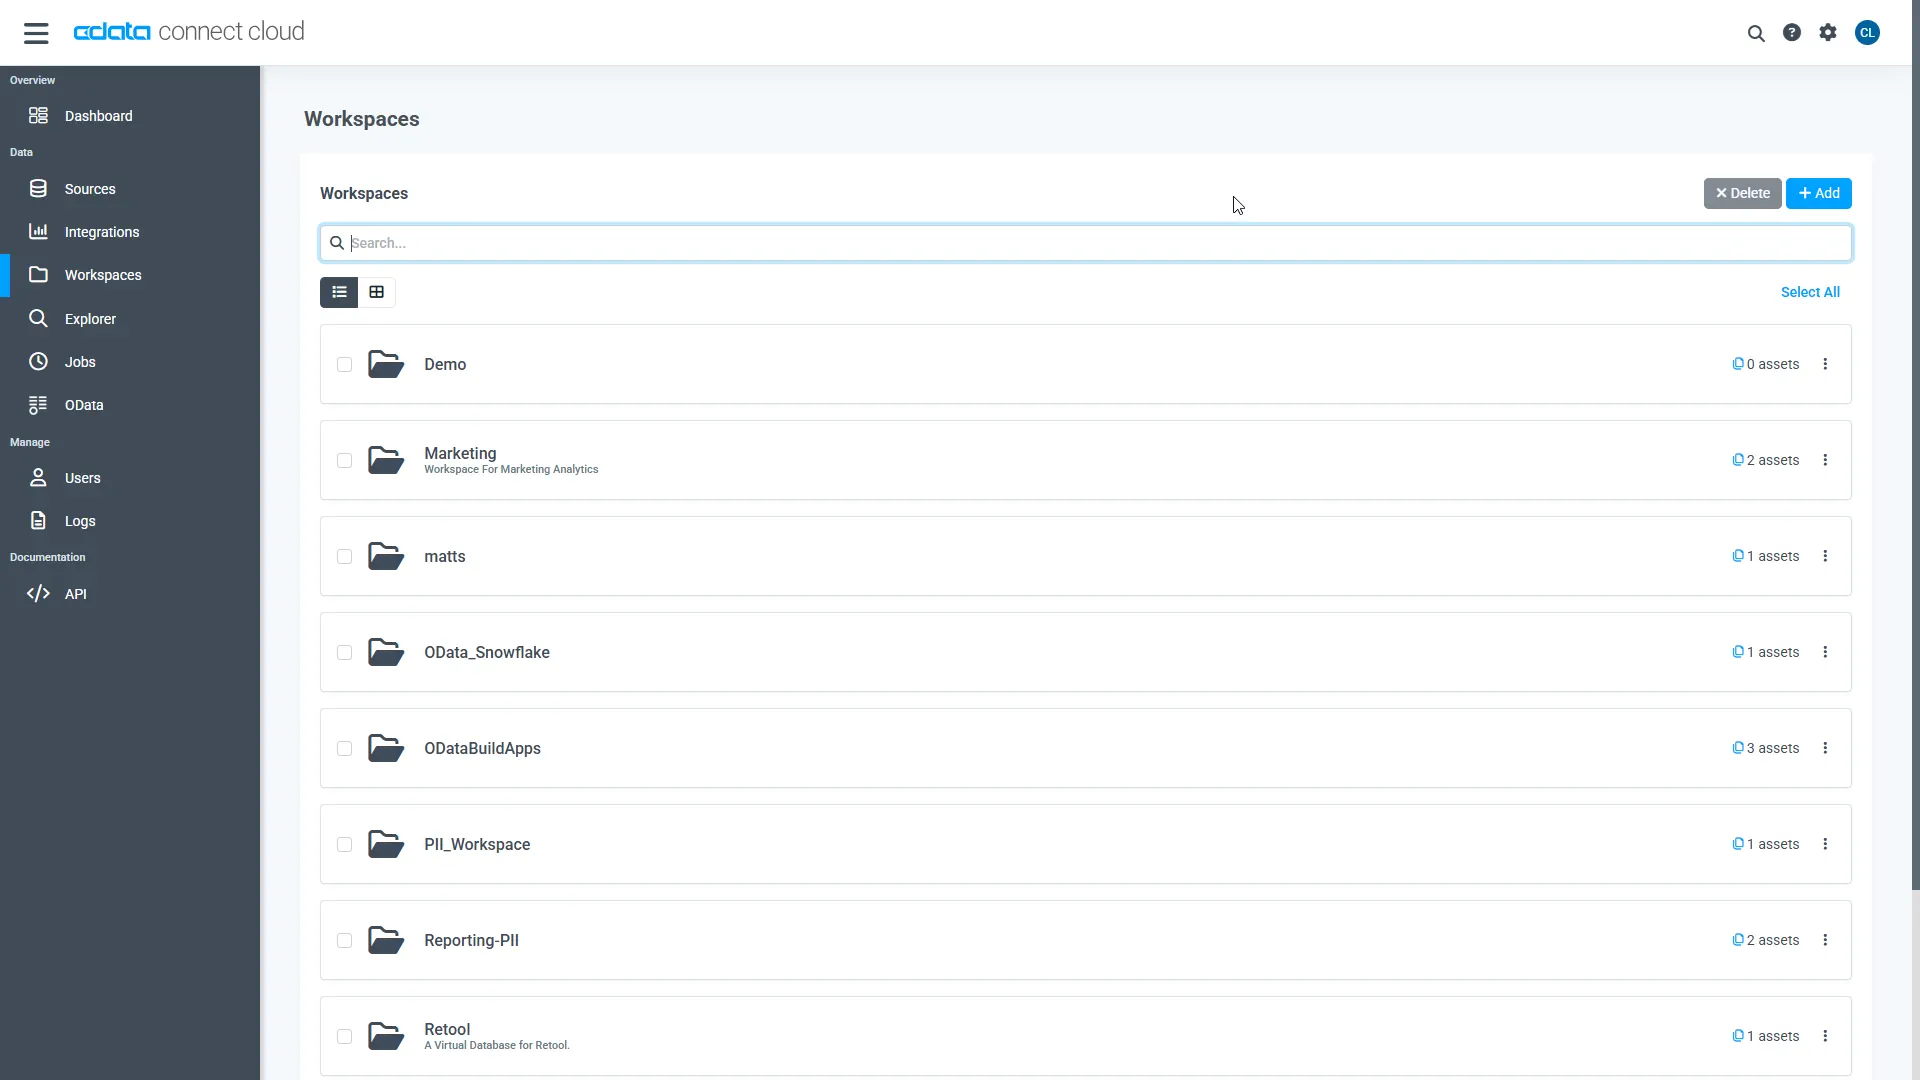
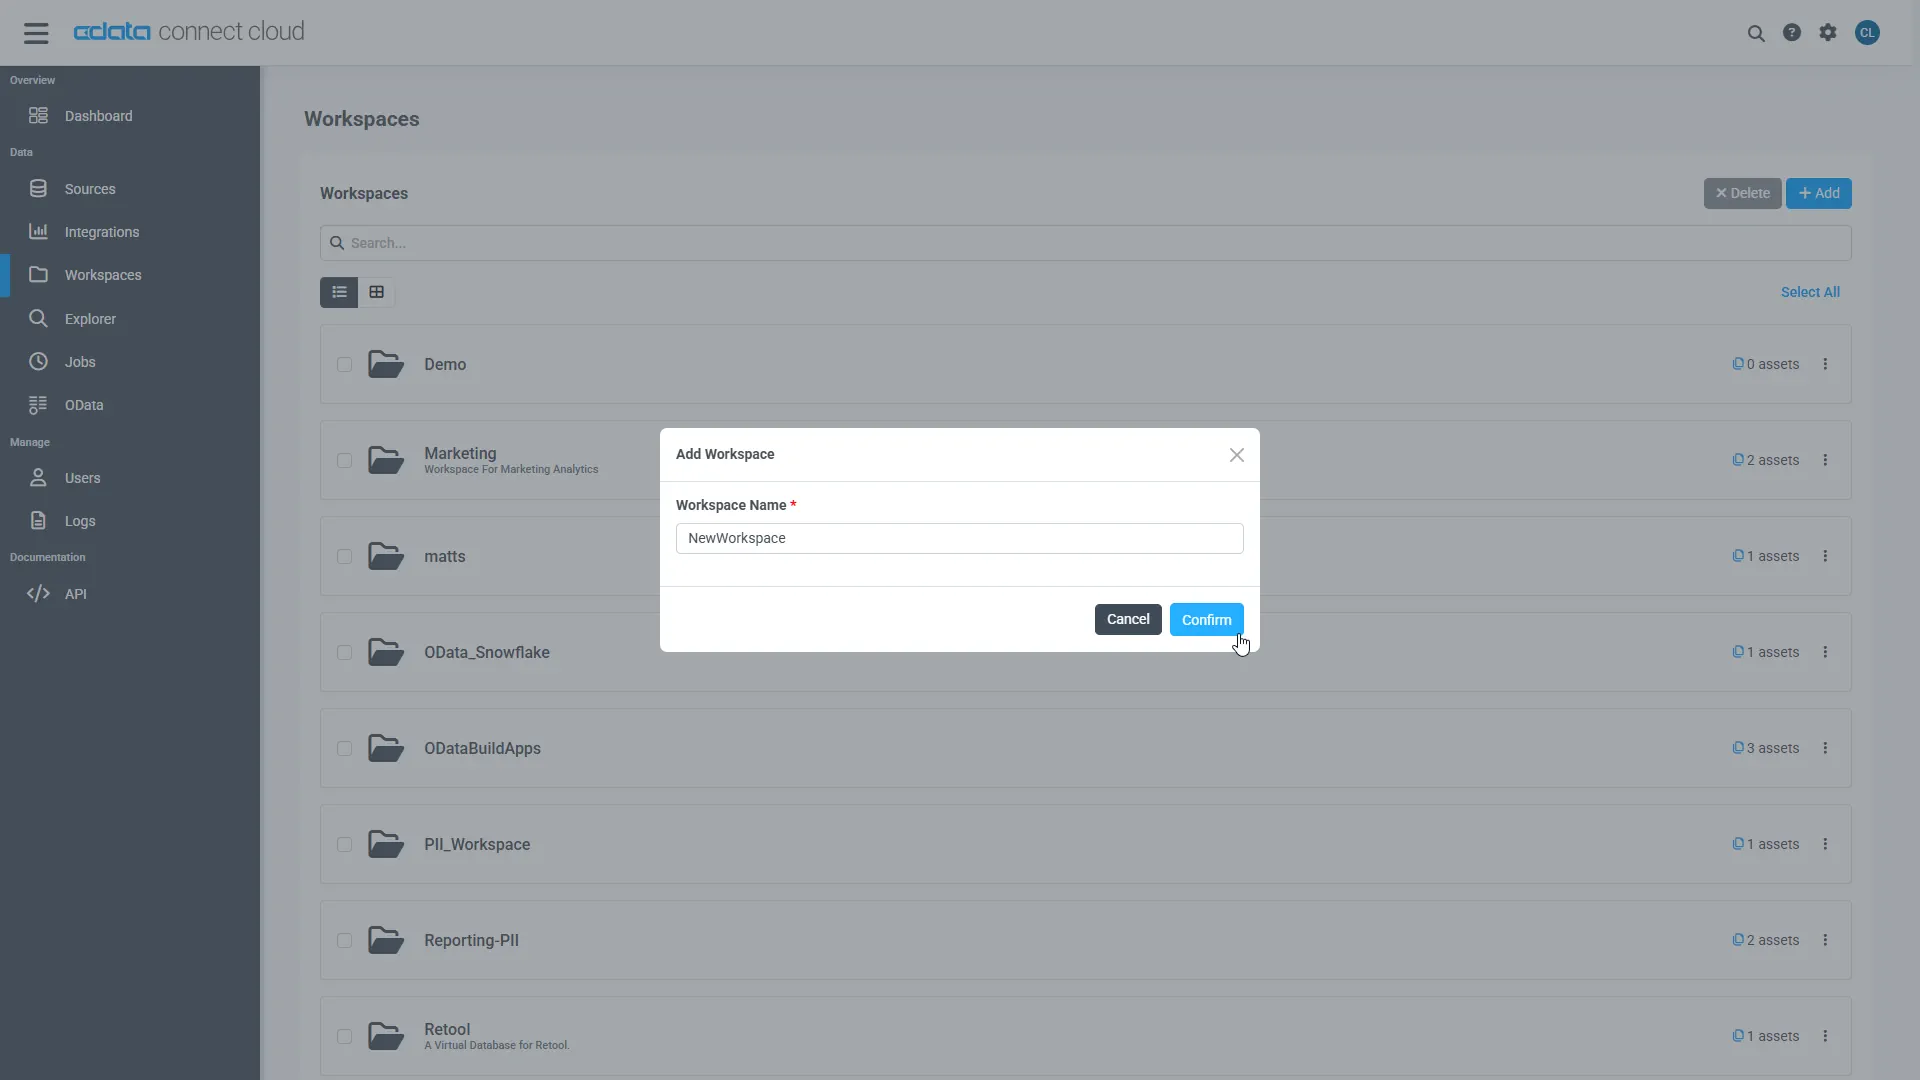
- Click Add to add new assets to the Workspace.
-
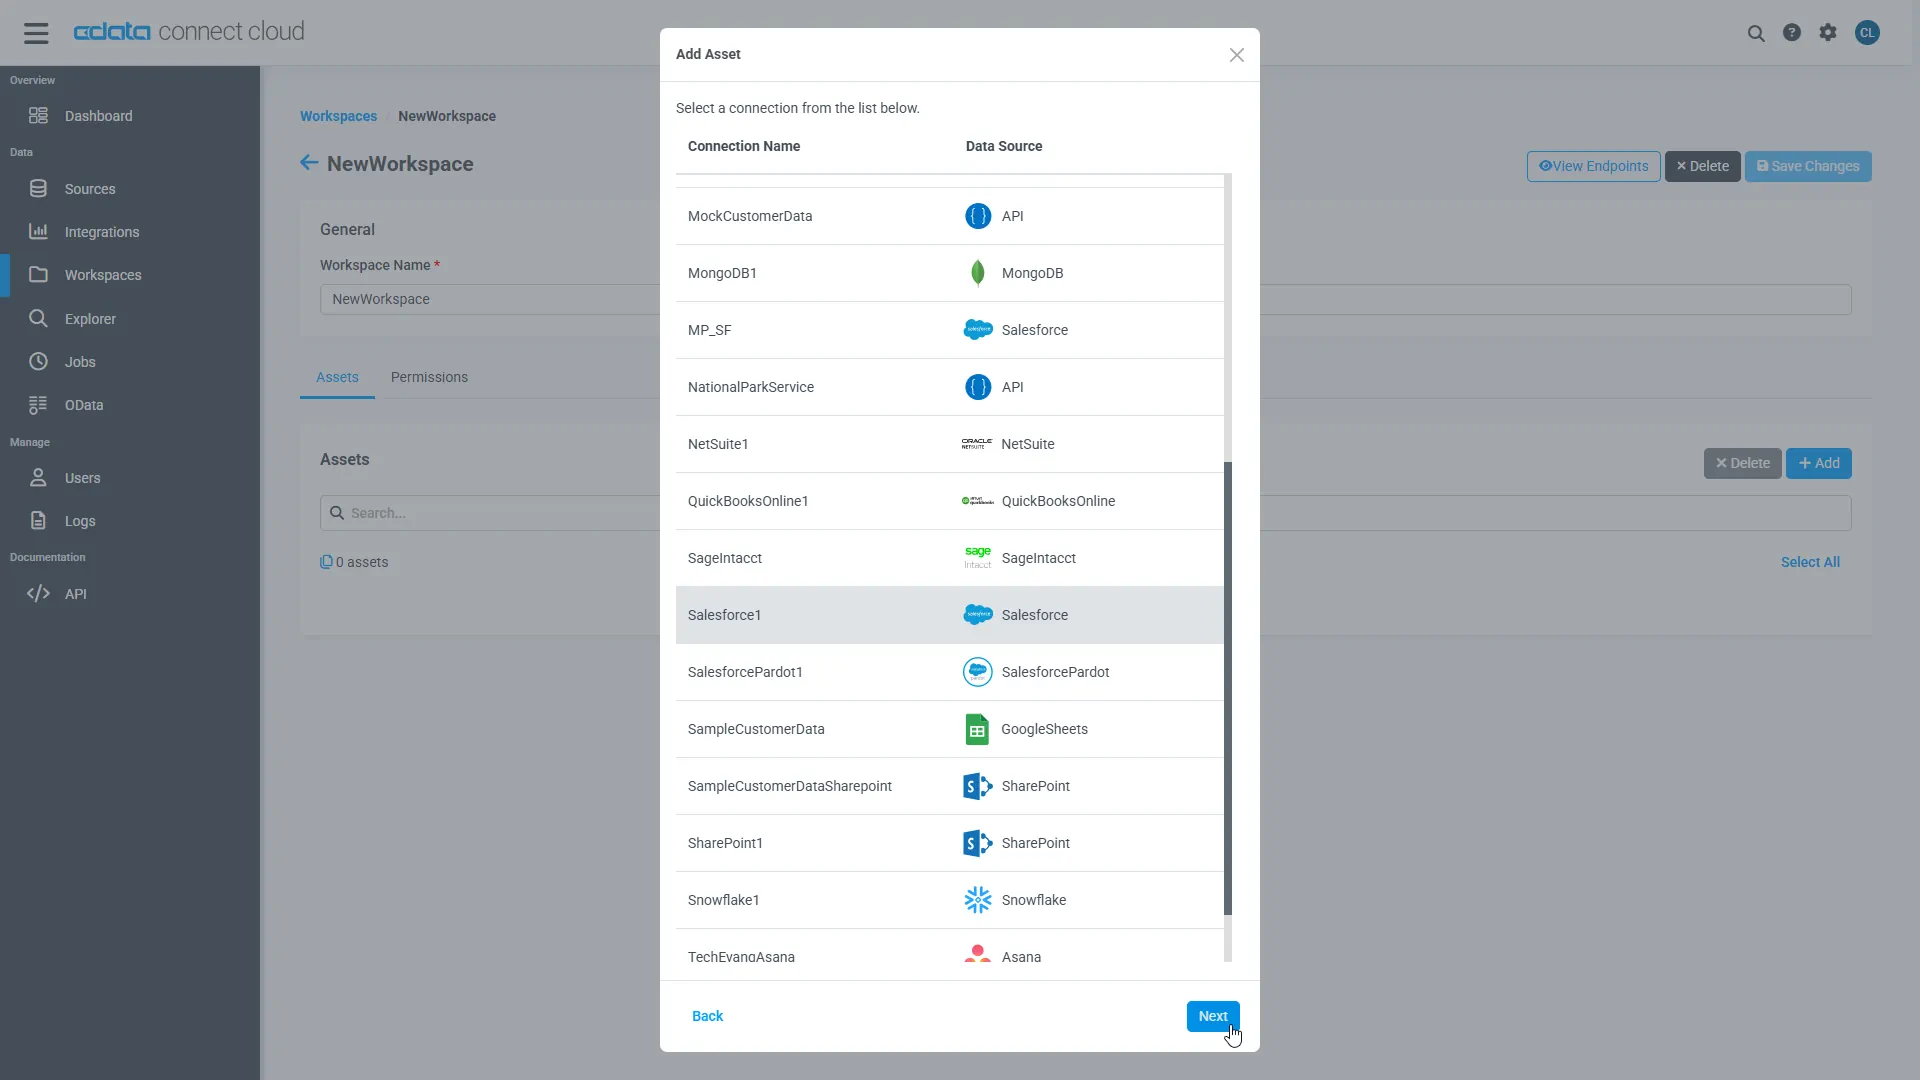
Select the Klipfolio connection (e.g. API1) and click Next.
-
Select the table(s) you wish to work with and click Confirm.
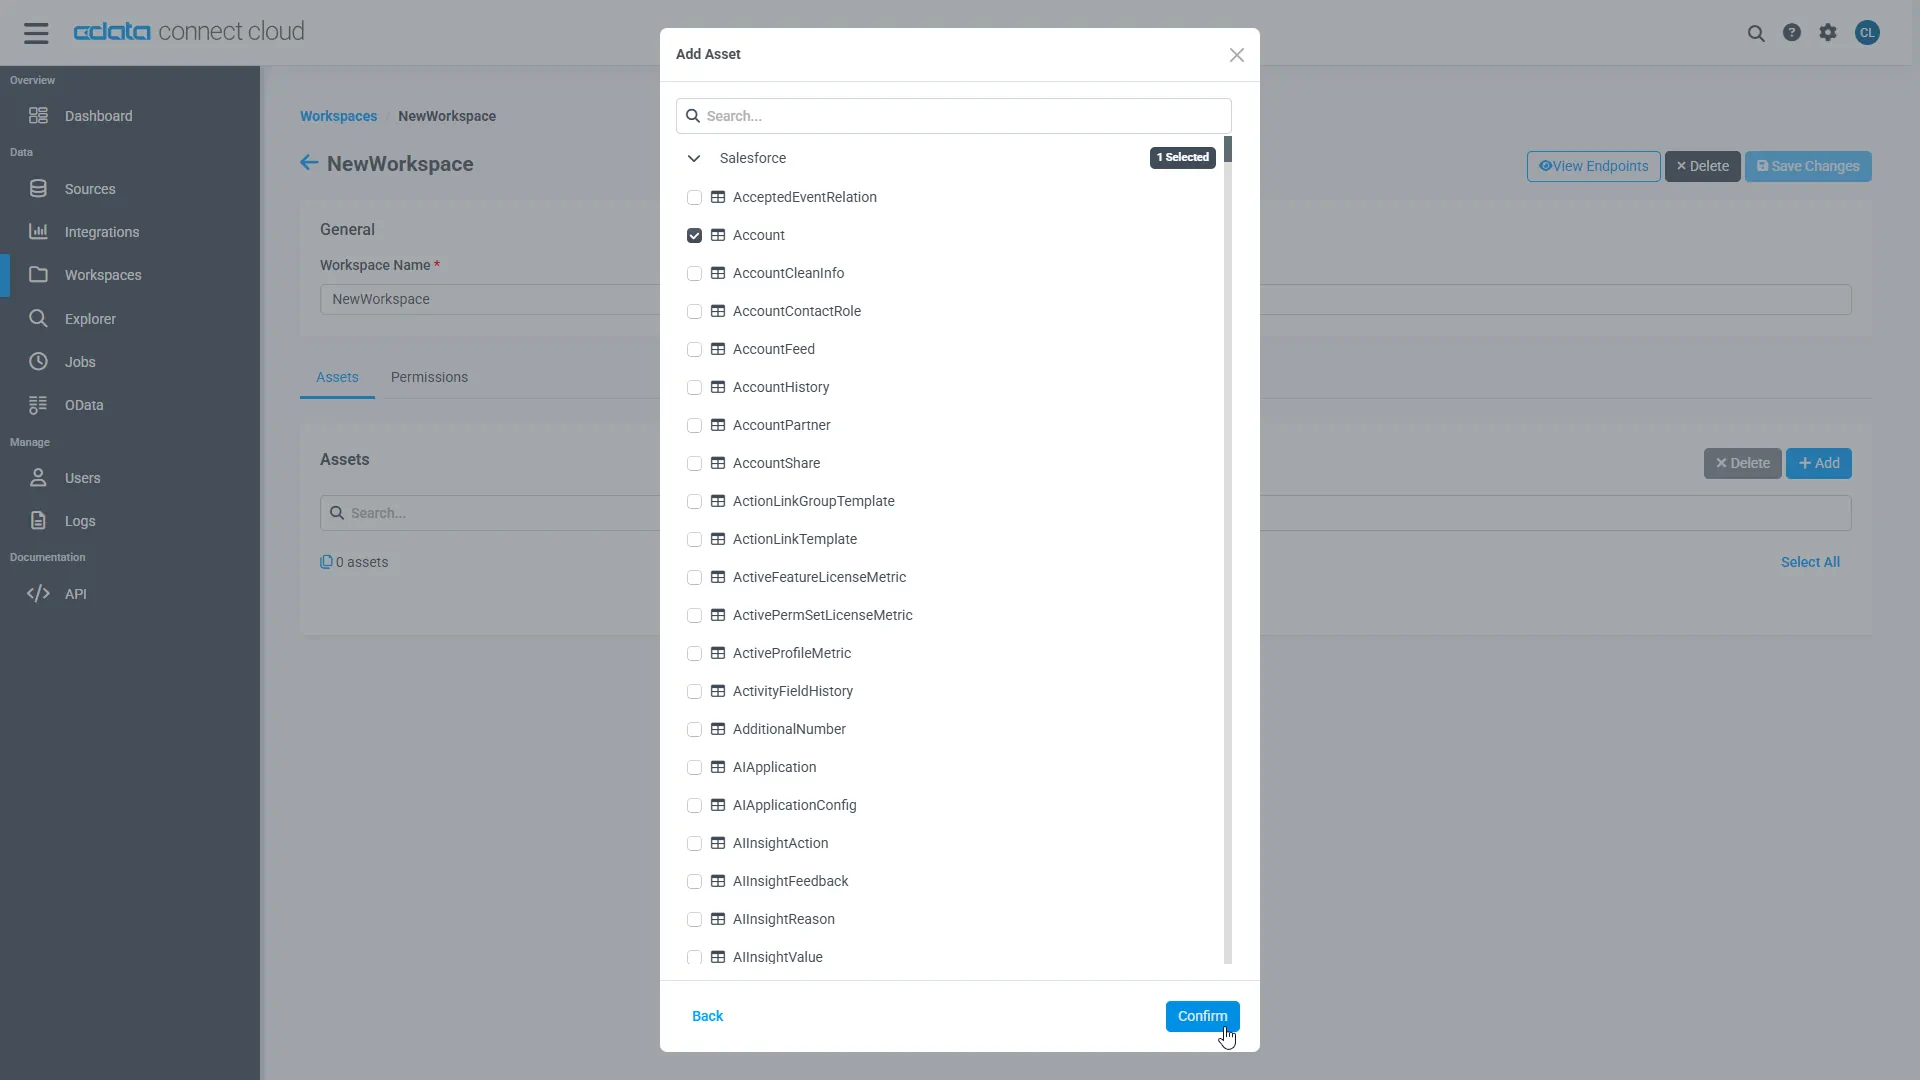
- Make note of the OData Service URL for your workspace, e.g. https://cloud.cdata.com/api/odata/{workspace_name}
With the connection, PAT, and Workspace configured, you are ready to connect to Klipfolio data from Infragistics Reveal.
Create a Dashboard in Reveal
With Connect AI configured, we can visualize Klipfolio data in Reveal.
- Log into Reveal and click Dashboards -> New
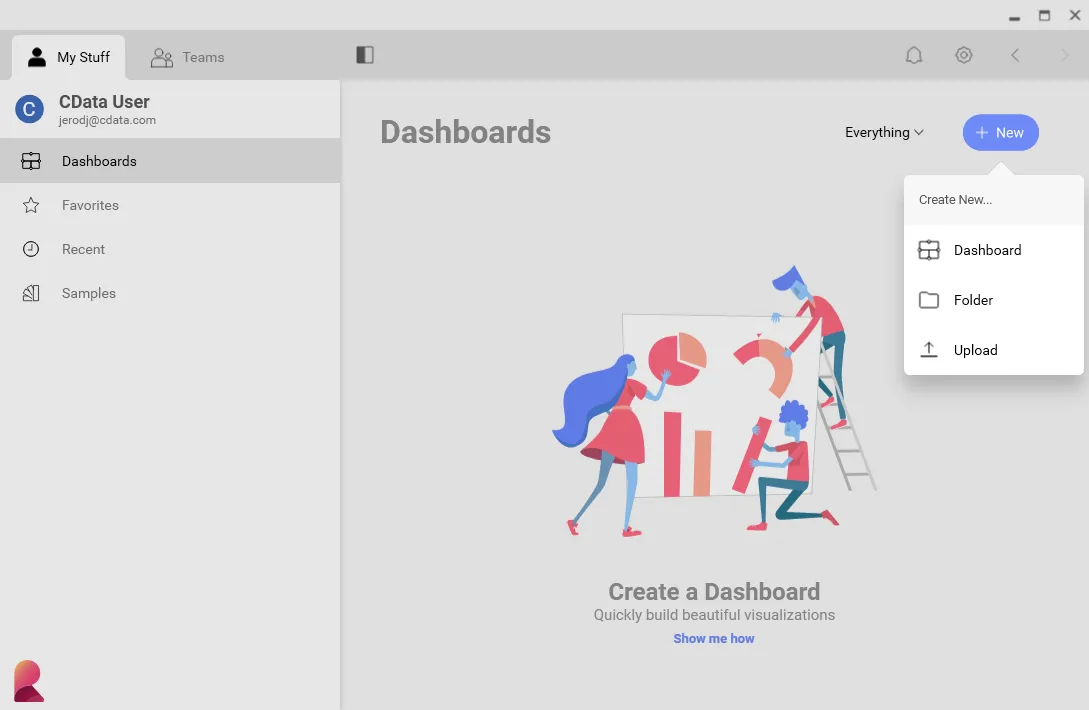
- Click Data Sources -> OData Feed
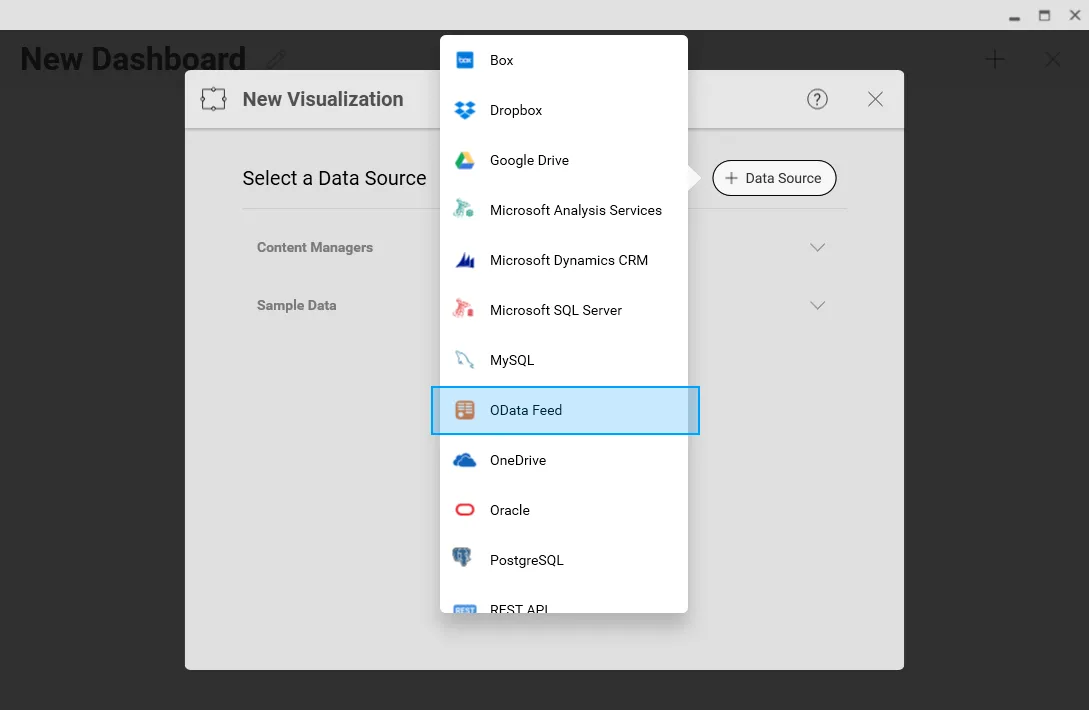
- Specify the Connect AI OData API endpoint URL (found on the OData page): https://cloud.cdata.com/api/odata/{workspace_name}
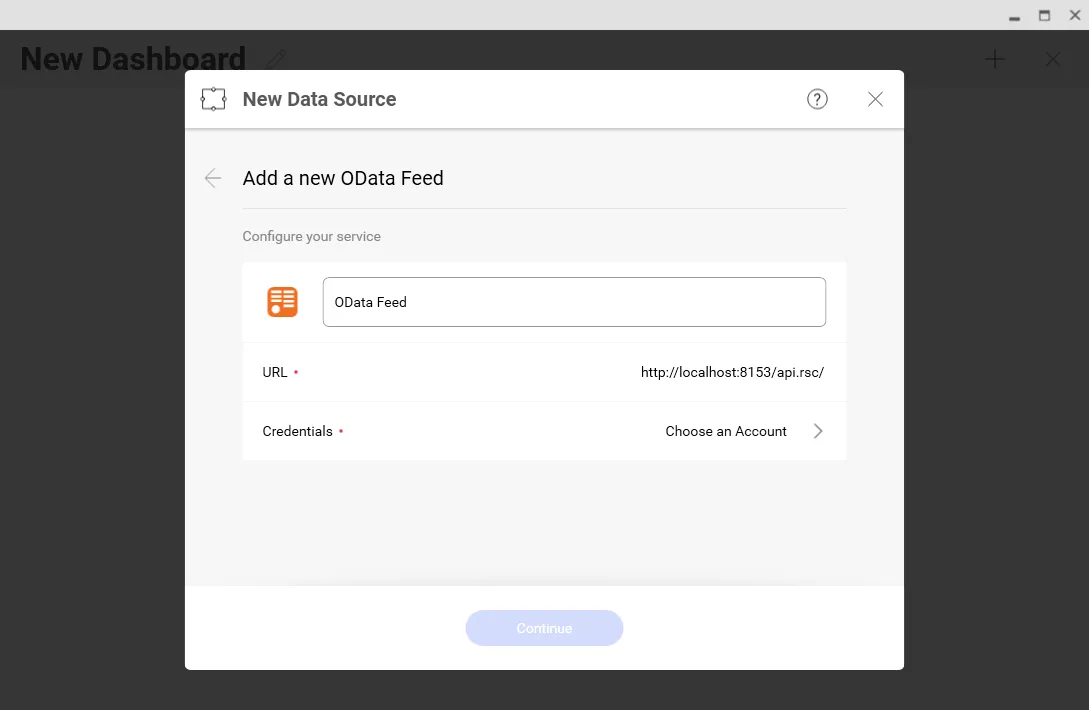
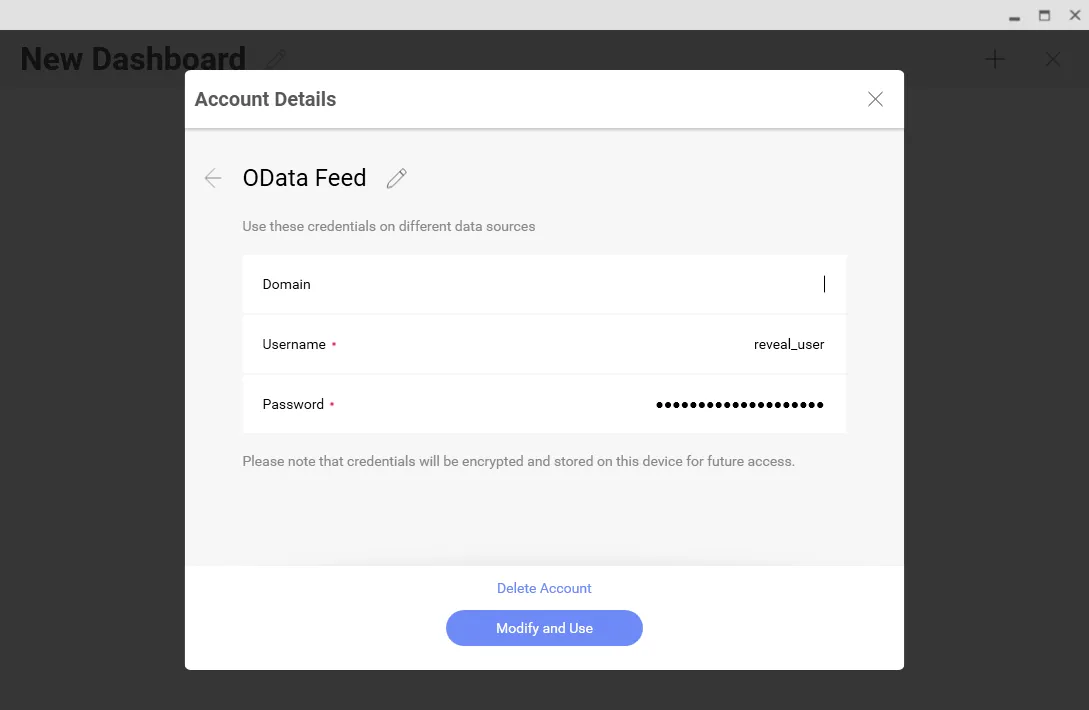
- Select Generic Credentials and
- Set Username to a Connect AI username (e.g. [email protected])
- Set Password to the PAT for the user
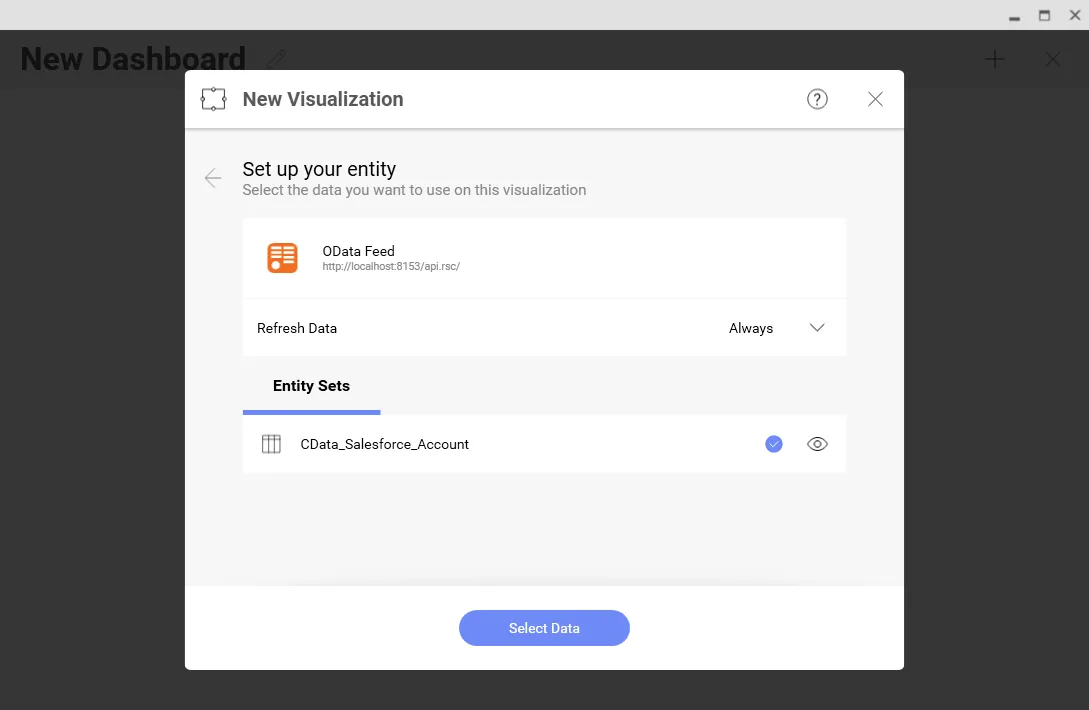
- Select the entity you wish to visualize
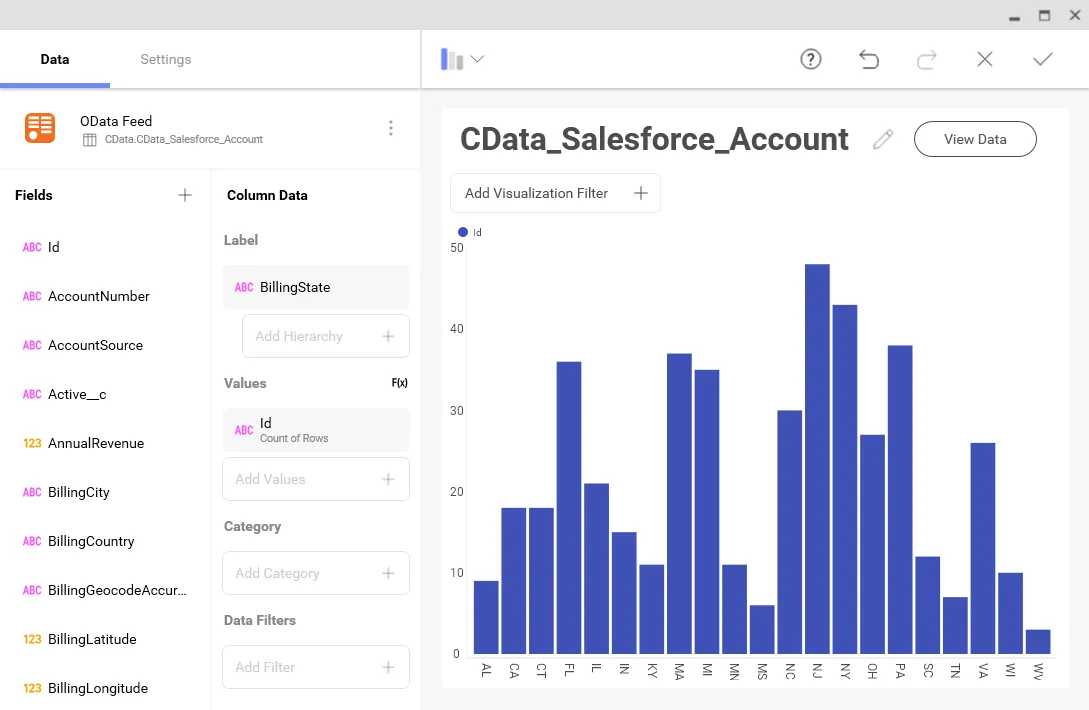
- Select fields and choose a chart type
More Information & Free Trial
At this point, you have created a simple dashboard from live Klipfolio data. For more information on creating OData feeds from Klipfolio (and more than 100 other sources), visit the Connect AI page. Sign up for a free trial and start working live Klipfolio data in tools that consume OData APIs.