








Visualize Live Printify Data in the Power BI Service

Power BI transforms your company's data into rich visuals for you to collect and organize so you can focus on what matters to you. When paired with CData Connect AI, you get instant access to Printify data for visualizations, dashboards, and more. This article shows how to build and publish a dataset from Printify data in Power BI and then create reports on Printify data in the Power BI service.
CData Connect AI provides a pure SQL interface for Printify, allowing you to easily build reports from live Printify data in Power BI — with no need to replicate the data. As you build visualizations, Power BI generates SQL queries to gather data. Using optimized data processing out of the box, CData Connect AI pushes all supported SQL operations (filters, JOINs, etc) directly to Printify, leveraging server-side processing to quickly return Printify data.
NOTE: You can also import Printify data into Power BI through Connect AI (instead of using the on-premise gateway). Read how in the related Knowledge Base article.
Configure Printify Connectivity for Power BI
Connectivity to Printify from Power BI is made possible through CData Connect AI. To work with Printify data from Power BI, we start by creating and configuring a Printify connection.
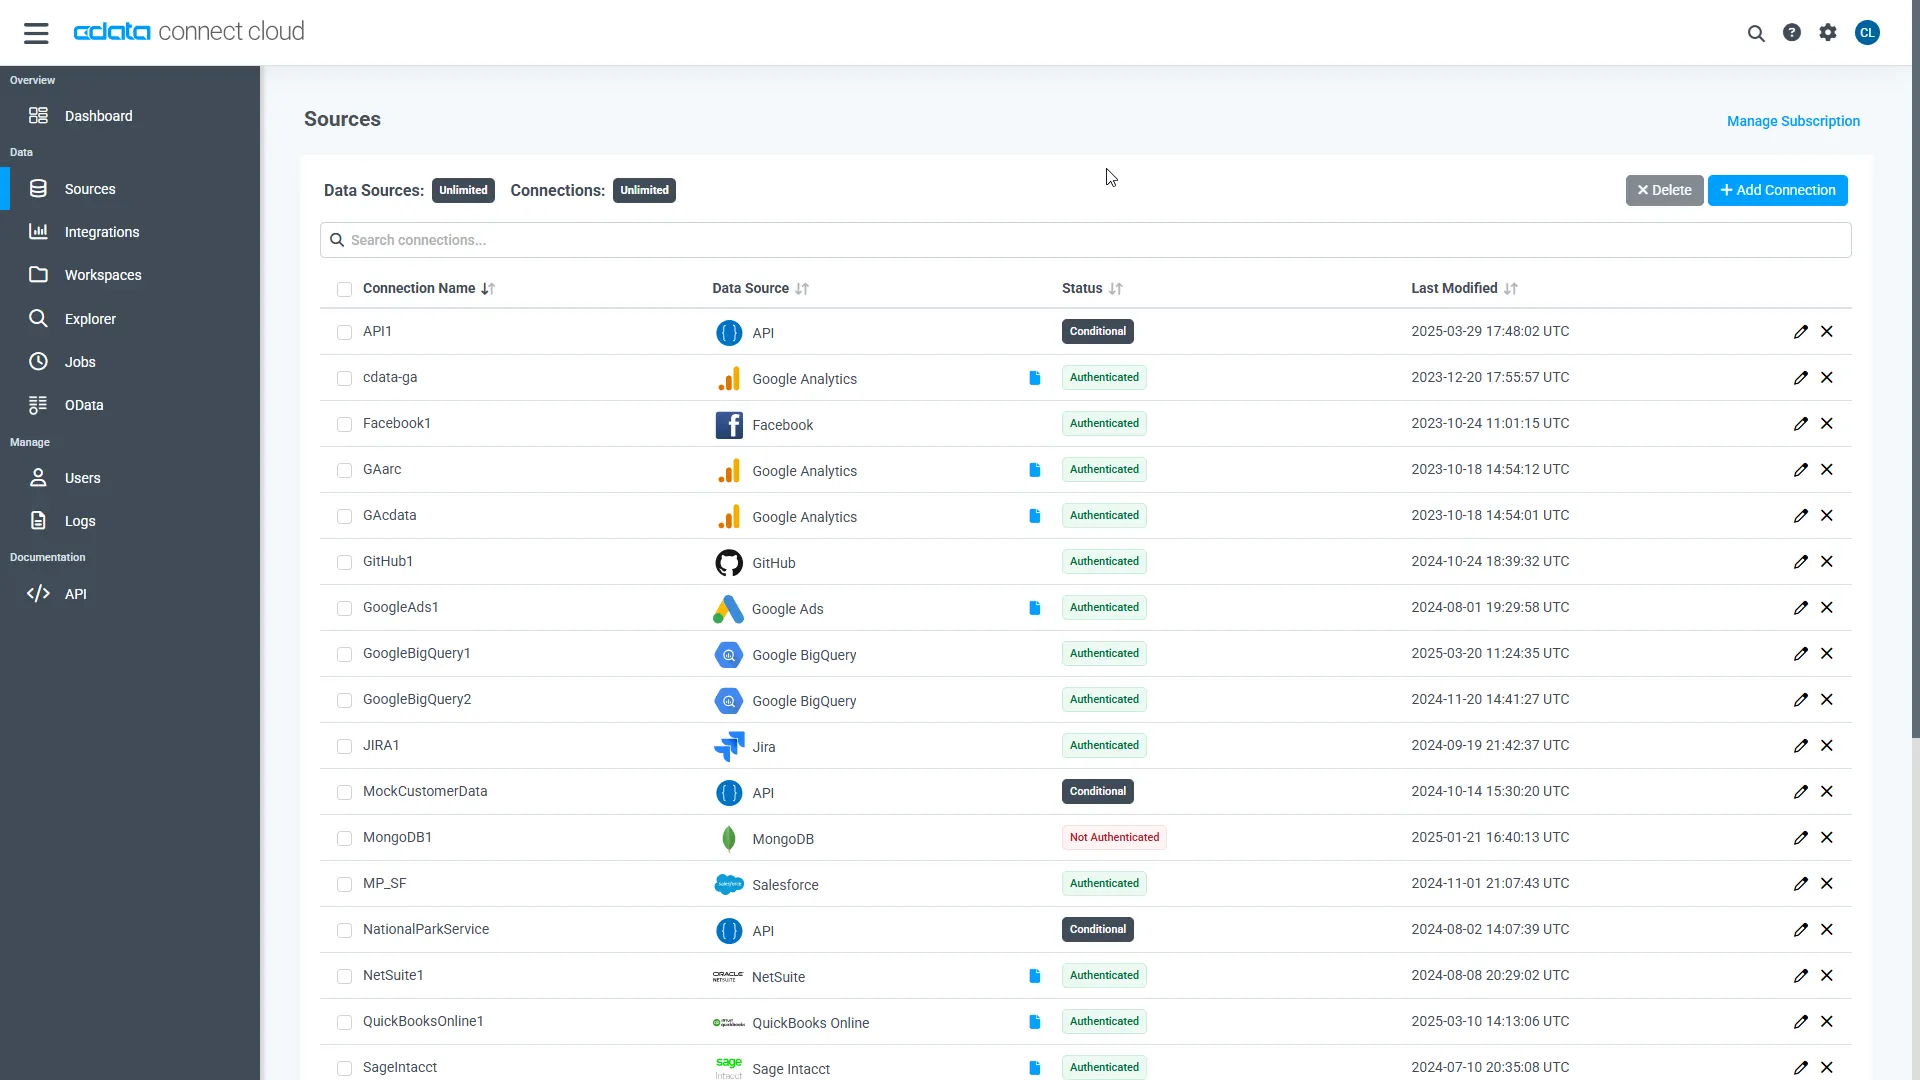
- Log into Connect AI, click Sources, and then click Add Connection
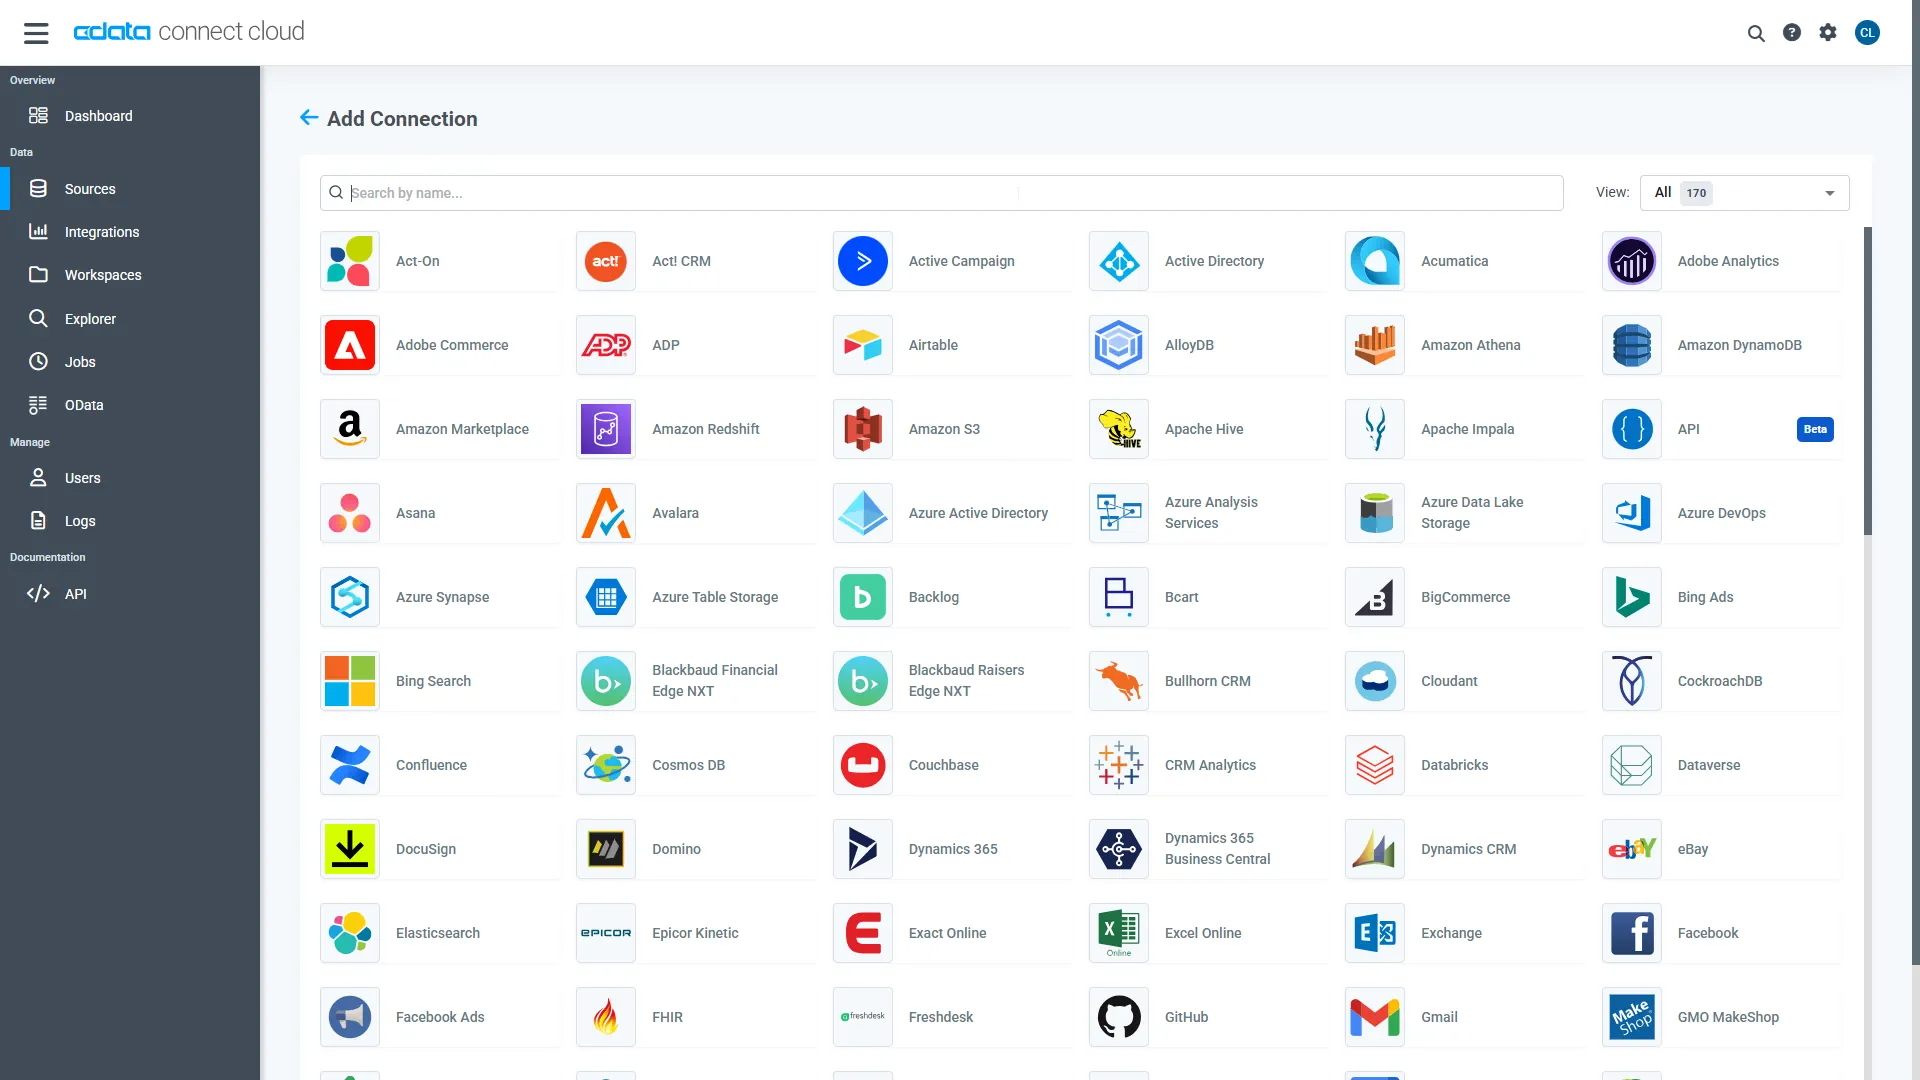
- Select "Printify" from the Add Connection panel
-
Enter the necessary authentication properties to connect to Printify.
Start by setting the Profile connection property to the location of the Printify Profile on disk (e.g. C:\profiles\Profile.apip). Next, set the ProfileSettings connection property to the connection string for Printify (see below).
Printify API Profile Settings
In order to authenticate to Printify, you'll need to provide your API Key. To get your API Key navigate to My Profile, then Connections. In the Connections section you will be able to generate your Personal Access Token (API Key) and set your Token Access Scopes. Personal Access Tokens are valid for one year. An expired Personal Access Token can be re-generated using the same steps after it expires. Set the API Key to your Personal Access Token in the ProfileSettings property to connect.
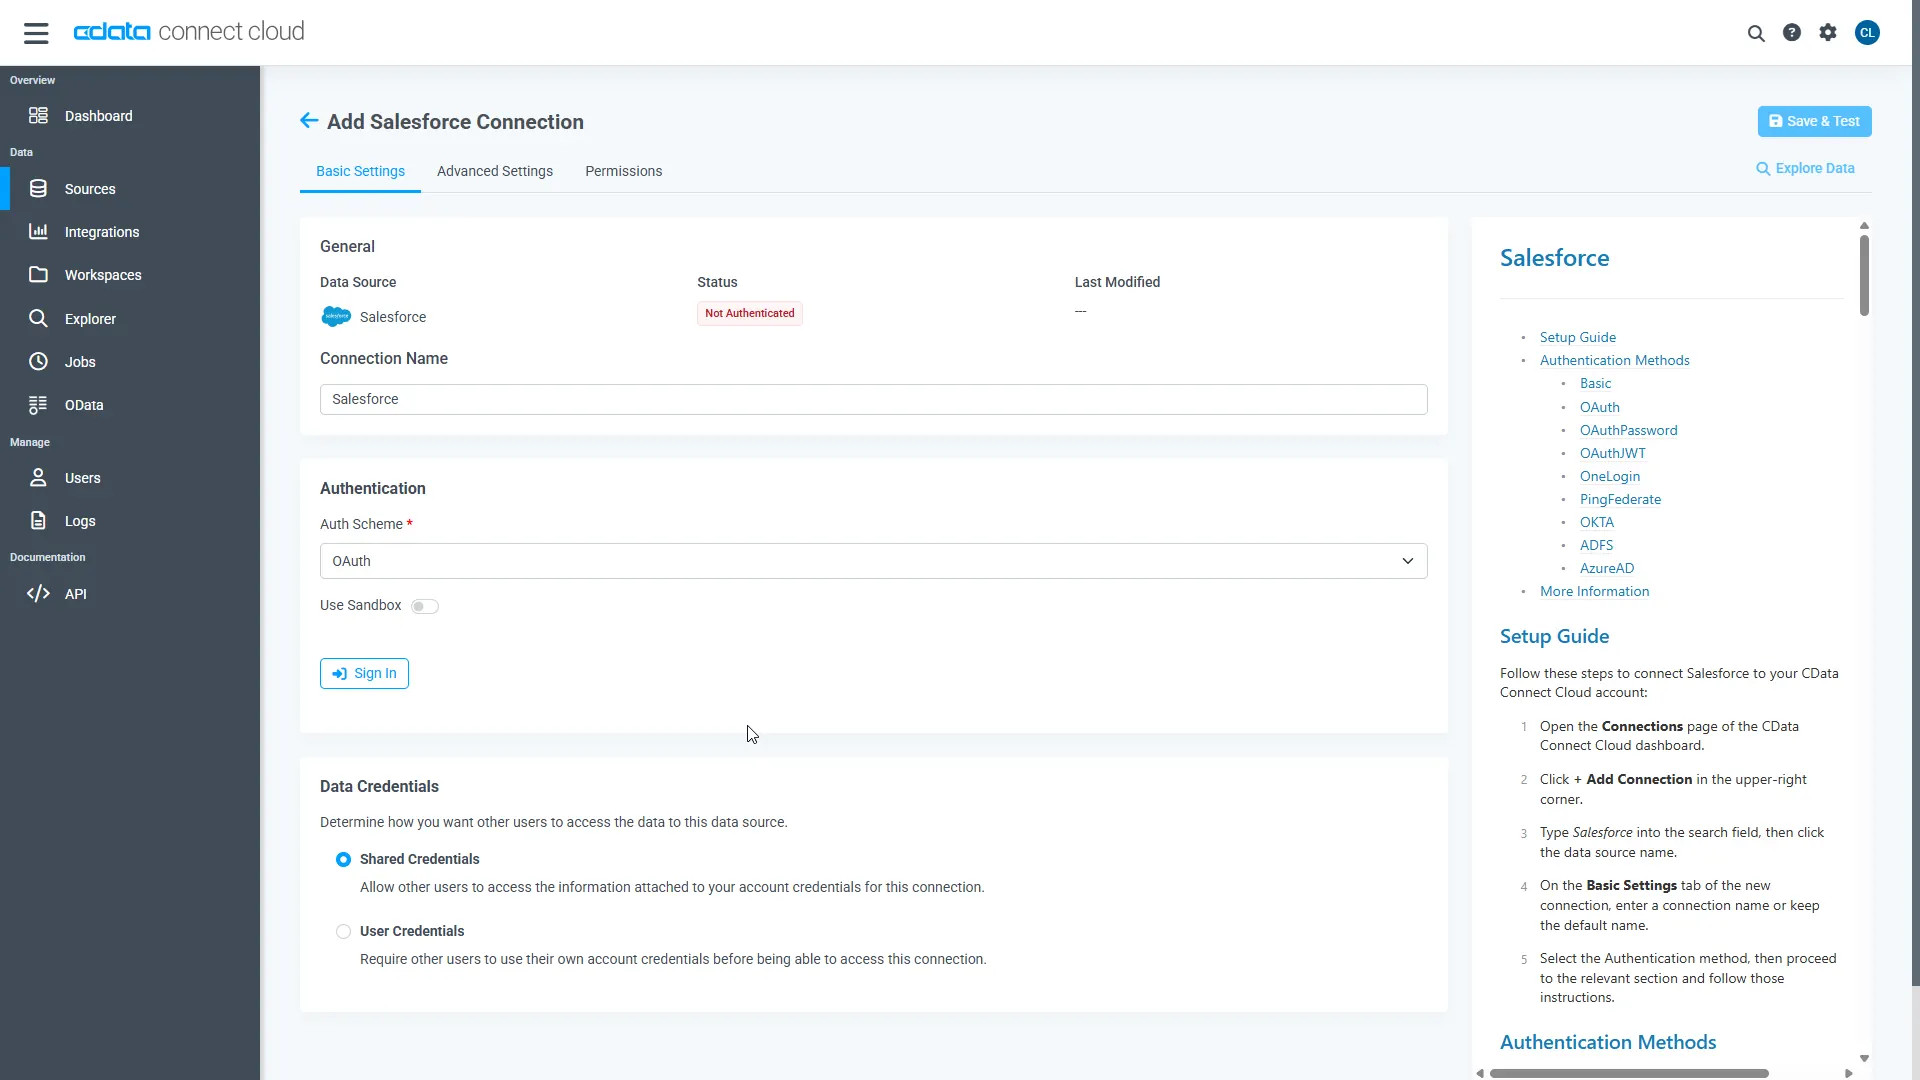
- Click Save & Test
-
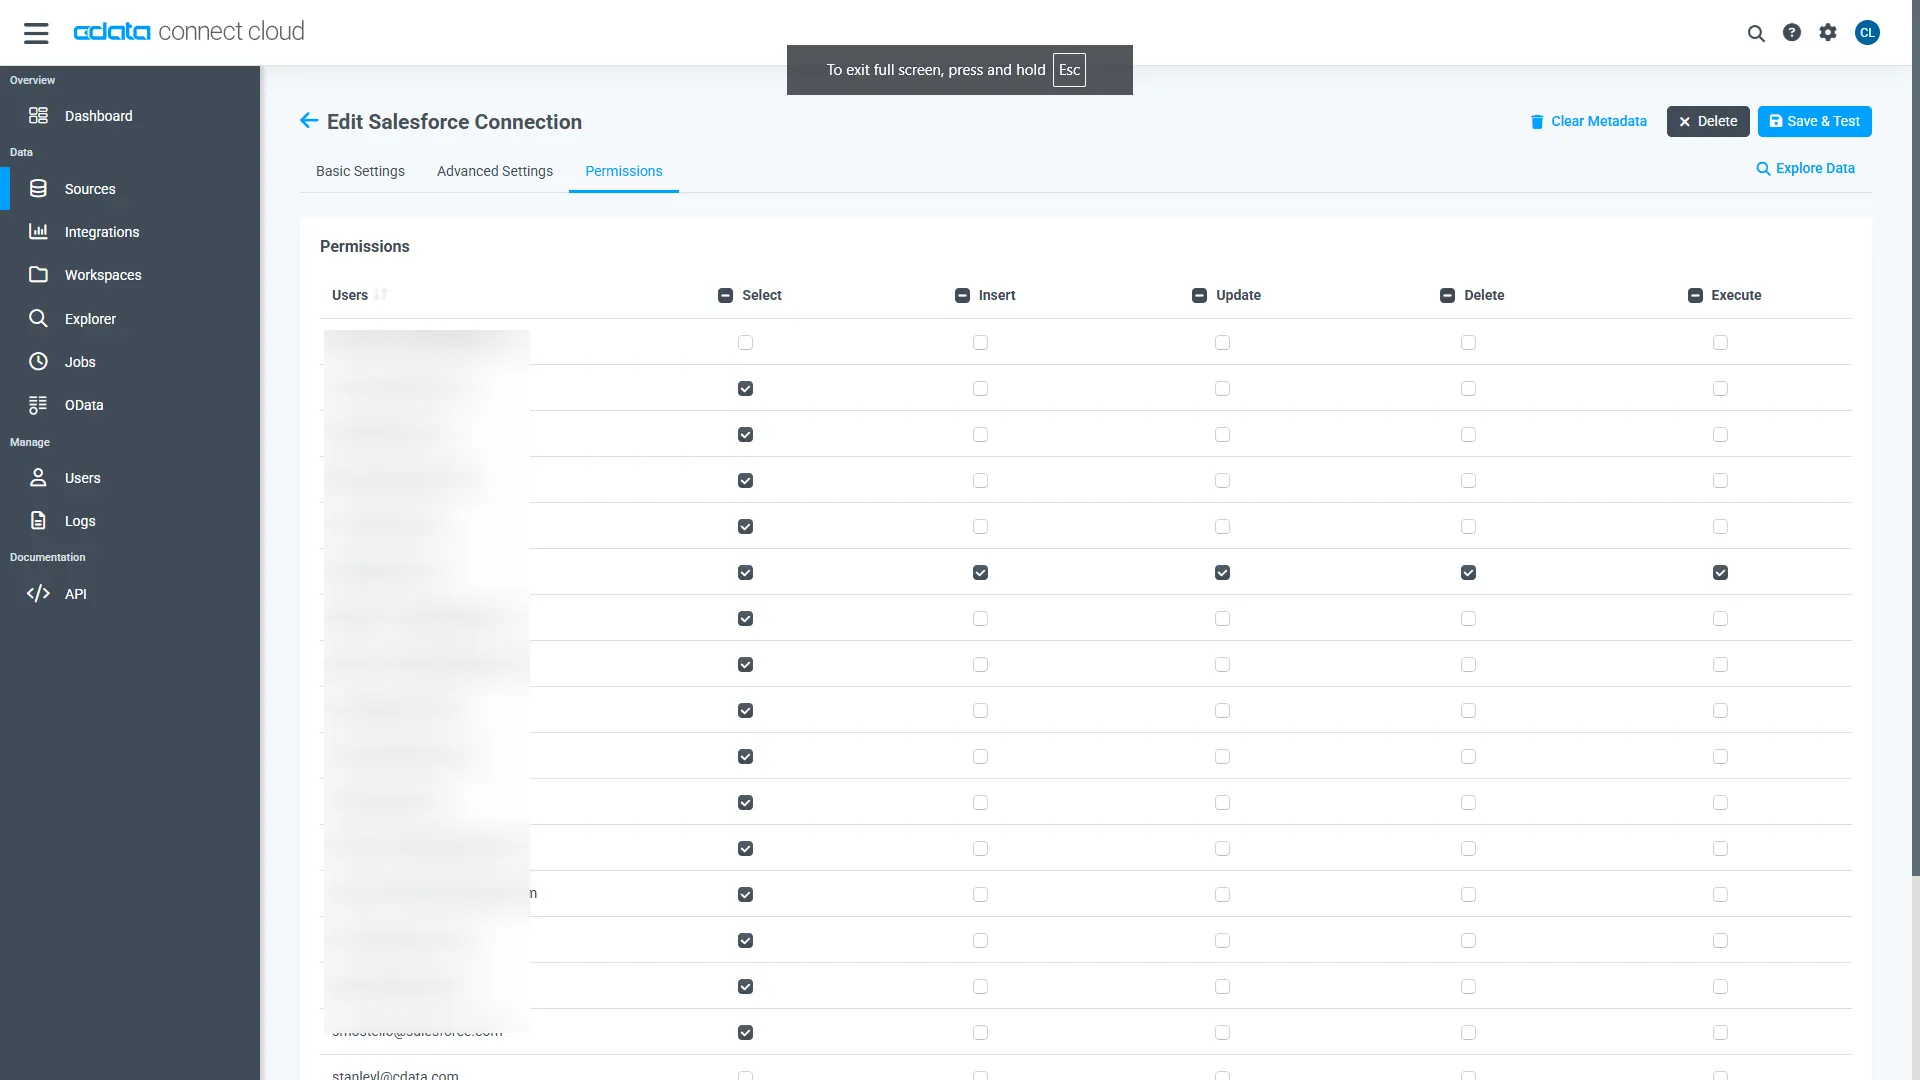
Navigate to the Permissions tab in the Add Printify Connection page and update the User-based permissions.
Add a Personal Access Token
When connecting to Connect AI through the REST API, the OData API, or the Virtual SQL Server, a Personal Access Token (PAT) is used to authenticate the connection to Connect AI. It is best practice to create a separate PAT for each service to maintain granularity of access.
- Click on the Gear icon () at the top right of the Connect AI app to open the settings page.
- On the Settings page, go to the Access Tokens section and click Create PAT.
-
Give the PAT a name and click Create.
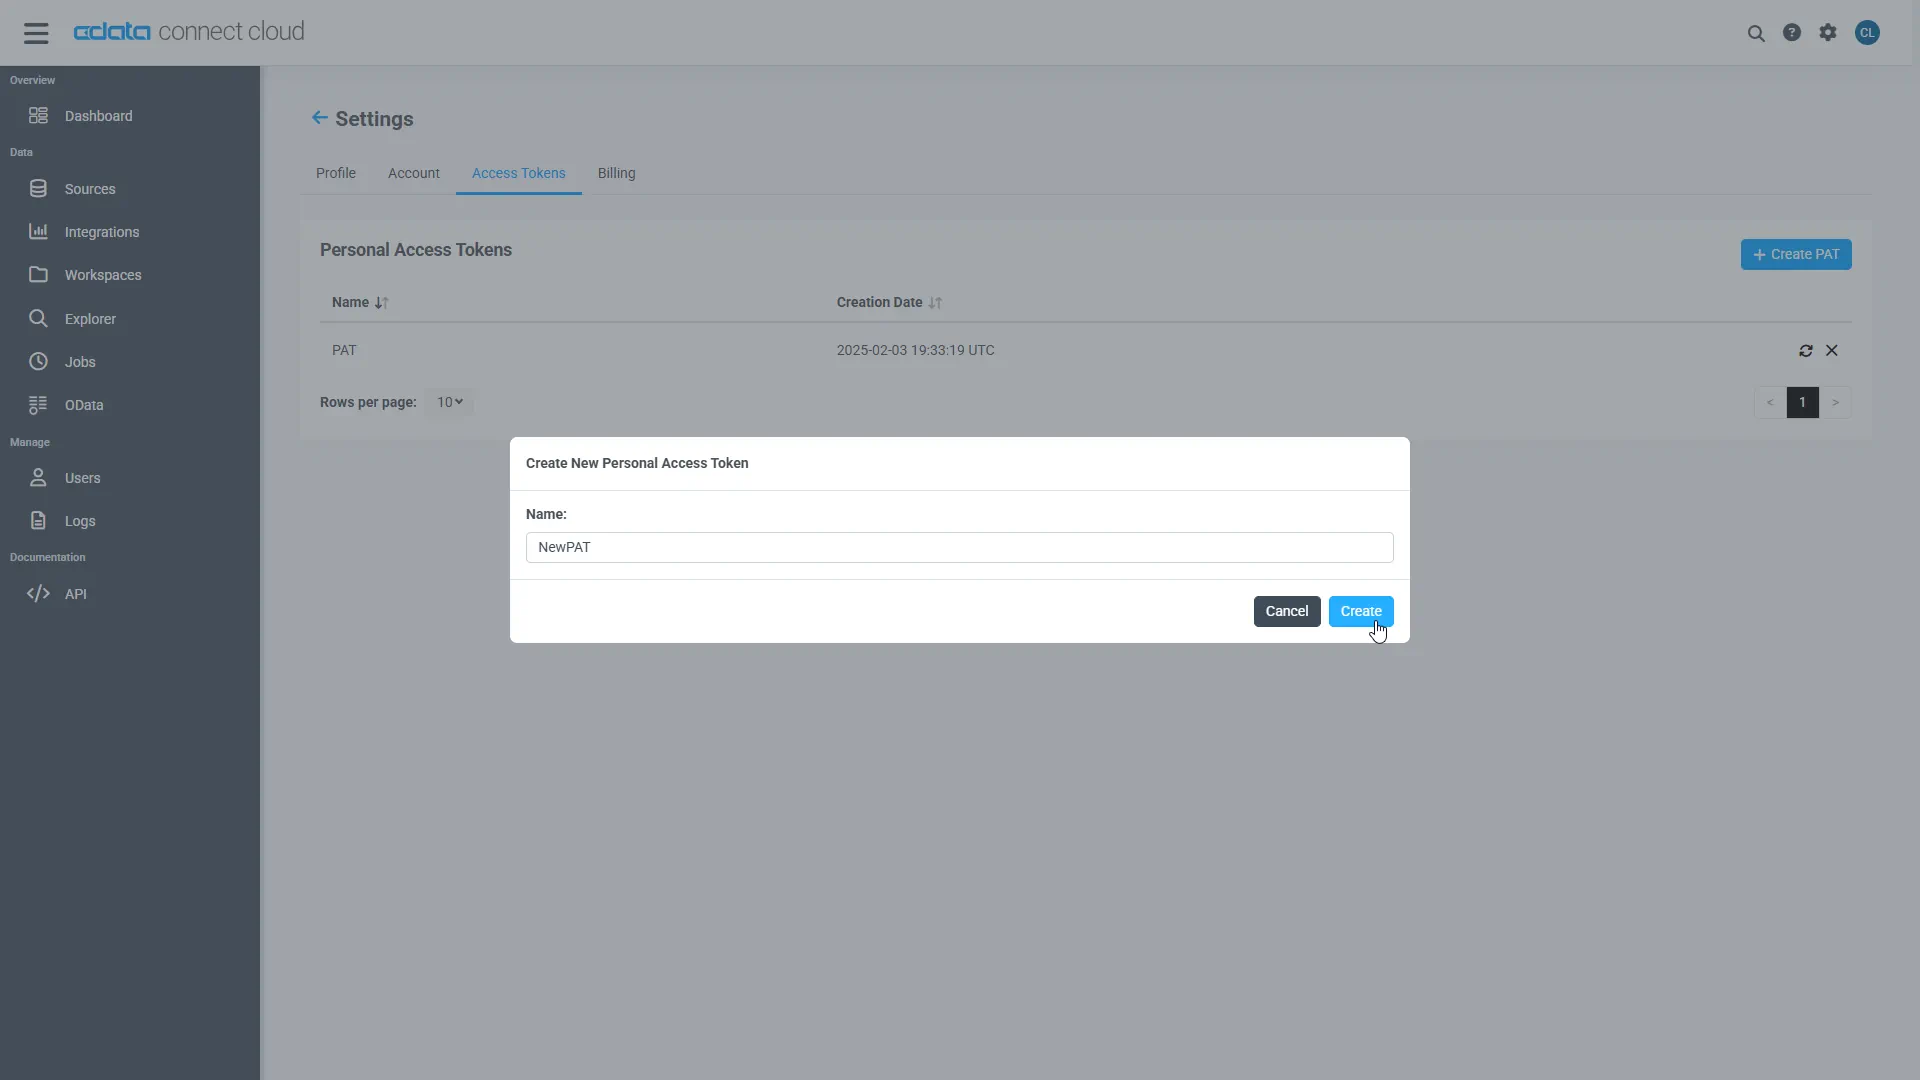
- The personal access token is only visible at creation, so be sure to copy it and store it securely for future use.
With the connection configured and a PAT generated, you are ready to connect to Printify data from Power BI.
Connecting to Connect AI from Power BI
To connect to and visualize live Printify data in the Power BI service, install the on-premise data gateway, add a data source to the gateway from the Power BI service, and publish a dataset from Power BI Desktop to the service.
Install the On-Premises Data Gateway
The Microsoft on-premise data gateway provides secure data transfer between connected data sources and various cloud-based Microsoft tools and platforms. You can read more about the gateway in the Microsoft documentation.
You can download and install the gateway from the Power BI service:
- Log in to PowerBI.com.
- Click the Download menu and click Data Gateway.
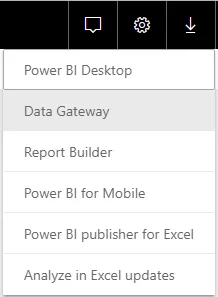
- Follow the instructions for installation, making note of the name of the gateway.
Add Printify as a Data Source to the Power BI Service
Once you have installed the data gateway, you add Connect AI as a data source to the Power BI service:
- Log in to PowerBI.com.
- Click the Settings menu and click "Manage gateways."
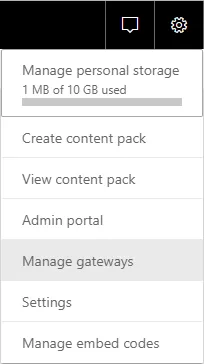
- Click "ADD DATA SOURCE" and configure the connection to Connect AI:
- Set Data Source Name to something like ConnectCloudAPI.
- Choose SQL Server as the Data Source Type.
- Set Server to tds.cdata.com,14333.
- Set Database to the name of your Printify connection (e.g. API1).
- Set Authentication Method to Basic.
- Set Username to a Connect AI user (e.g. [email protected])
- Set Password to the PAT for the user above.
Publish a Dataset from Power BI Desktop
With the gateway installed and Connect AI added as a datasource to the Power BI service, you can publish a dataset from Power BI Desktop to the service.
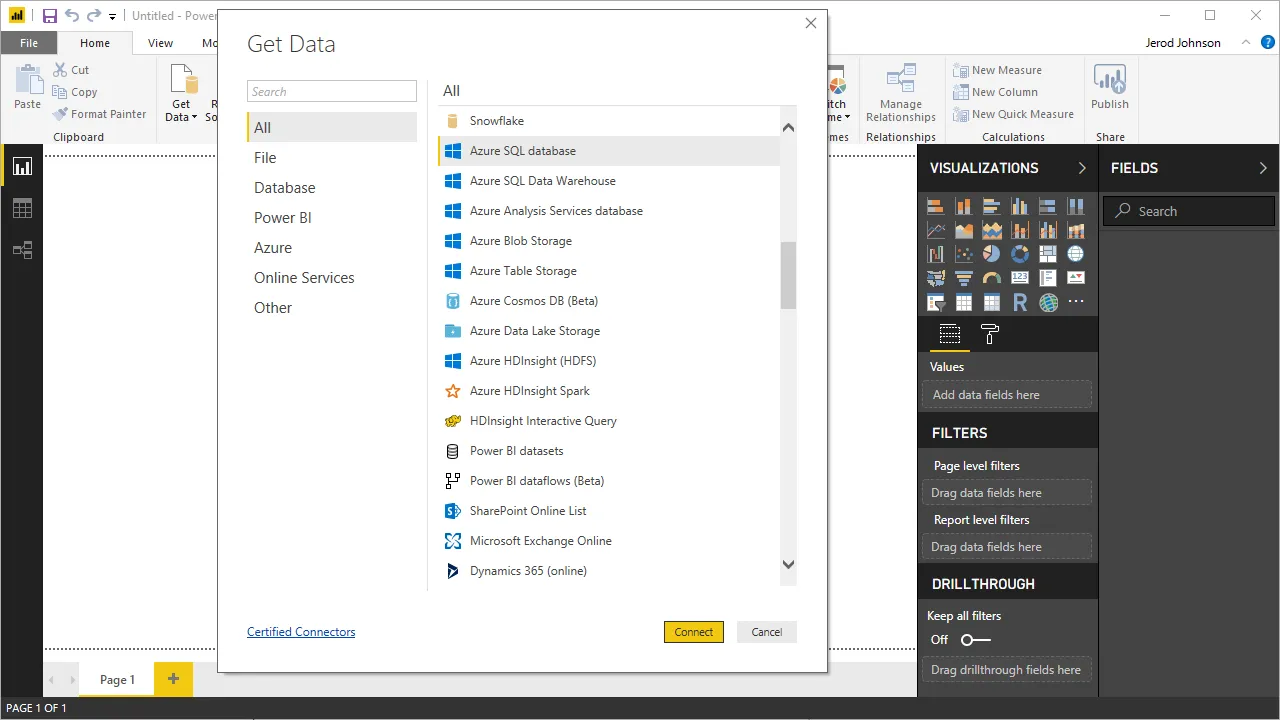
- Open Power BI, click Get Data -> More, then select SQL Server database, and click Connect.
- Set the connection properties and click OK.
- Set Server to tds.cdata.com,14333.
- Set Database to the name of your Printify connection (e.g. API1).
- Set Data Connectivity mode to DirectQuery*.
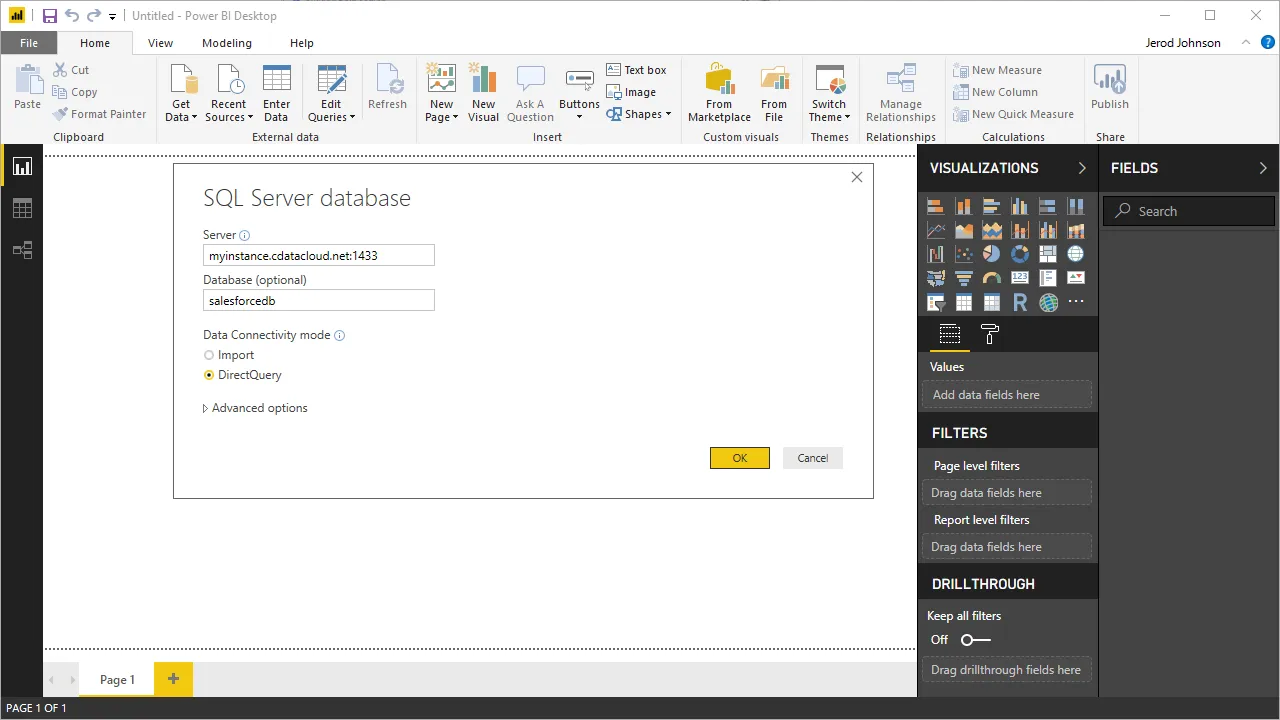 * DirectQuery enables live query processing and real-time visualizations of Printify data.
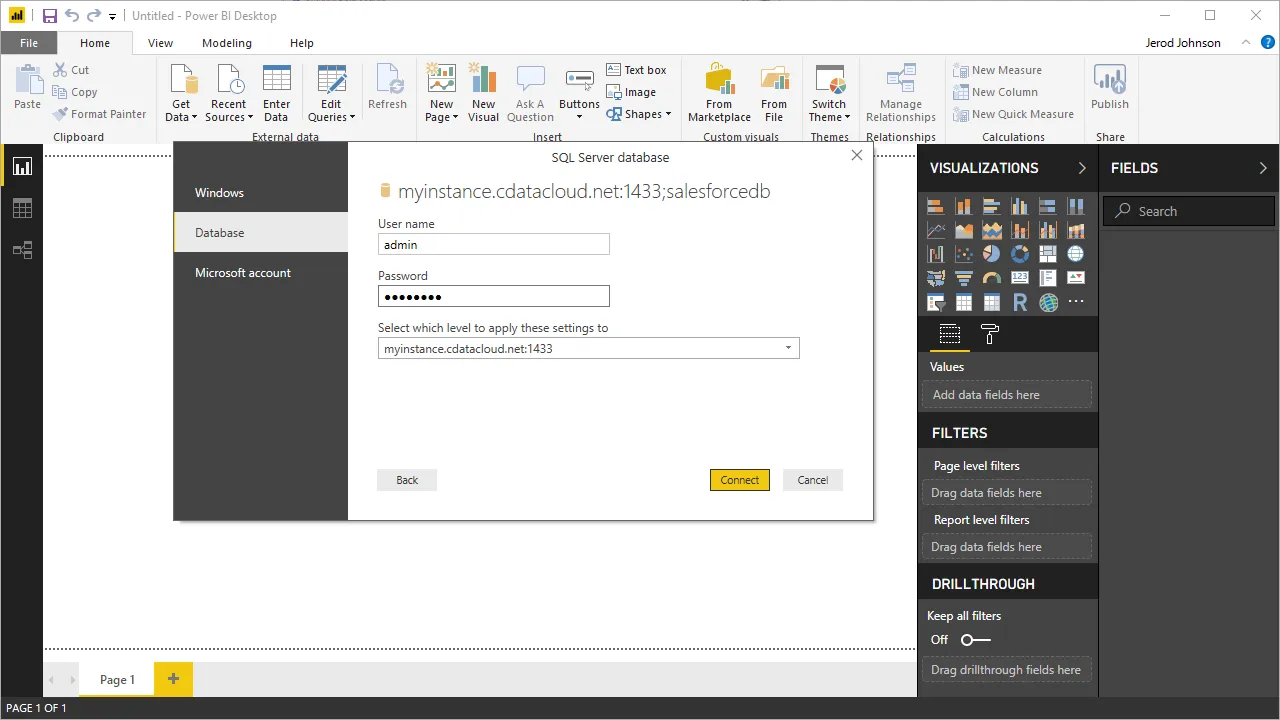
- In the authentication wizard, select Database, set the User name and Password properties, and click Connect.
- Select the table(s) to visualize in the Navigator dialog.
- In the Query Editor, you can customize your dataset by filtering, sorting, and summarizing Printify columns. Click Edit to open the query editor. Right-click a raw to filter the rows. Right-click a column header to perform options like the following:
- Change column data types
- Remove a column
- Group by columns
Power BI detects each column's data type from the Printify metadata reported by Connect AI.
Power BI records your modifications to the query in the Applied Steps section, adjusting the underlying data retrieval query that is executed to the remote Printify data. When you click Close and Apply, Power BI executes the data Retrieval query.
Otherwise, click Load to pull the data into Power BI.
- Define any relationships between the selected entities on the Relationships tab.
- Click Publish (from the Home menu) and select a Workspace.
Build Reports and Dashboards on Printify Data in the Power BI Service
Now that you have published a dataset to the Power BI service, you can create new reports and dashboards based on the published data:
- Log in to PowerBI.com.
- Click Workspaces and select a workspace.
- Click Create and select Report.
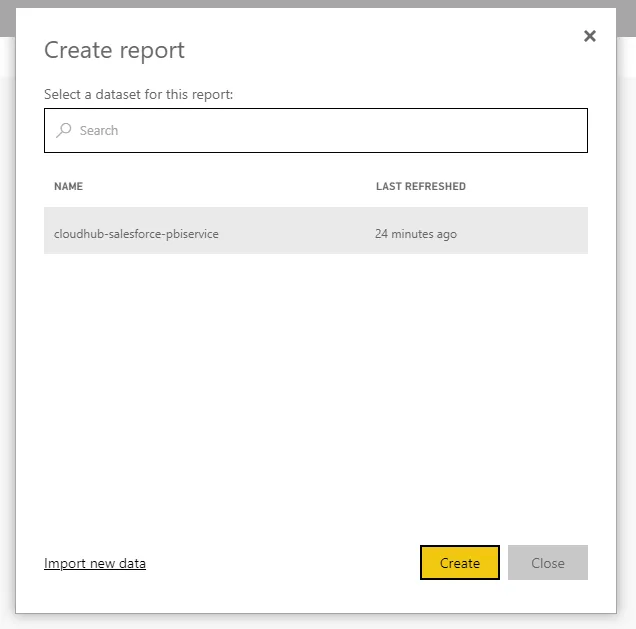
- Select the published dataset for the report.
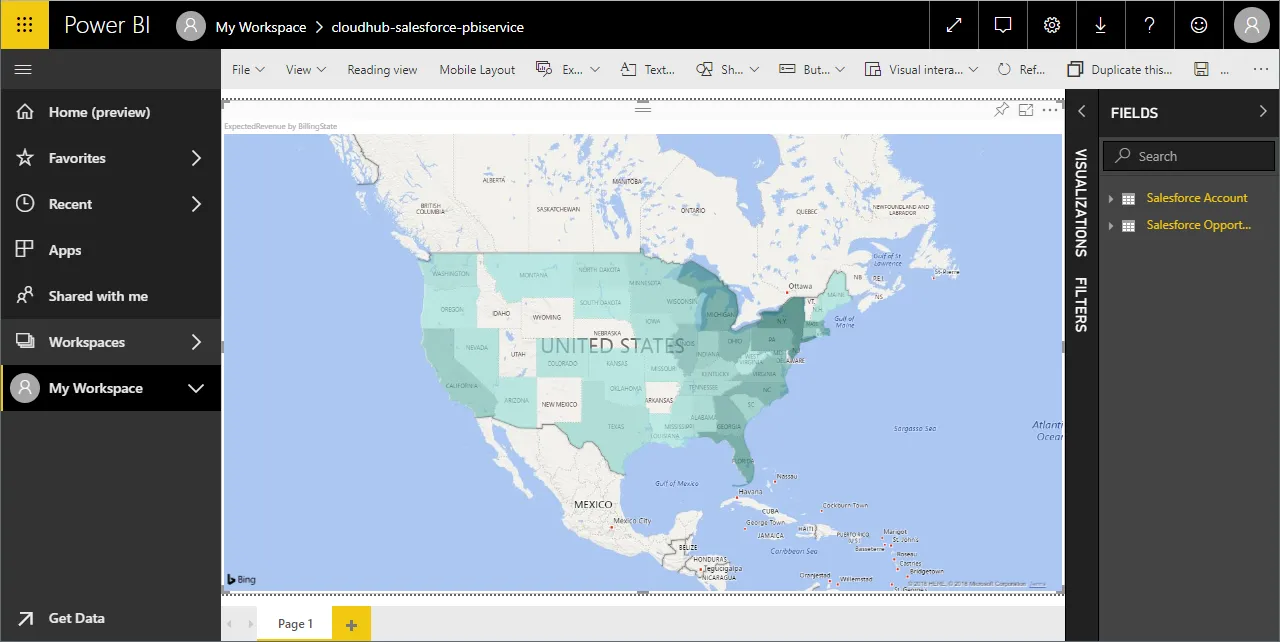
- Choose fields and visualizations to add to your report.
Live Access to Printify Data from Cloud Applications
Now you have a direct connection to live Printify data from the Power BI service. You can create more data sources and new visualizations, build reports, and more — all without replicating Printify data.
To get live data access to hundreds of SaaS, Big Data, and NoSQL sources directly from your cloud applications, sign up for a free trial of CData Connect AI.