








Create RSS-Connected Visualizations in Klipfolio

Klipfolio is an online dashboard platform designed to create real-time business dashboards, whether for your team or clients. When combined with CData Connect AI, you gain immediate cloud-to-cloud access to RSS feeds to create visualizations, reports, and more. This article provides step-by-step instructions on connecting to RSS within Connect AI and creating visualizations using RSS feeds in Klipfolio.
CData Connect AI offers a direct cloud-to-cloud interface for RSS, enabling you to construct reports from real-time RSS feeds data within Klipfolio—without the need for data replication to a database natively supported by Klipfolio. While building visualizations, Klipfolio generates SQL queries to fetch data. With optimized data processing capabilities out of the box, CData Connect AI efficiently directs all supported SQL operations (such as filters, JOINs, etc.) directly to RSS, harnessing server-side processing to swiftly retrieve the requested RSS feeds data.
Configure RSS Connectivity for Klipfolio
Connectivity to RSS from Klipfolio is made possible through CData Connect AI. To work with RSS feeds from Klipfolio, we start by creating and configuring a RSS connection.
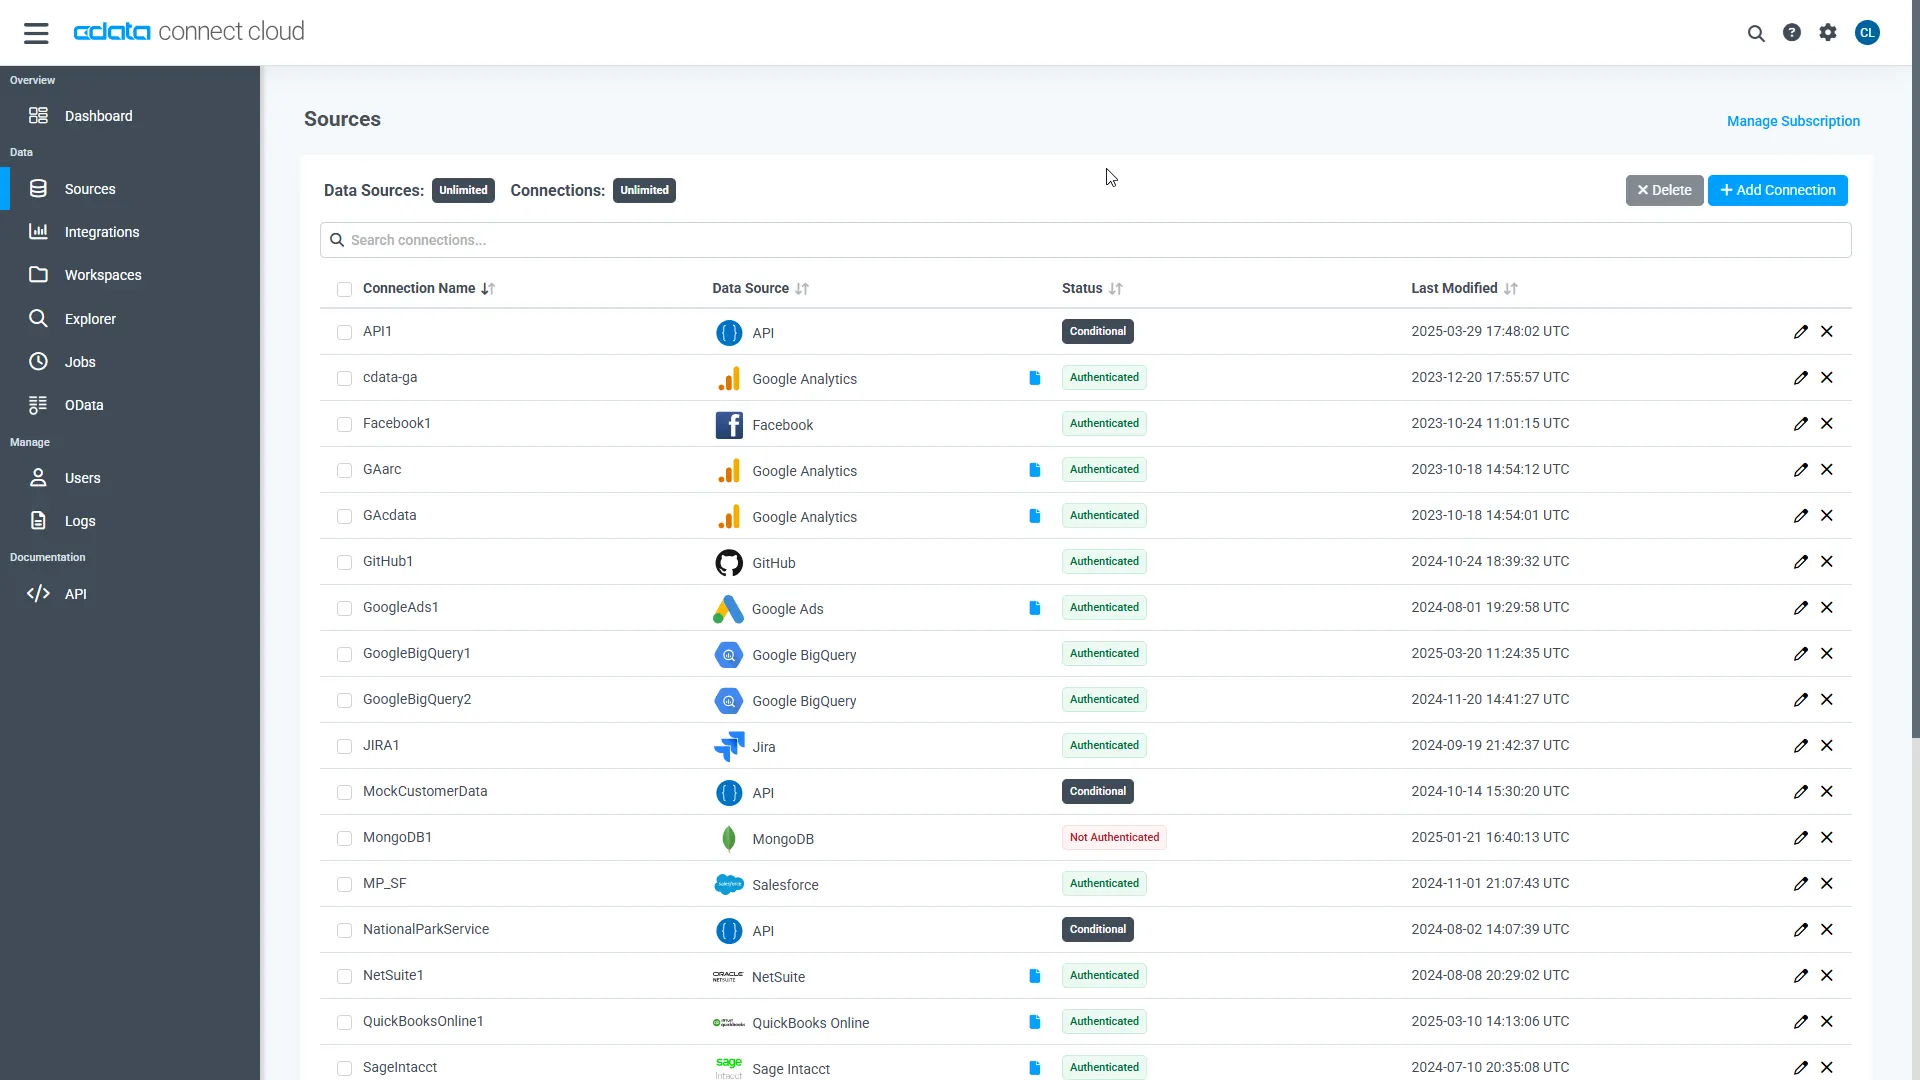
- Log into Connect AI, click Sources, and then click Add Connection
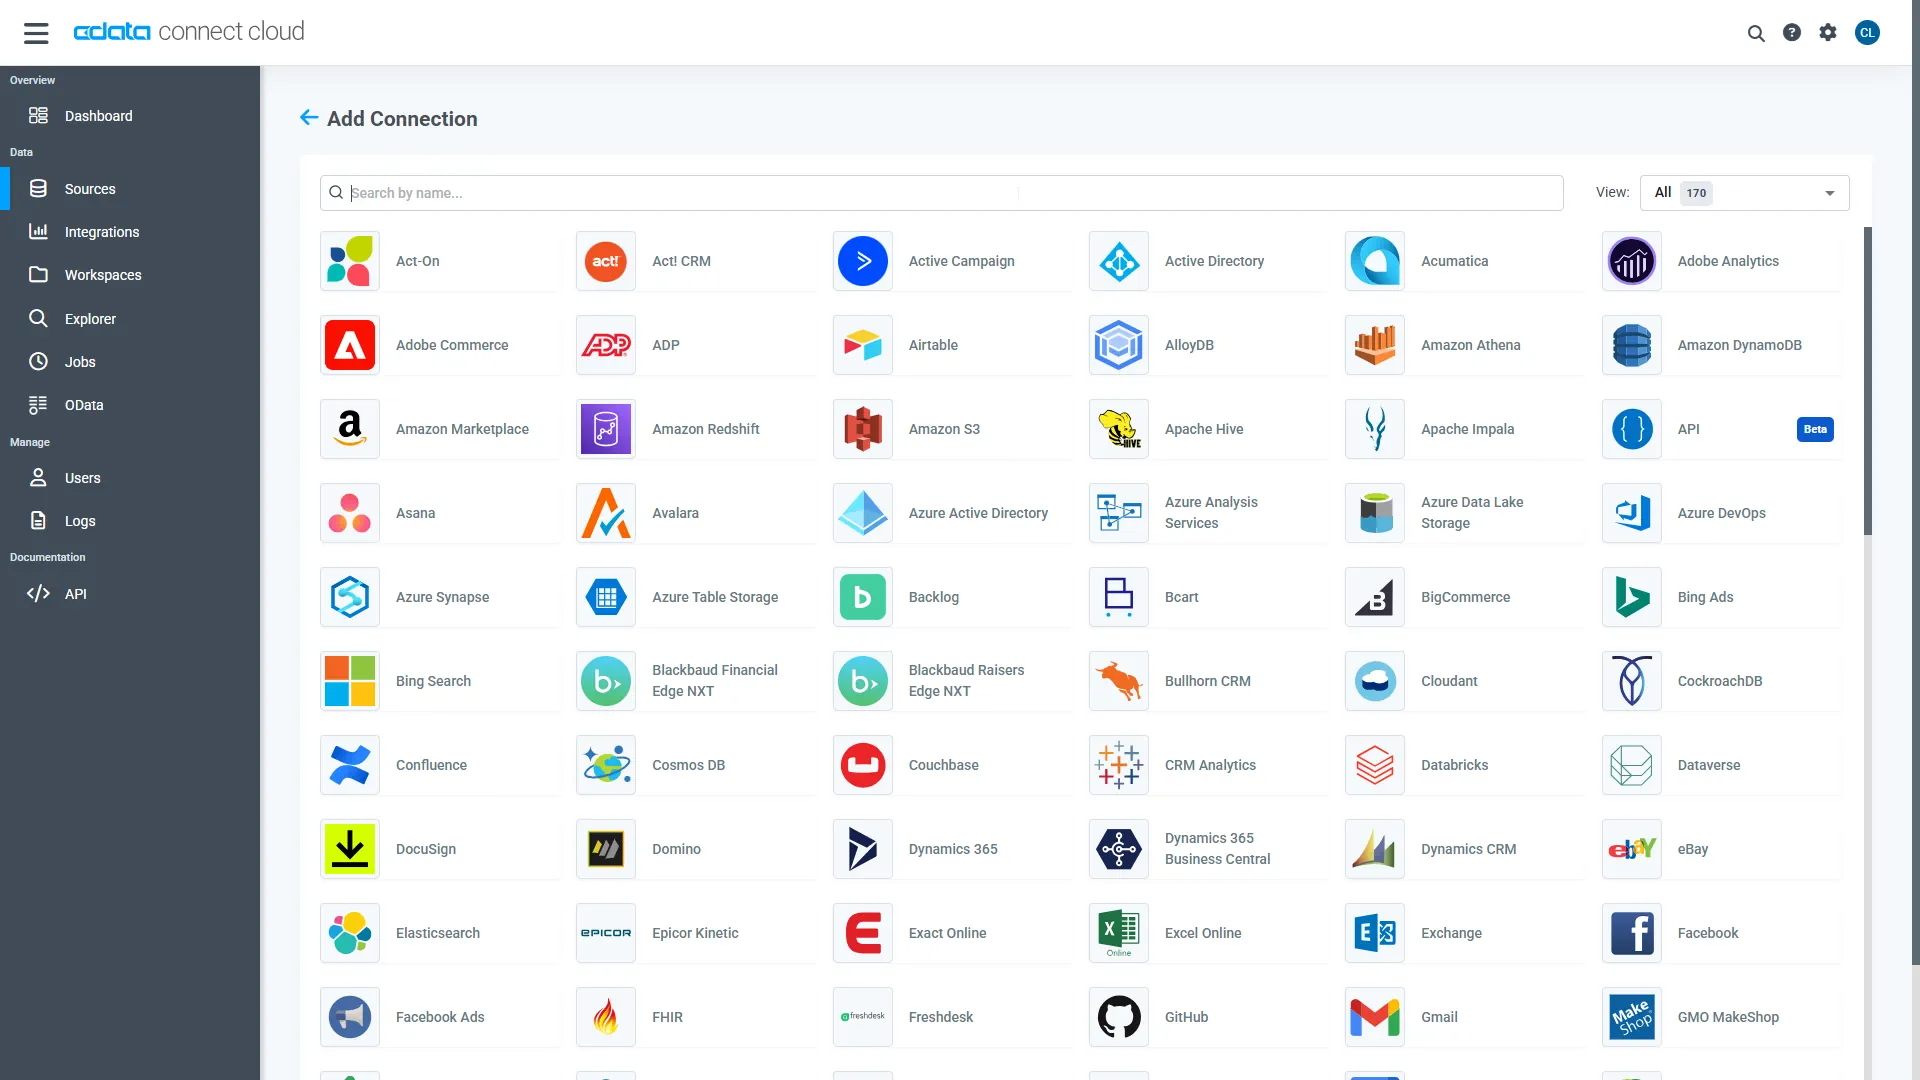
- Select "RSS" from the Add Connection panel
-
Enter the necessary authentication properties to connect to RSS.
You can connect to RSS and Atom feeds, as well as feeds with custom extensions. To connect to a feed, set the URL property. You can also access secure feeds. A variety of authentication mechanisms are supported. See the help documentation for details.
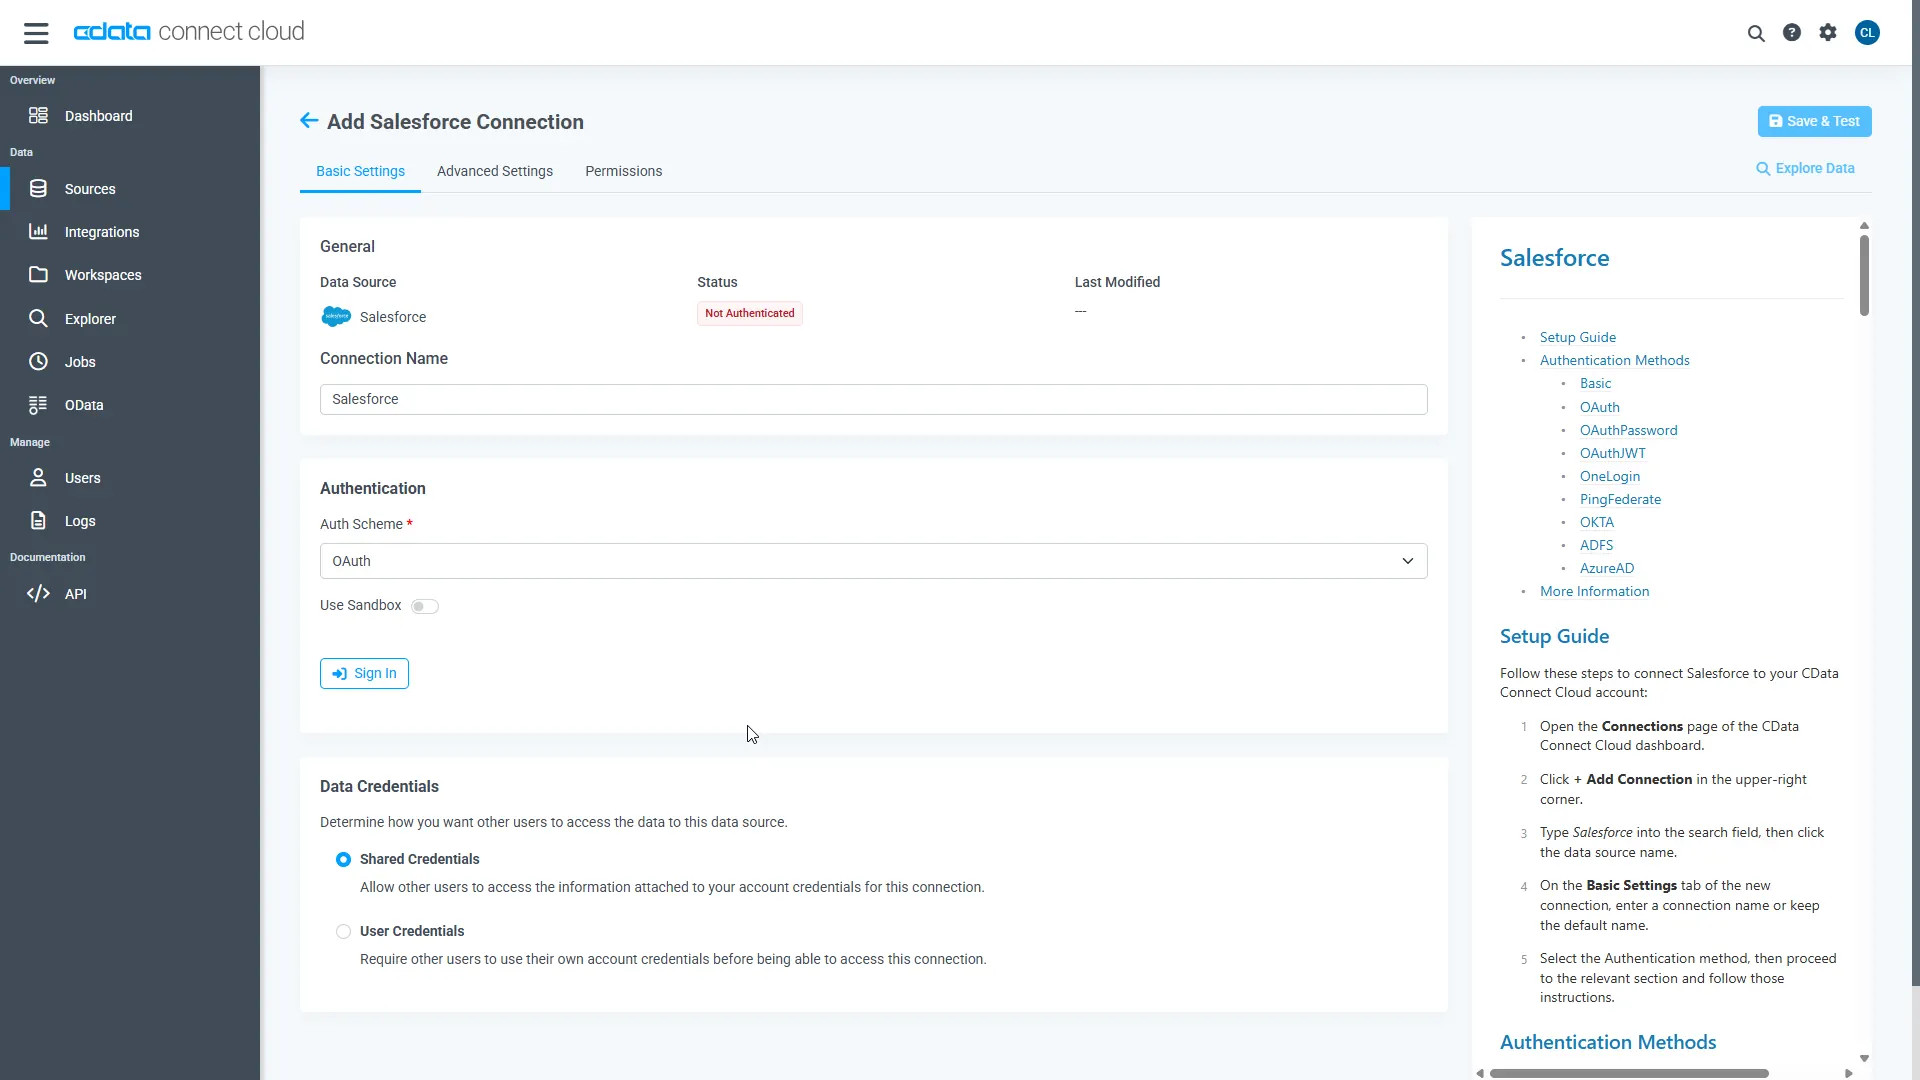
- Click Save & Test
-
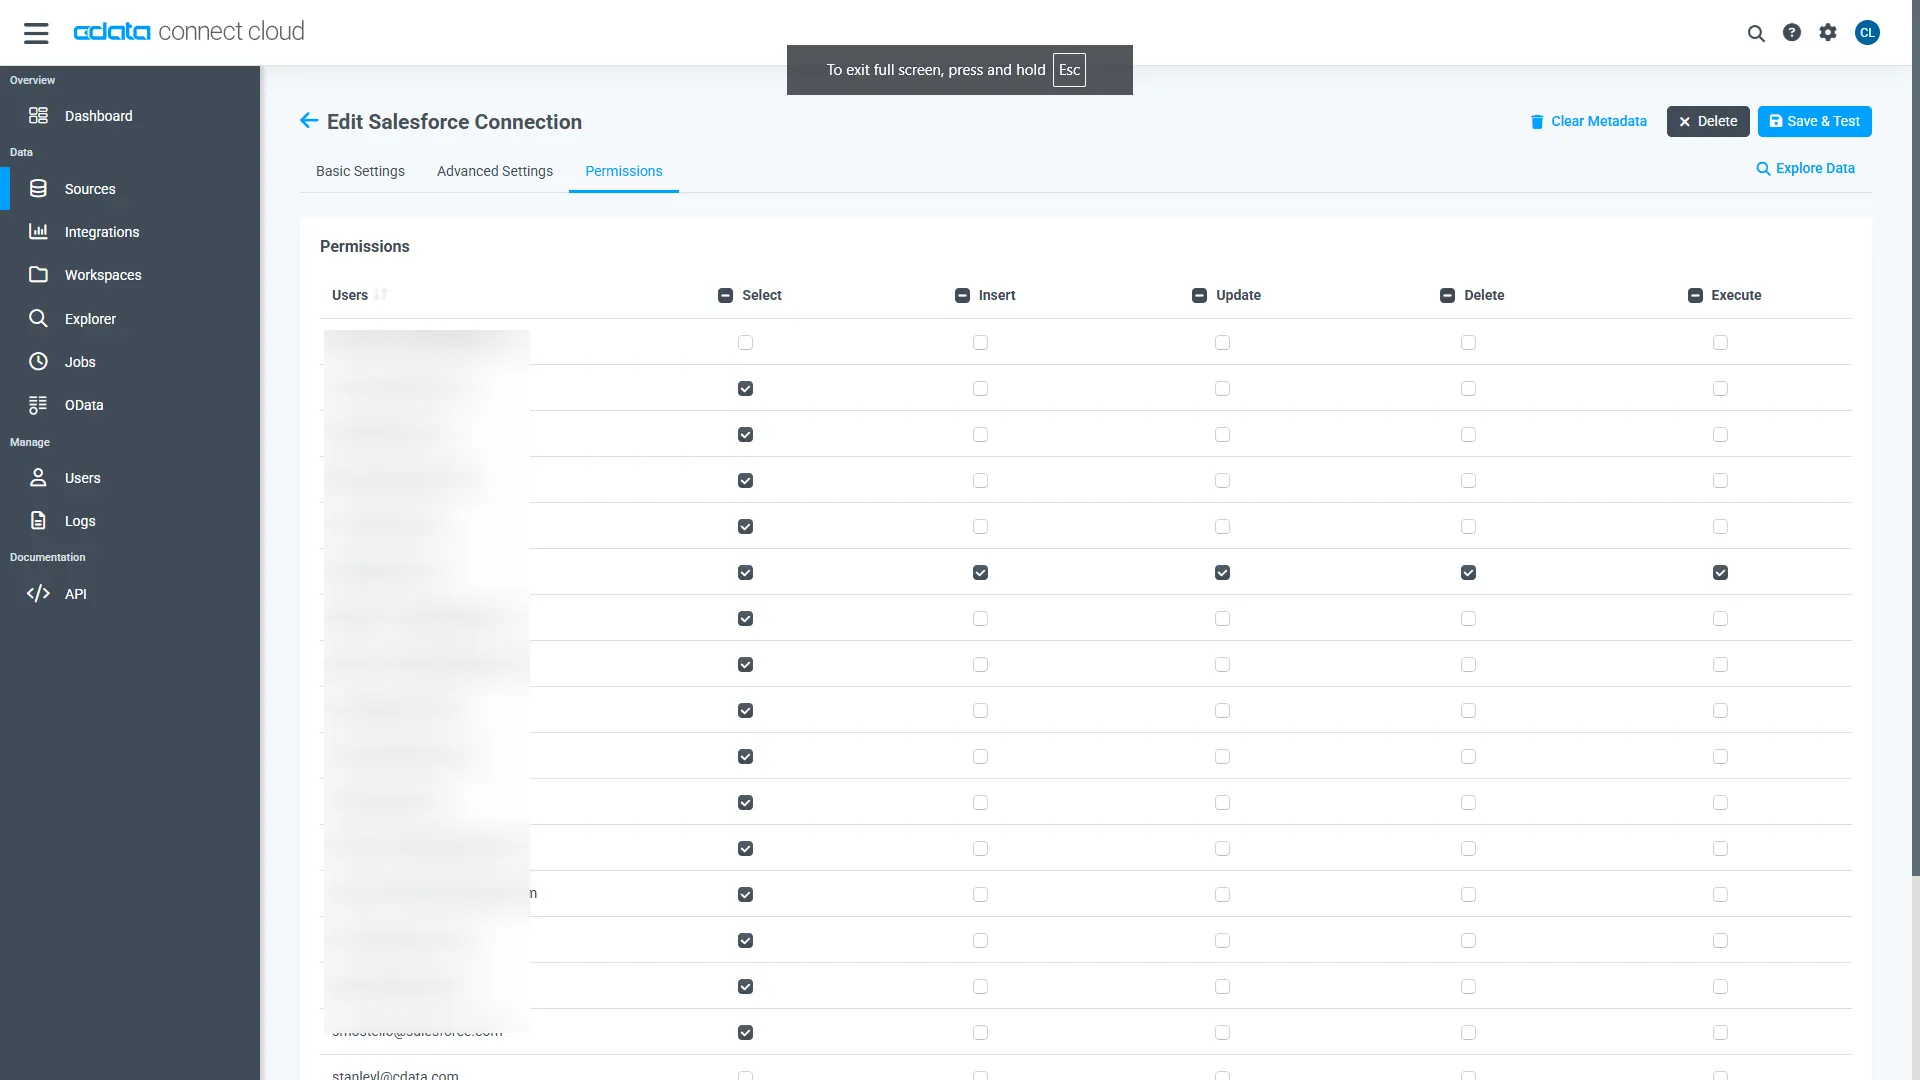
Navigate to the Permissions tab in the Add RSS Connection page and update the User-based permissions.
Add a Personal Access Token
When connecting to Connect AI through the REST API, the OData API, or the Virtual SQL Server, a Personal Access Token (PAT) is used to authenticate the connection to Connect AI. It is best practice to create a separate PAT for each service to maintain granularity of access.
- Click on the Gear icon () at the top right of the Connect AI app to open the settings page.
- On the Settings page, go to the Access Tokens section and click Create PAT.
-
Give the PAT a name and click Create.
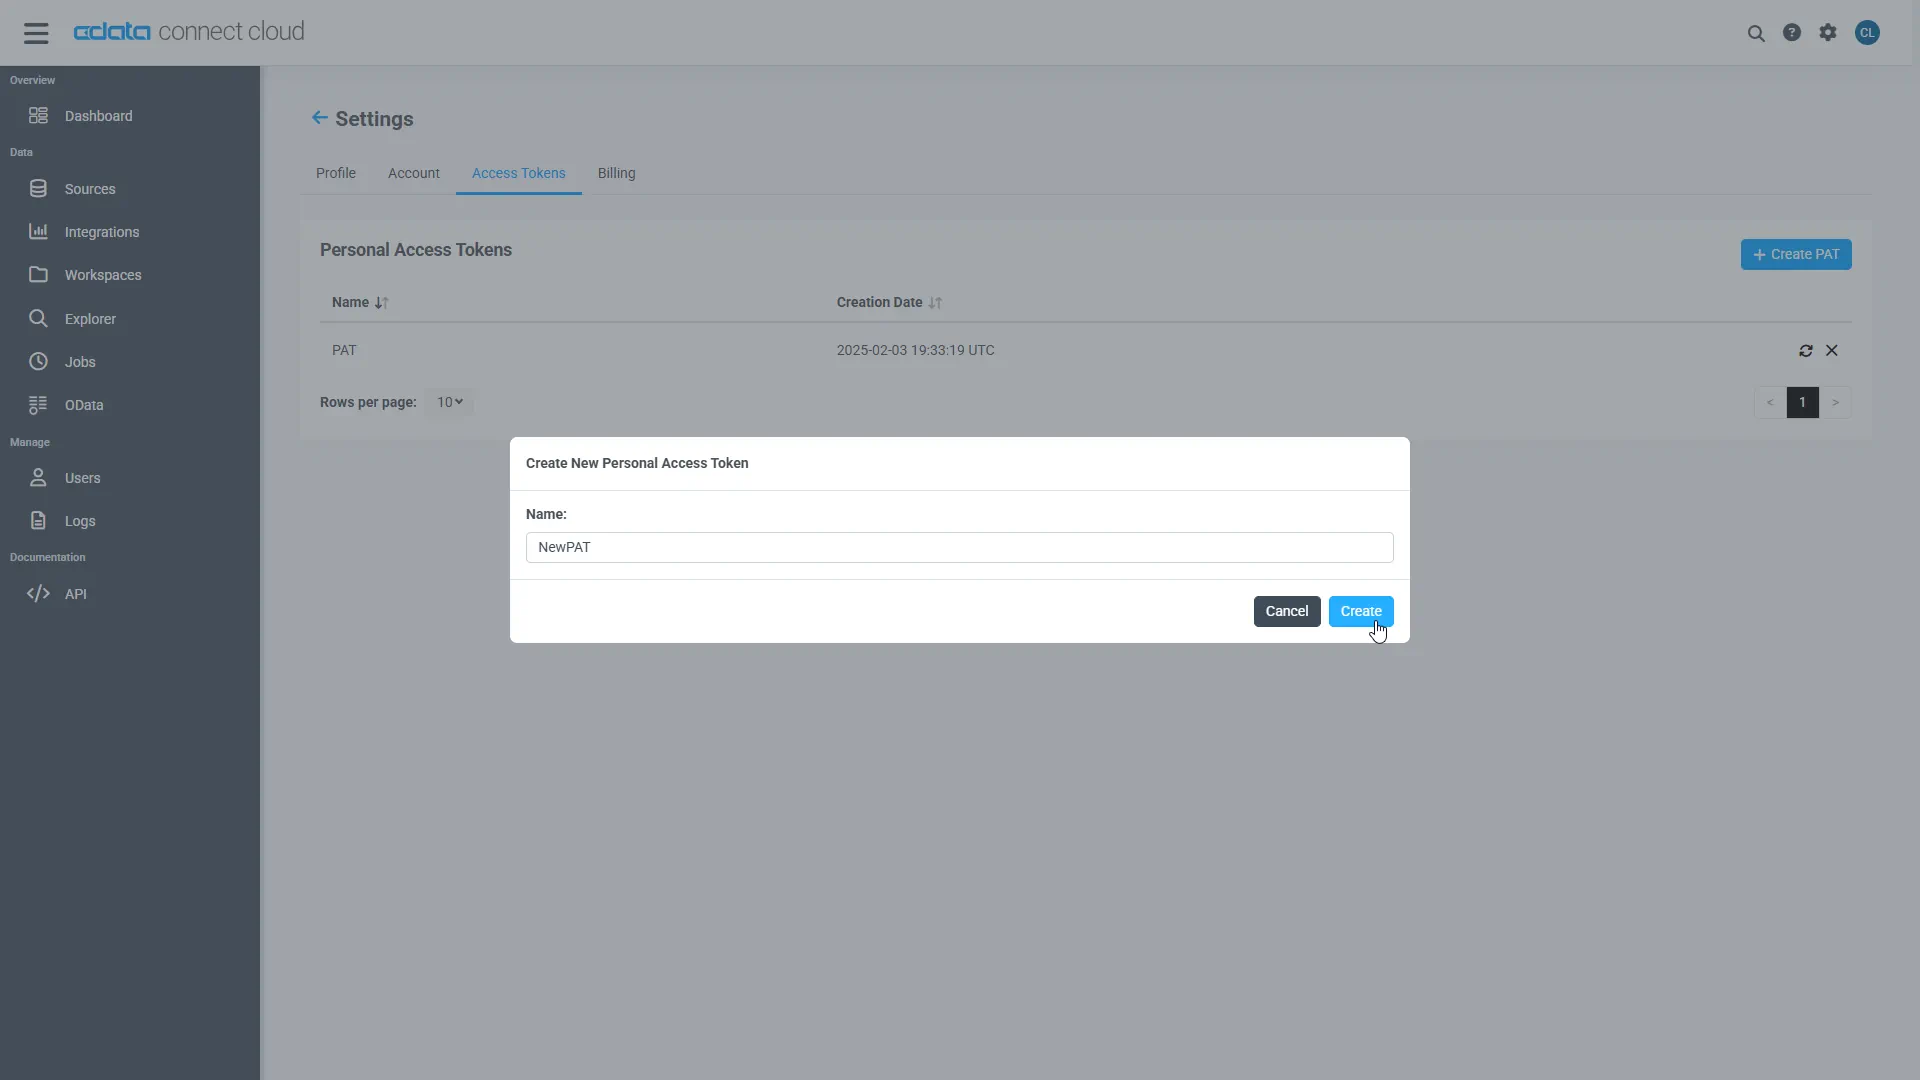
- The personal access token is only visible at creation, so be sure to copy it and store it securely for future use.
With the connection configured and a PAT generated, you are ready to connect to RSS feeds from Klipfolio.
Connect to RSS from Klipfolio
The steps below outline connecting to CData Connect AI from Klipfolio to create a new RSS data source.
- Open Klipfolio
- Click in Data Sources to add a new data source
- Search for and select MSSQL as the Service
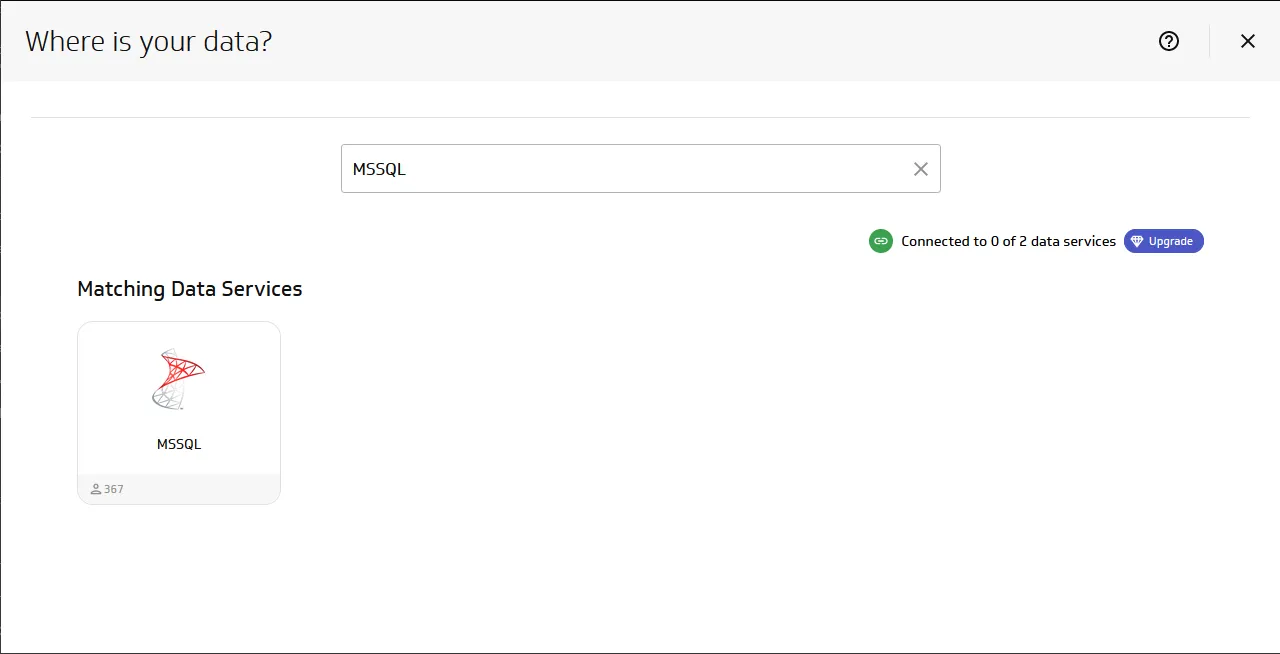
- Click "Create a custom MSSQL data source"
- Configure the data source by setting the MSSQL connection properties:
- Host: tds.cdata.com
- Port: 14333
- Database: your database (e.g., RSS1)
- Driver: MS SQL
- Username: a Connect AI user (e.g. [email protected])
- Password: the above user's PAT
- SQL Query: any query to retrieve data (e.g. SELECT * FROM Latest News )
- Select the checkbox to "Include column headers"
- Select the checkbox to "Use SSL/TLS"
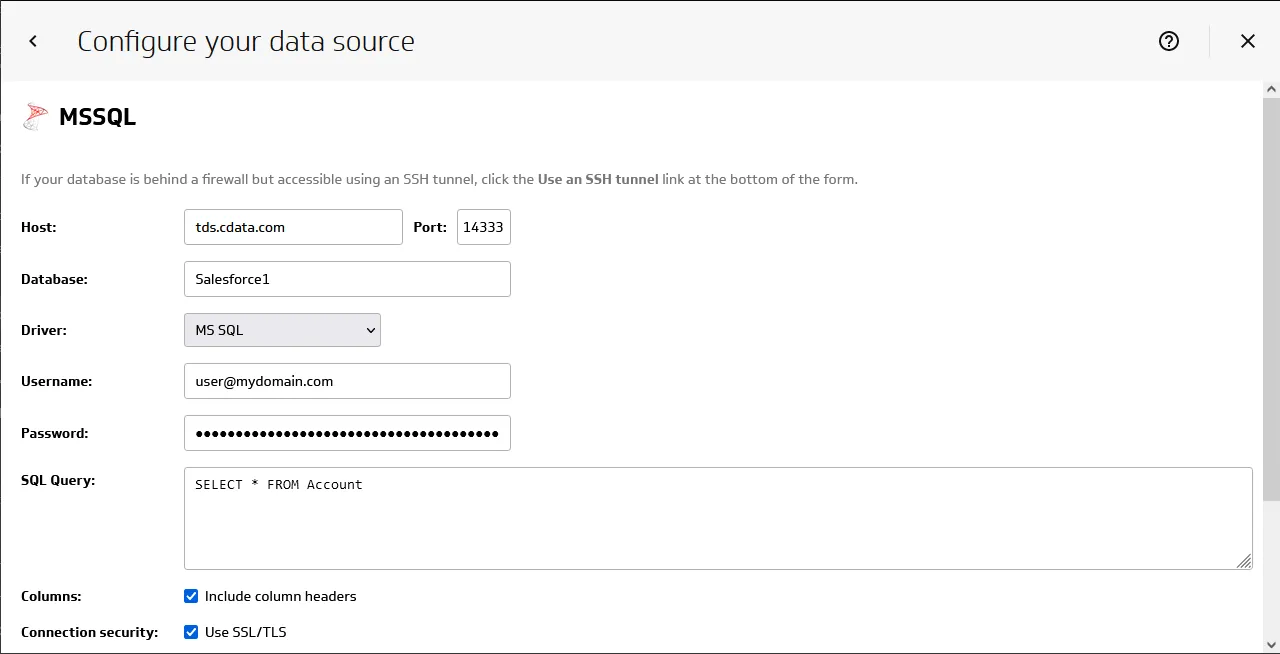
- Click "Get data" to preview the RSS feeds before building a data model.
Build a Data Model
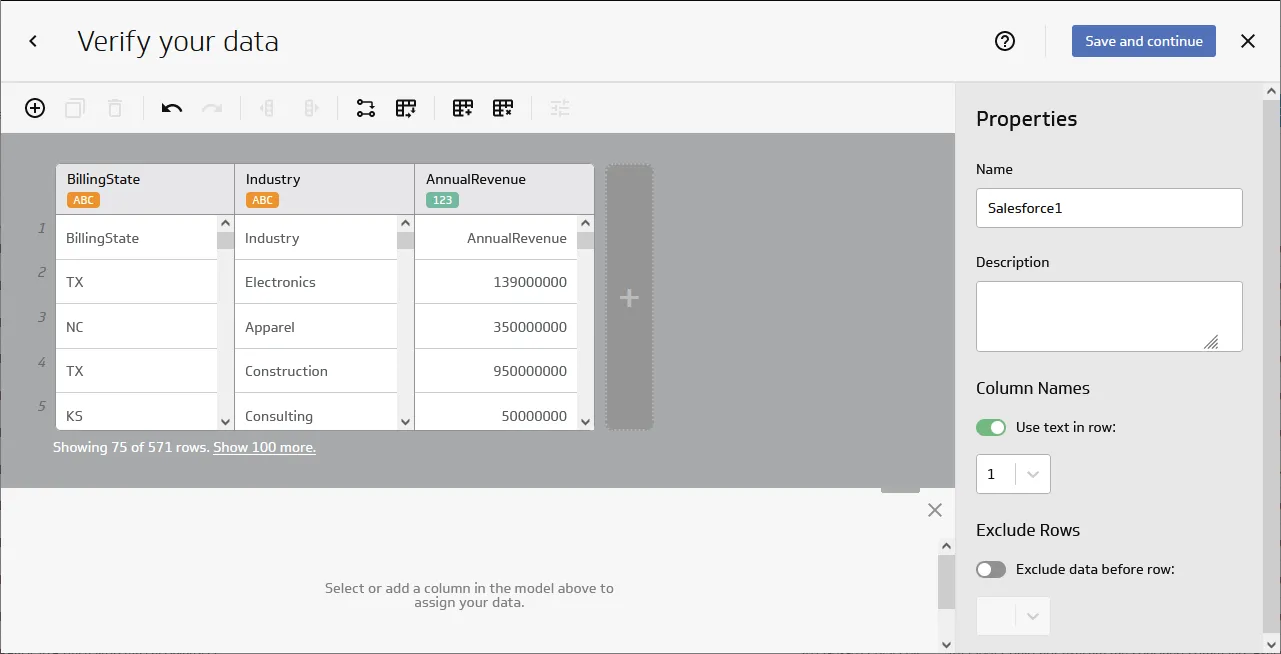
After retrieving the data, click the checkbox to "Model your data" and click "Continue." In the new window, configure your data model.
- Confirm that the model includes all columns you wish to work with
- Name your model
- (optional) Set the Description
- Set "Header in row" to 1
- Click the toggle to "Exclude data before row" and set the value to 2
- Click "Save and Exit"
Create a Metric
With the data modeled, we are ready to create a Metric (or visualization) of the data to be used in the Klipfolio platform for dashboards, reporting, and more.
- Click "Create metrics"
- Select a Data source
- Select a Metric value and default aggregation
- Select Segmentation(s)
- Select a Date & time
- Select a Data shape
- Configure the Display settings
- Click Save
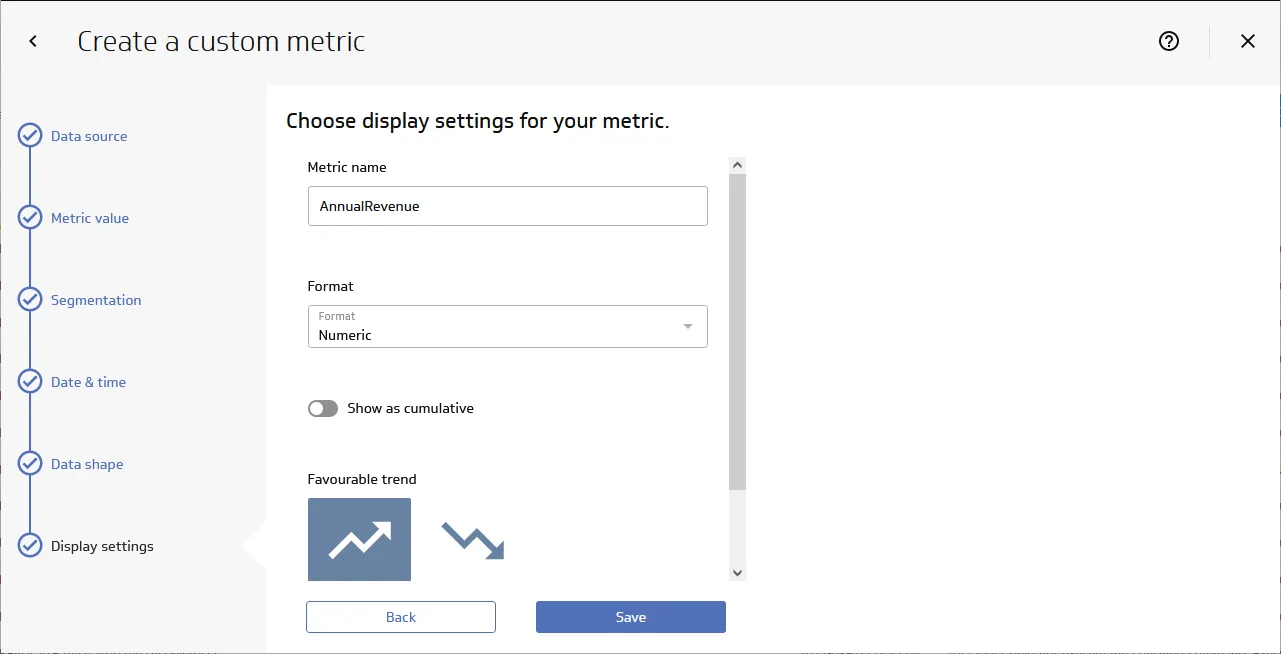
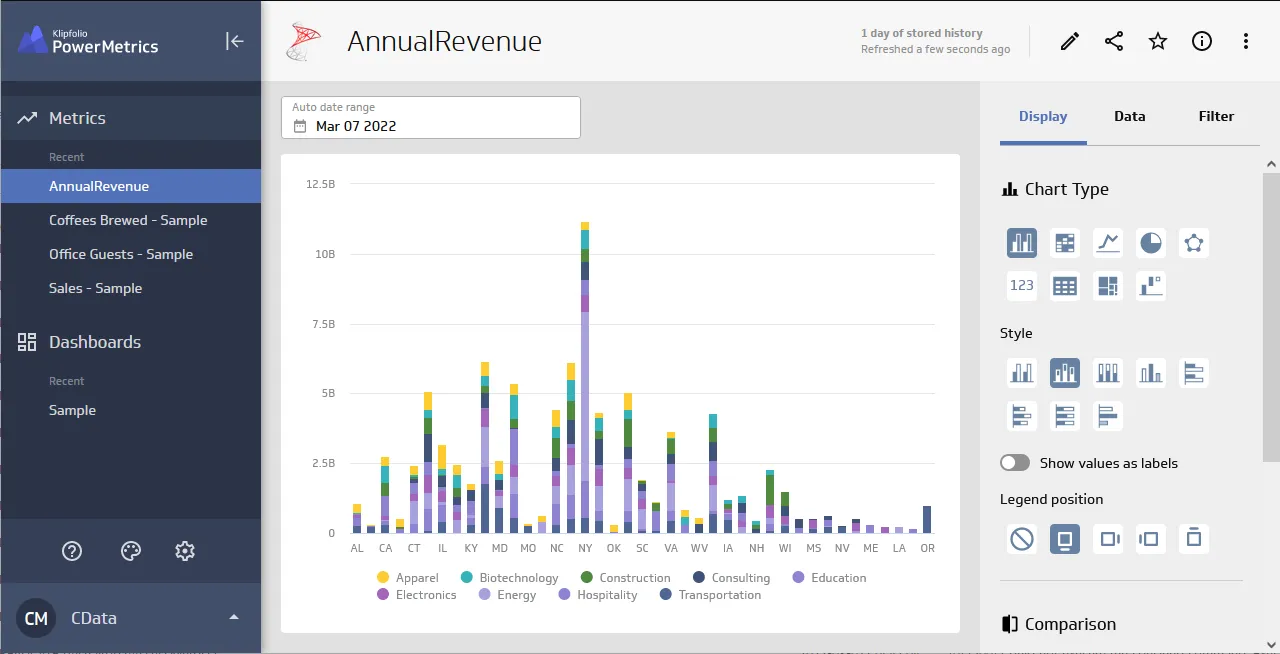
- Navigate to your Metric and further configure the visualization
SQL Access to RSS Feeds from Cloud Applications
Now you have a Metric built from live RSS feeds. You can add it to a new dashboard, share, and more. Easily create more data sources and new visualizations, produce reports, and more — all without replicating RSS feeds.
To get SQL data access to hundreds of SaaS, Big Data, and NoSQL sources directly from your cloud applications, try CData Connect AI.