








Create Reports from Printify Data in Looker Studio

Looker Studio, formerly known as Google Data Studio, empowers users to craft customized reports featuring data visualizations that can be shared with clients while reflecting your brand identity. When combined with CData Connect AI, you gain immediate cloud-to-cloud access to Printify data to create visualizations, dashboards, and more. This article provides step-by-step instructions on establishing a virtual database for Printify and generating reports from Printify data within Looker Studio.
CData Connect AI offers a seamless cloud-to-cloud interface tailored for Printify, making it straightforward to construct reports directly from live Printify data within Looker Studio without the need for data replication. As you create visualizations, Looker Studio generates queries to retrieve data. With its inherent optimized data processing capabilities, CData Connect AI efficiently channels all supported query operations, including filters, JOINs, and more, directly to Printify. This leverages server-side processing to swiftly provide the requested Printify data.
This article requires a CData Connect AI instance and the CData Connect AI Connector for Looker Studio. Get more information on the CData Connect AI and sign up for a free trial at https://www.cdata.com/cloud.
Configure Printify Connectivity for Looker Studio
Connectivity to Printify from Looker Studio is made possible through CData Connect AI. To work with Printify data from Looker Studio, we start by creating and configuring a Printify connection.
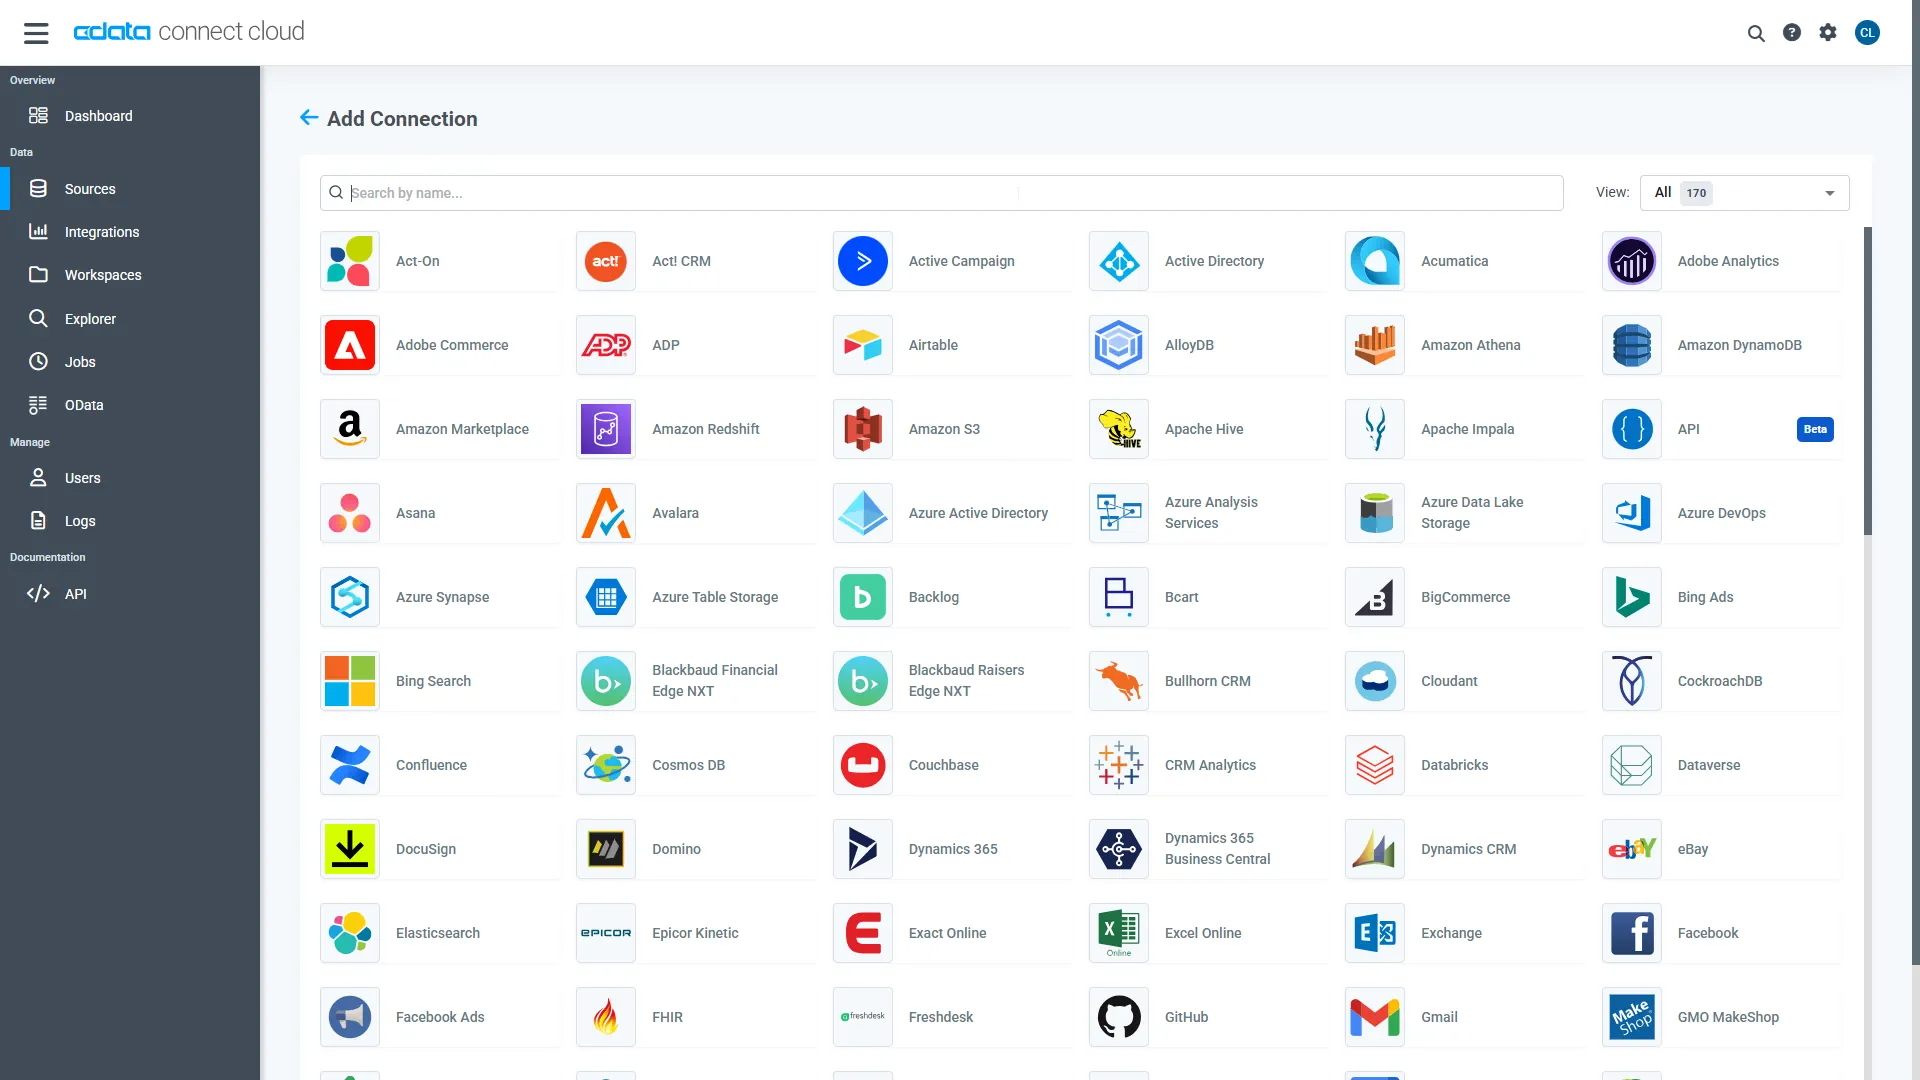
- Log into Connect AI, click Sources, and then click Add Connection
- Select "Printify" from the Add Connection panel
-
Enter the necessary authentication properties to connect to Printify.
Start by setting the Profile connection property to the location of the Printify Profile on disk (e.g. C:\profiles\Profile.apip). Next, set the ProfileSettings connection property to the connection string for Printify (see below).
Printify API Profile Settings
In order to authenticate to Printify, you'll need to provide your API Key. To get your API Key navigate to My Profile, then Connections. In the Connections section you will be able to generate your Personal Access Token (API Key) and set your Token Access Scopes. Personal Access Tokens are valid for one year. An expired Personal Access Token can be re-generated using the same steps after it expires. Set the API Key to your Personal Access Token in the ProfileSettings property to connect.
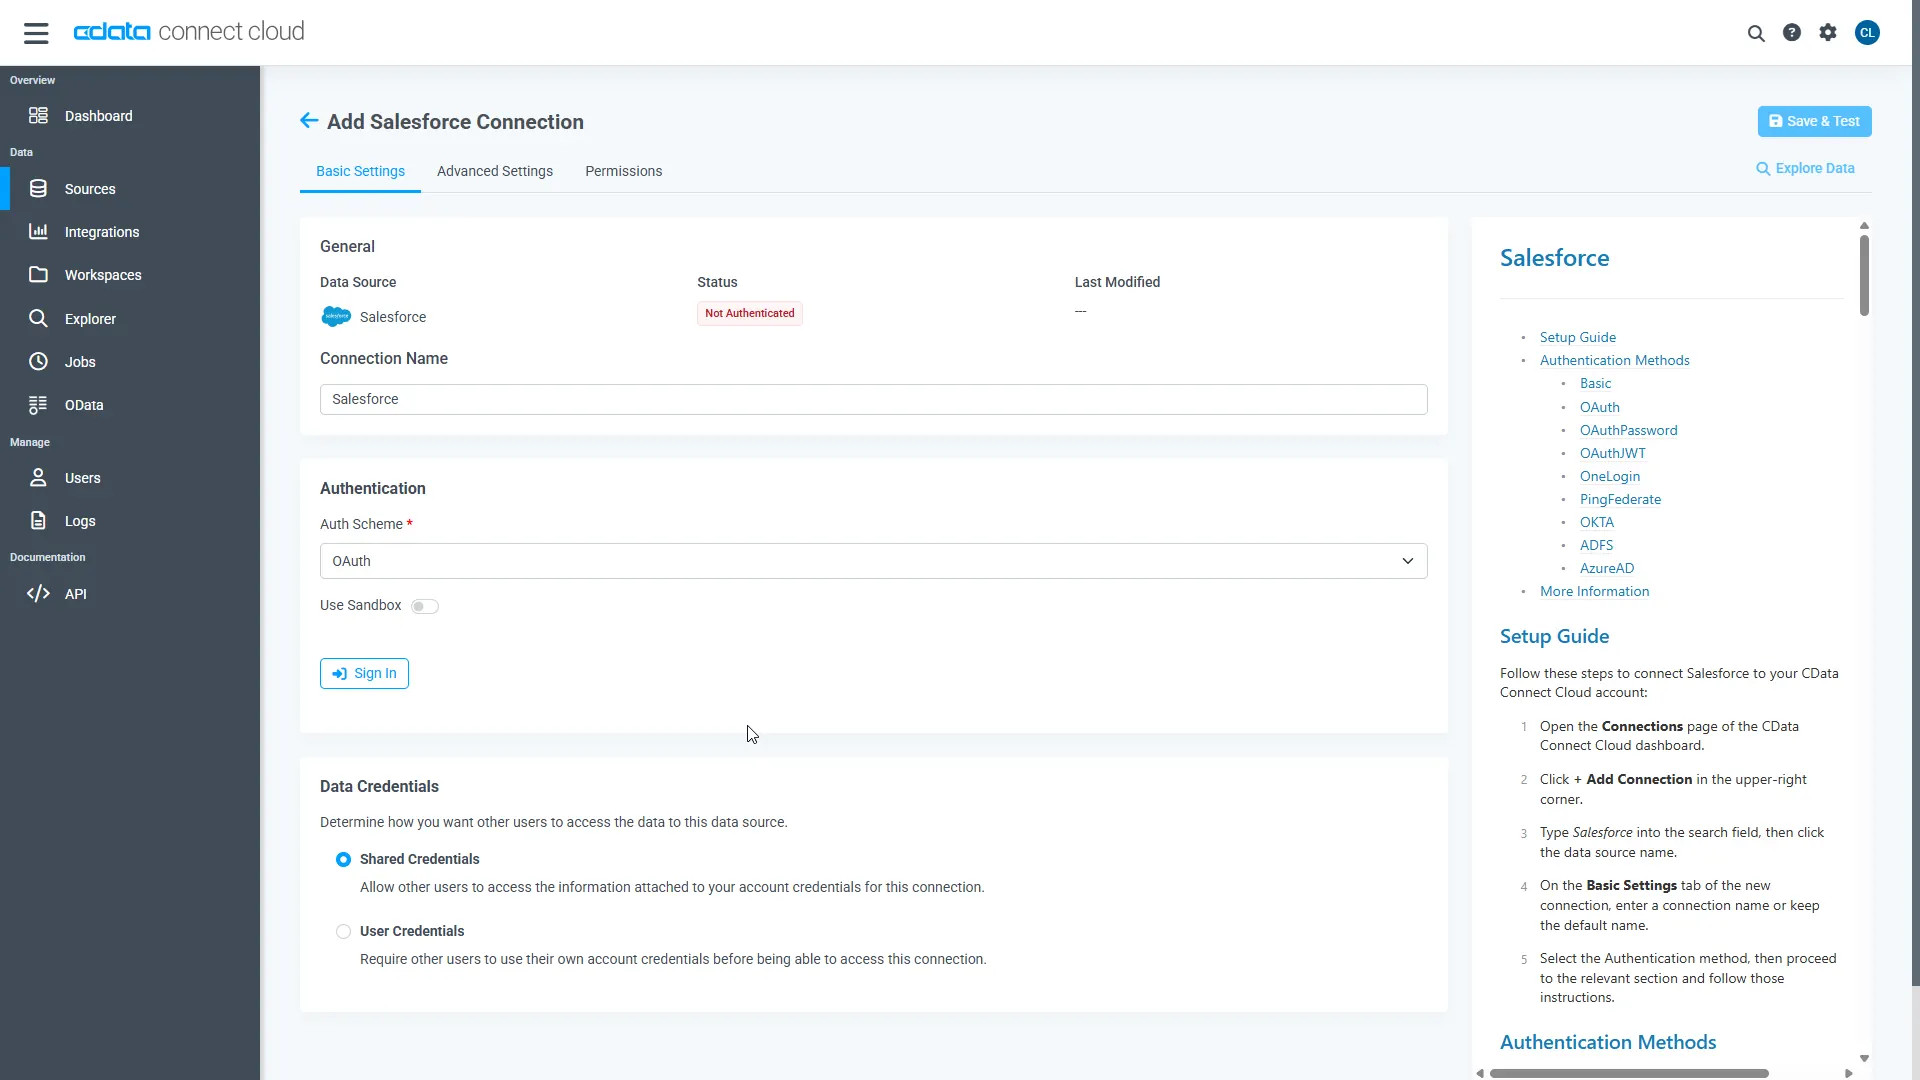
- Click Save & Test
-
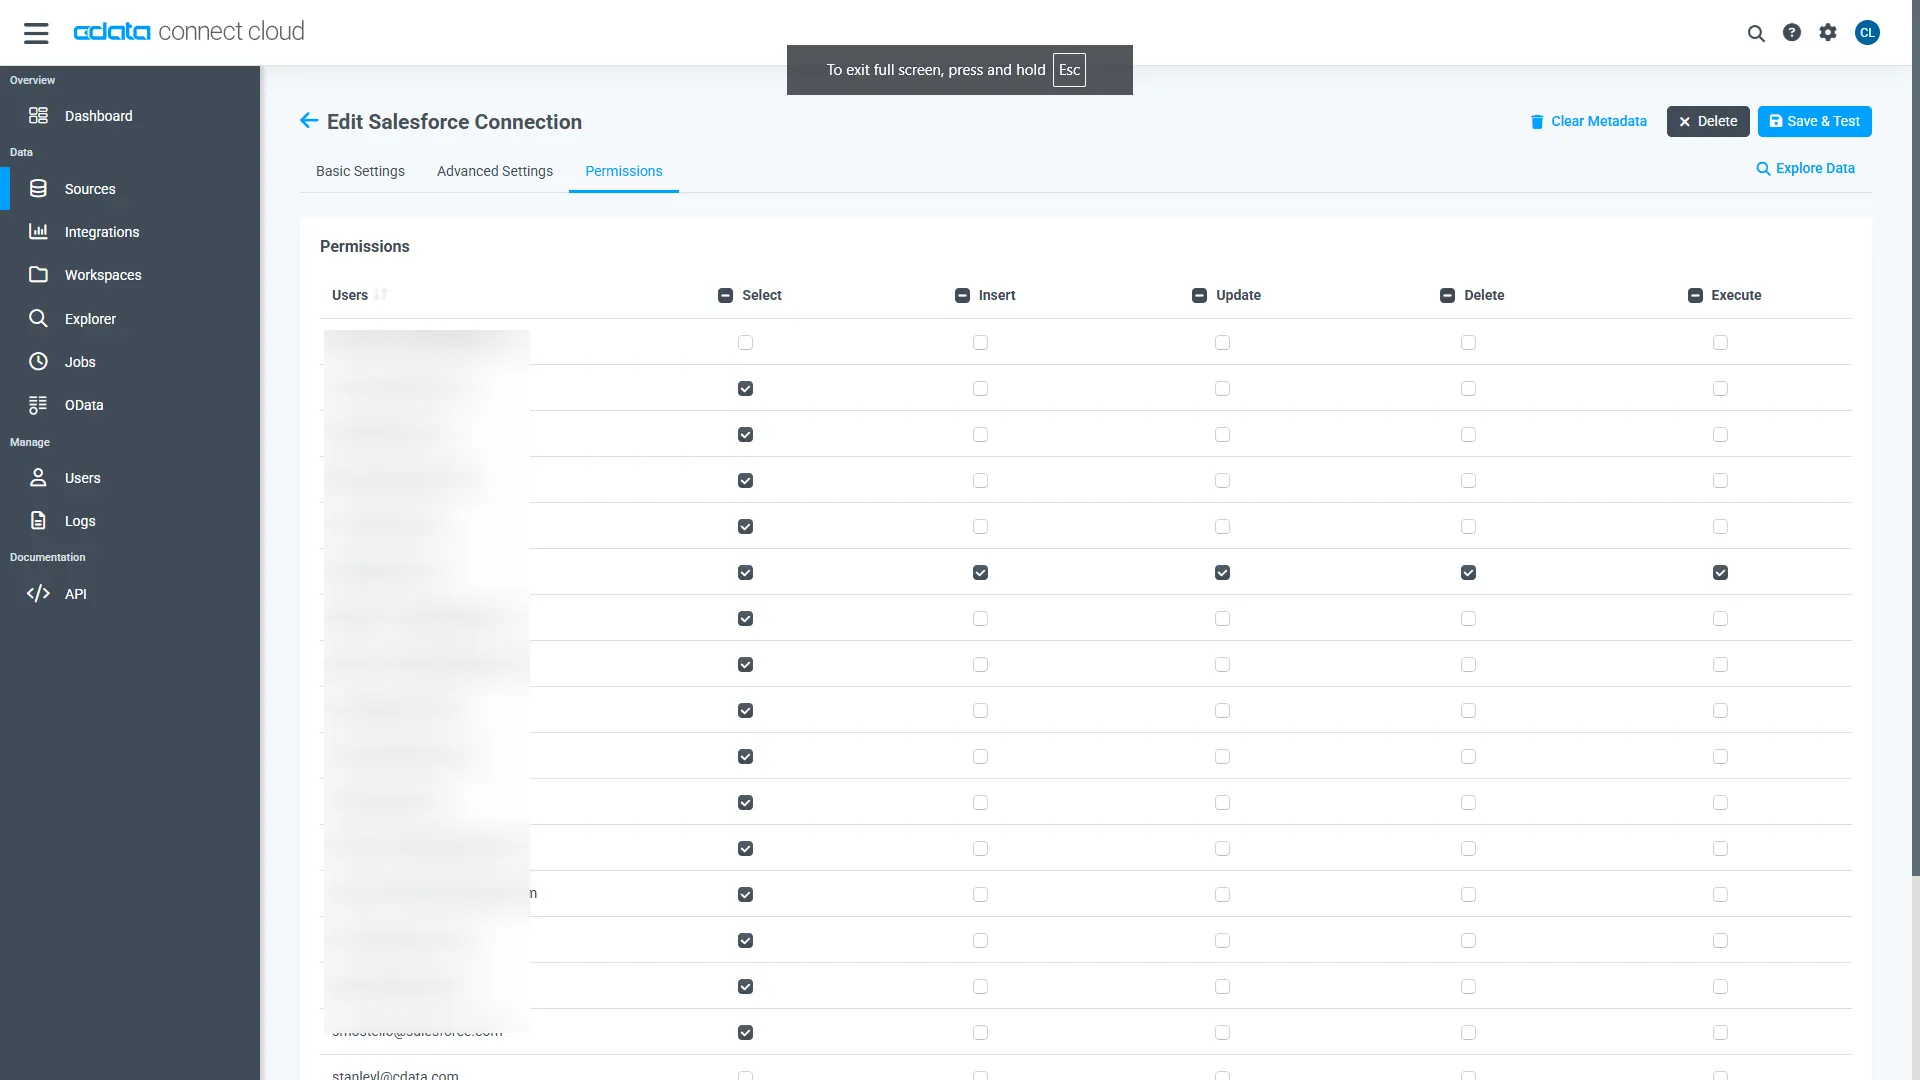
Navigate to the Permissions tab in the Add Printify Connection page and update the User-based permissions.
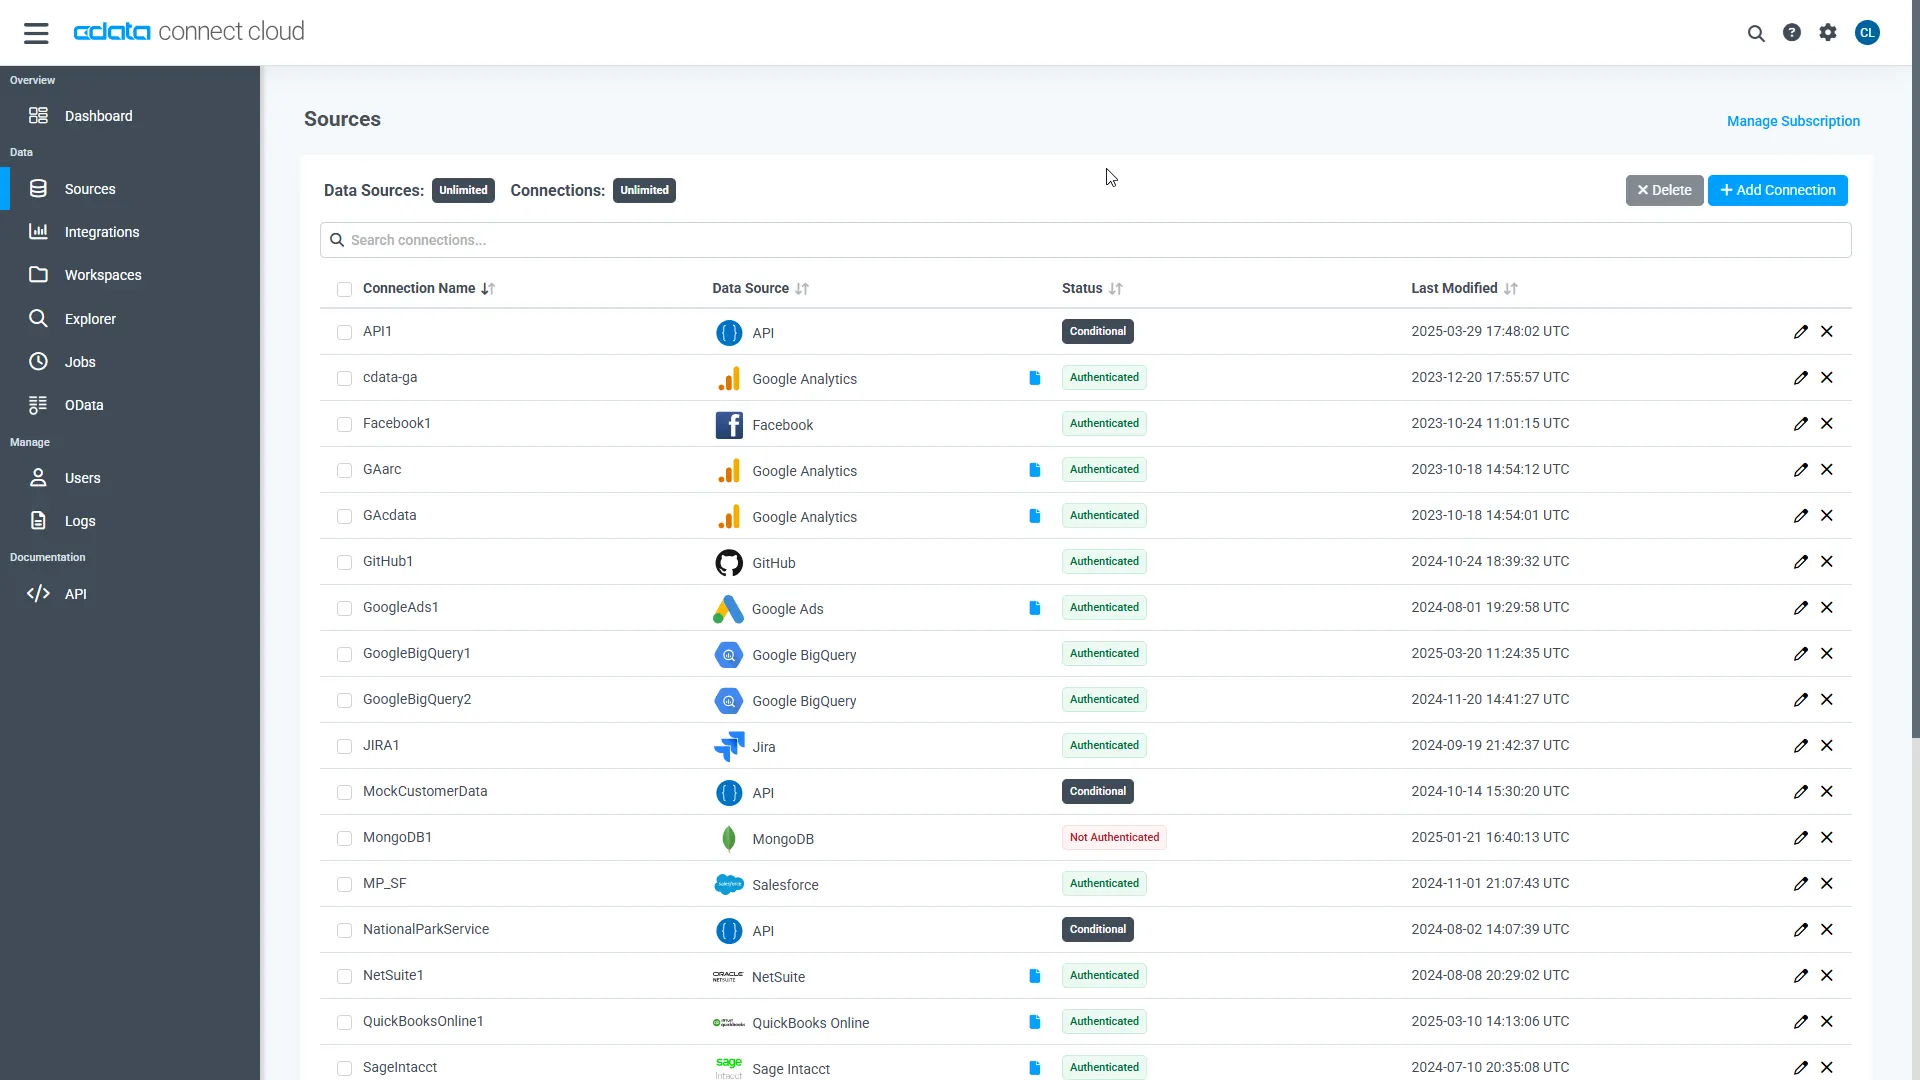
With the connection configured, you are ready to connect to Printify data from Looker Studio.
Visualize Live Printify Data from Looker Studio
The steps below outline connecting to CData Connect AI from Looker Studio to create a new Printify data source and build a simple visualization from the data.
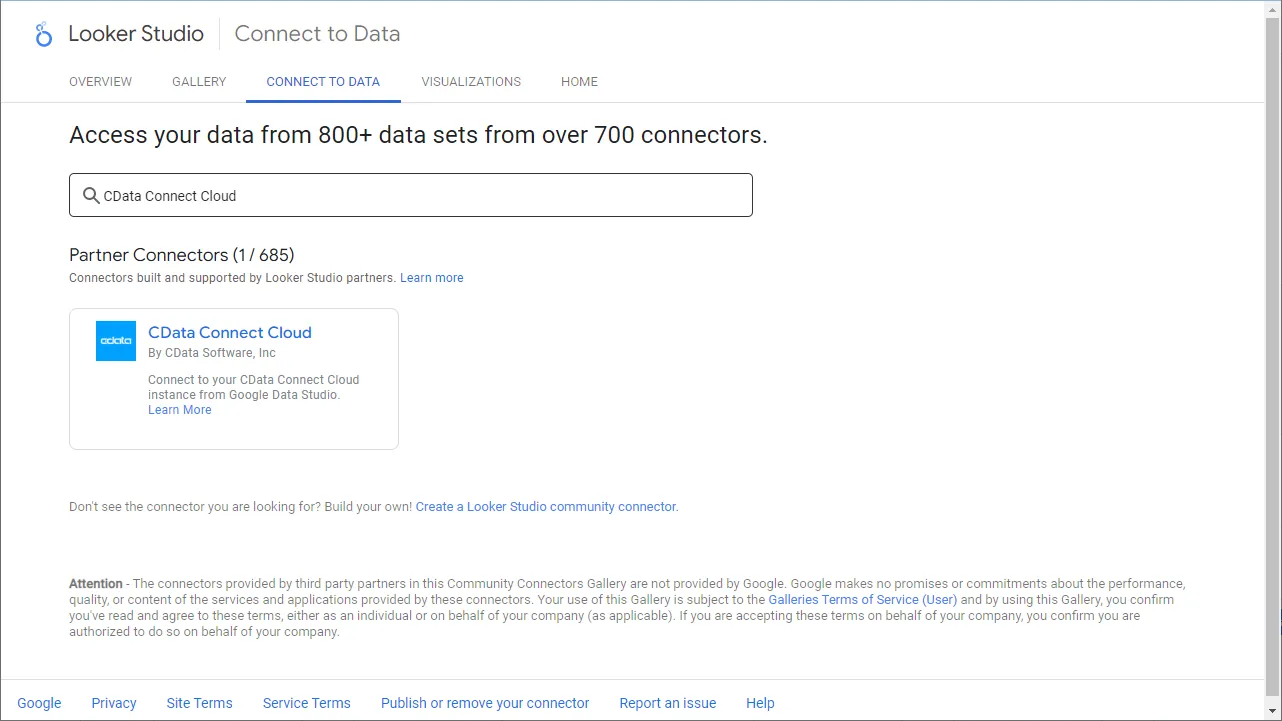
- Log into Looker Studio, click data sources, create a new data source, and choose CData Connect AI Connector.
- Click Authorize and allow access to your Google account.
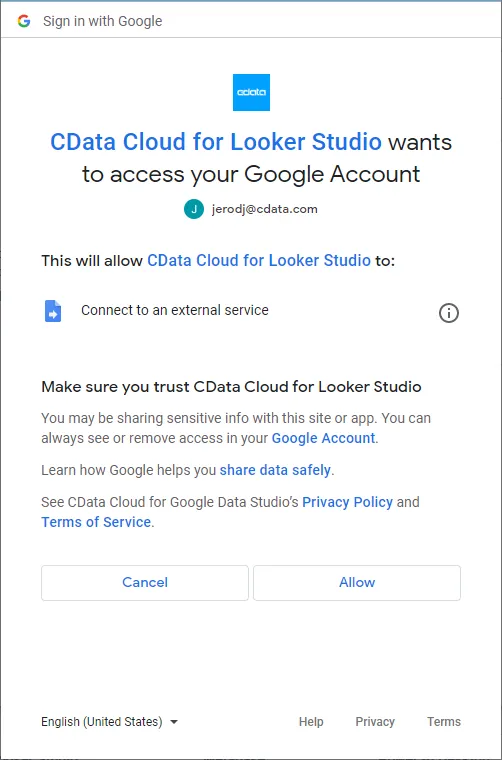
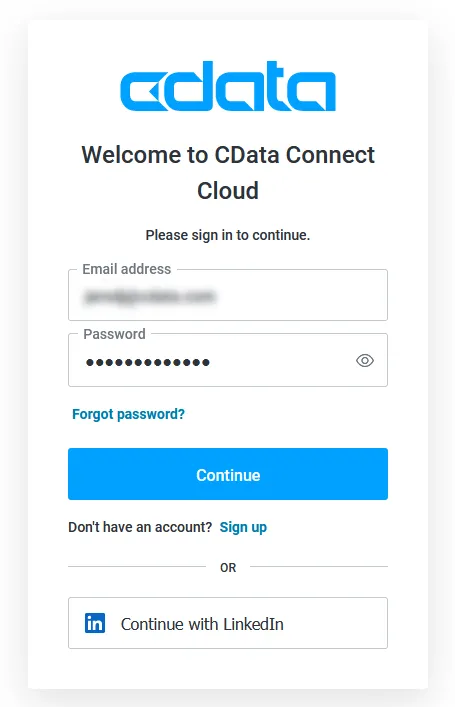
- Click Authorize to authenticate with your CData Connect AI instance
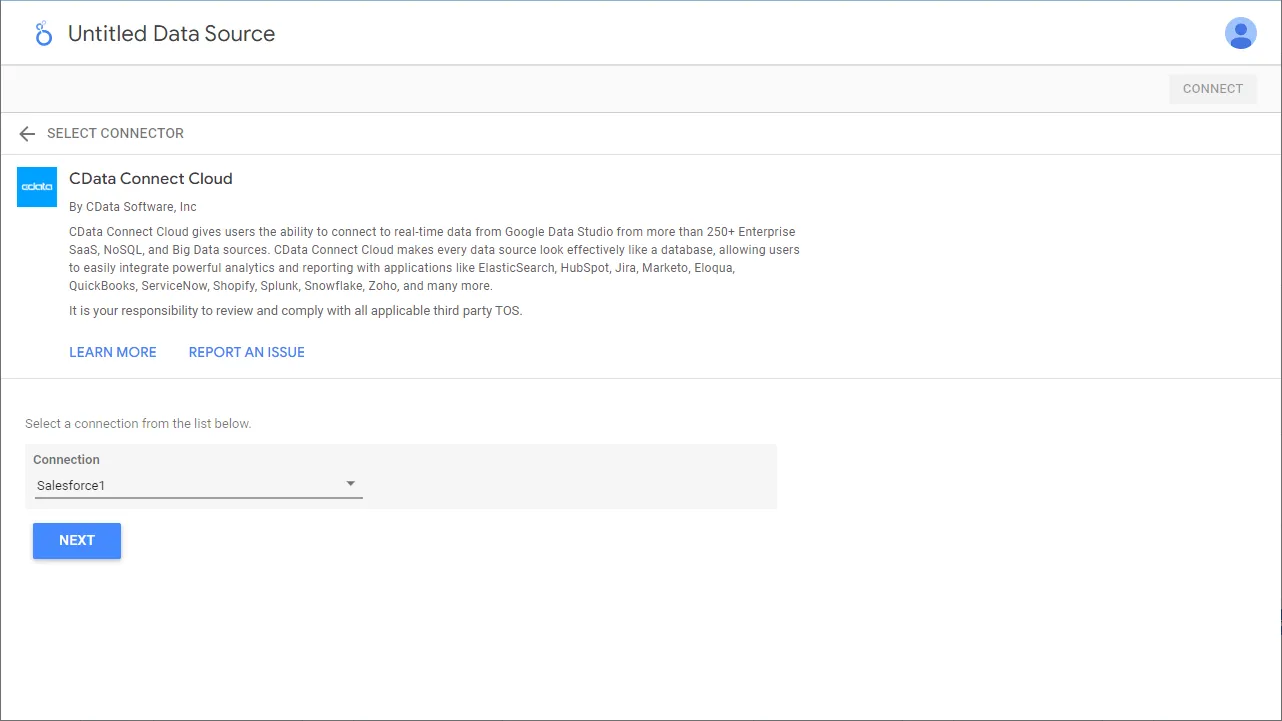
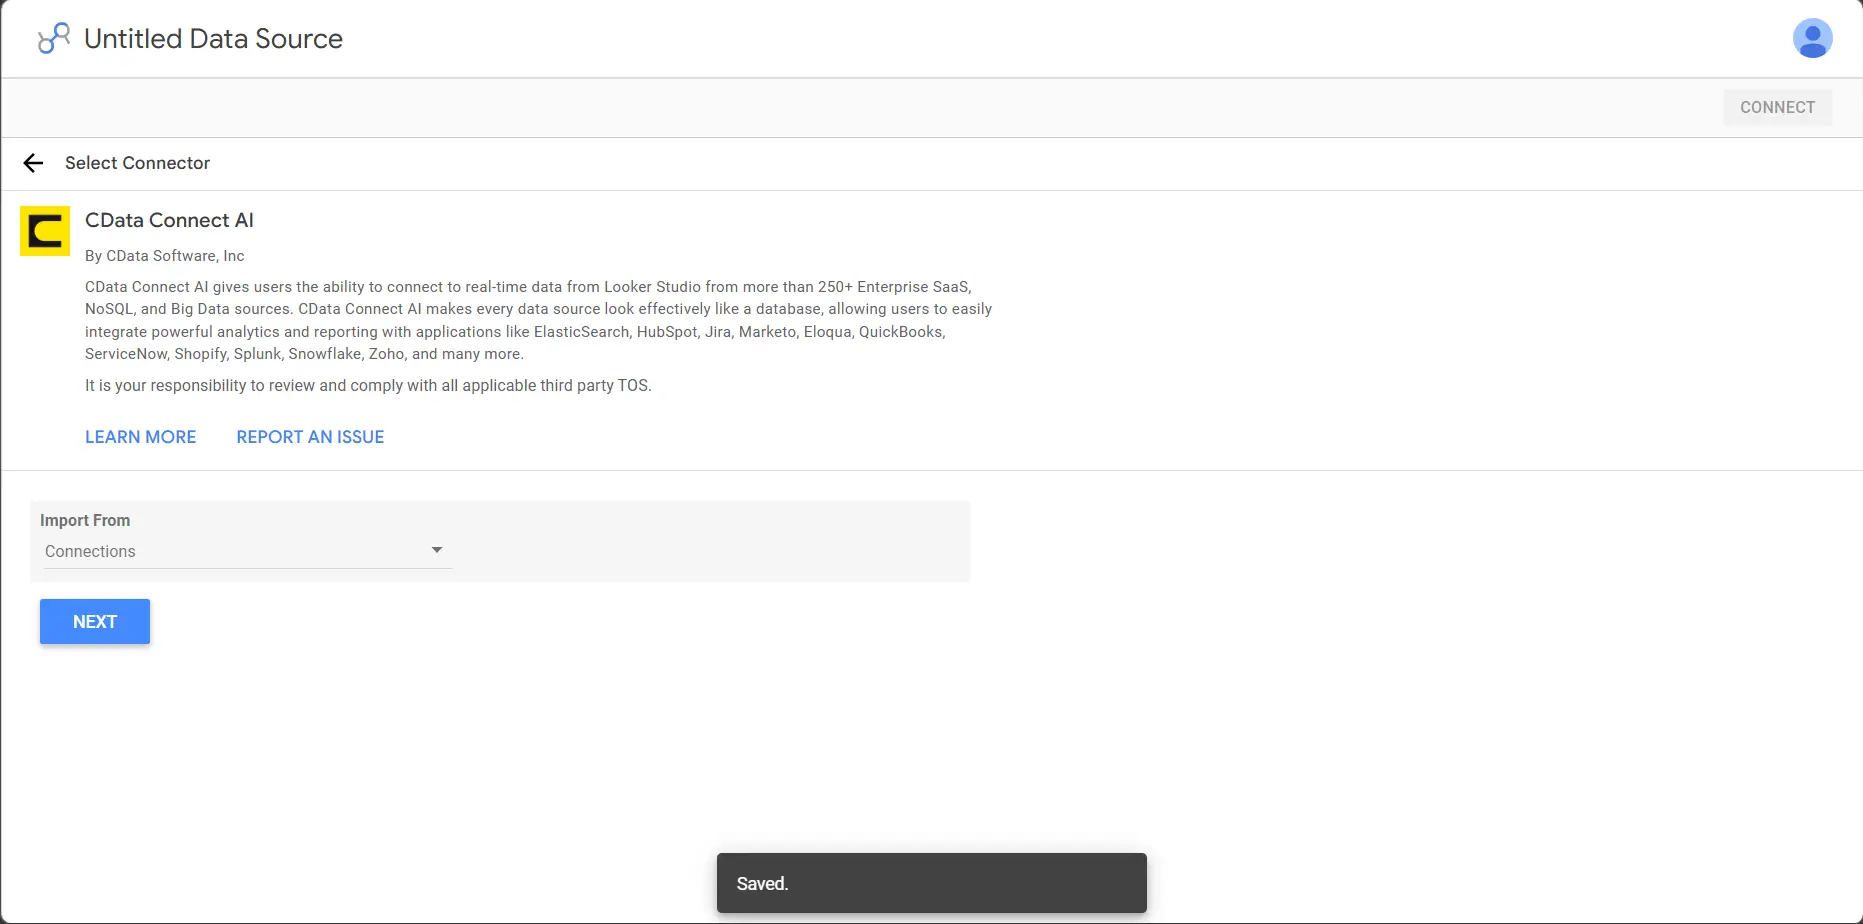
- In the CData Connect AI Connector in Looker Studio select Connections to import from the dropdown and click Next
- Now select a Connection (e.g. API1) and click Next
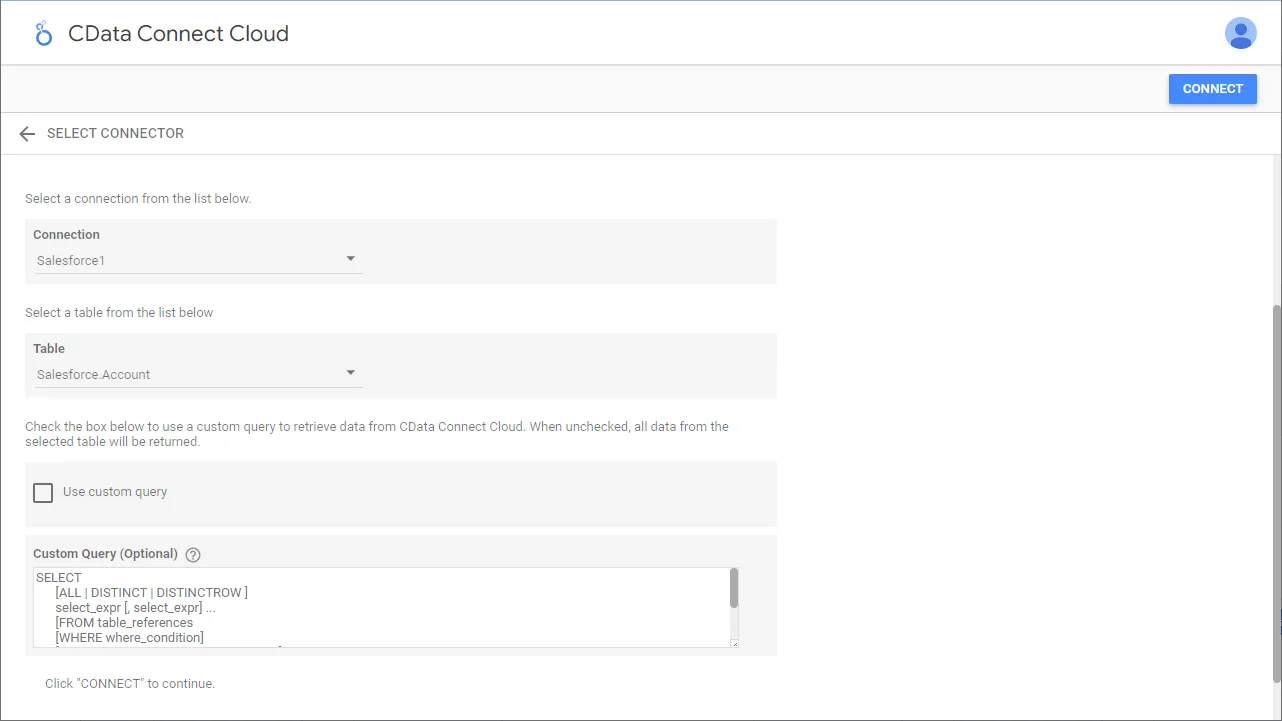
- Select a Table (e.g. Tags) or use a Custom Query and click Connect to continue
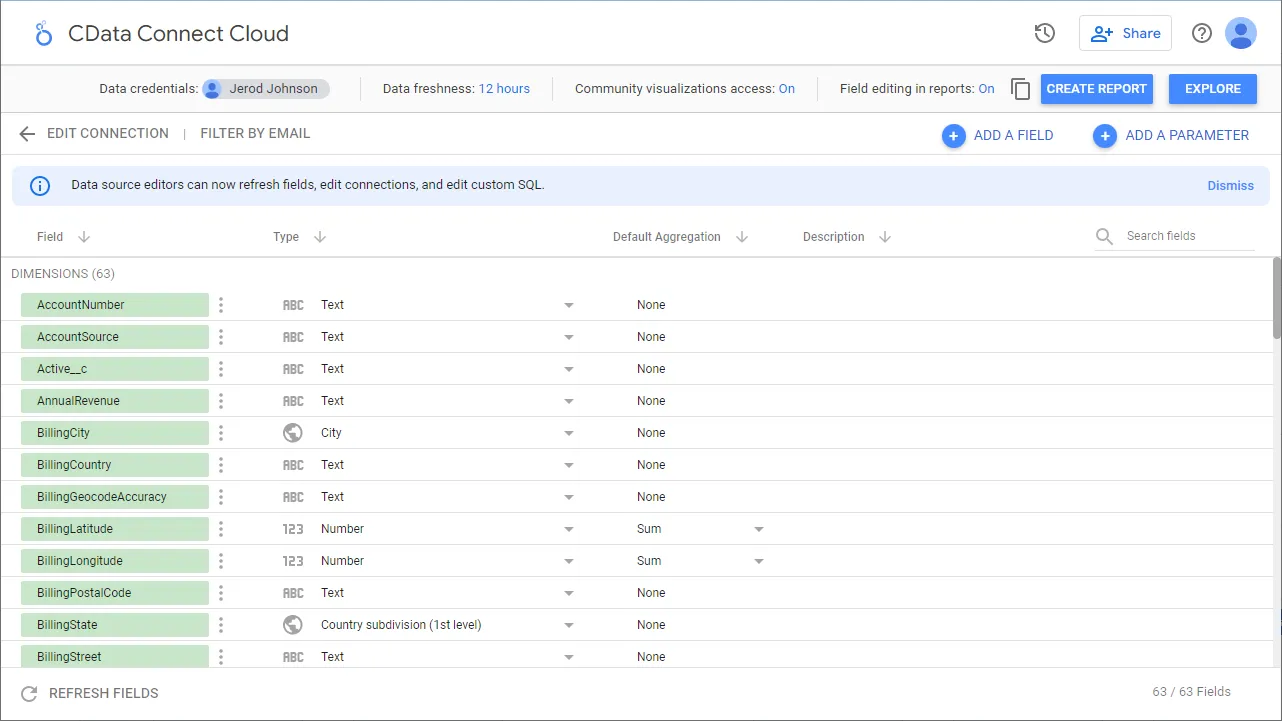
- If needed, modify columns, click Create Report, and add the data source to the report.
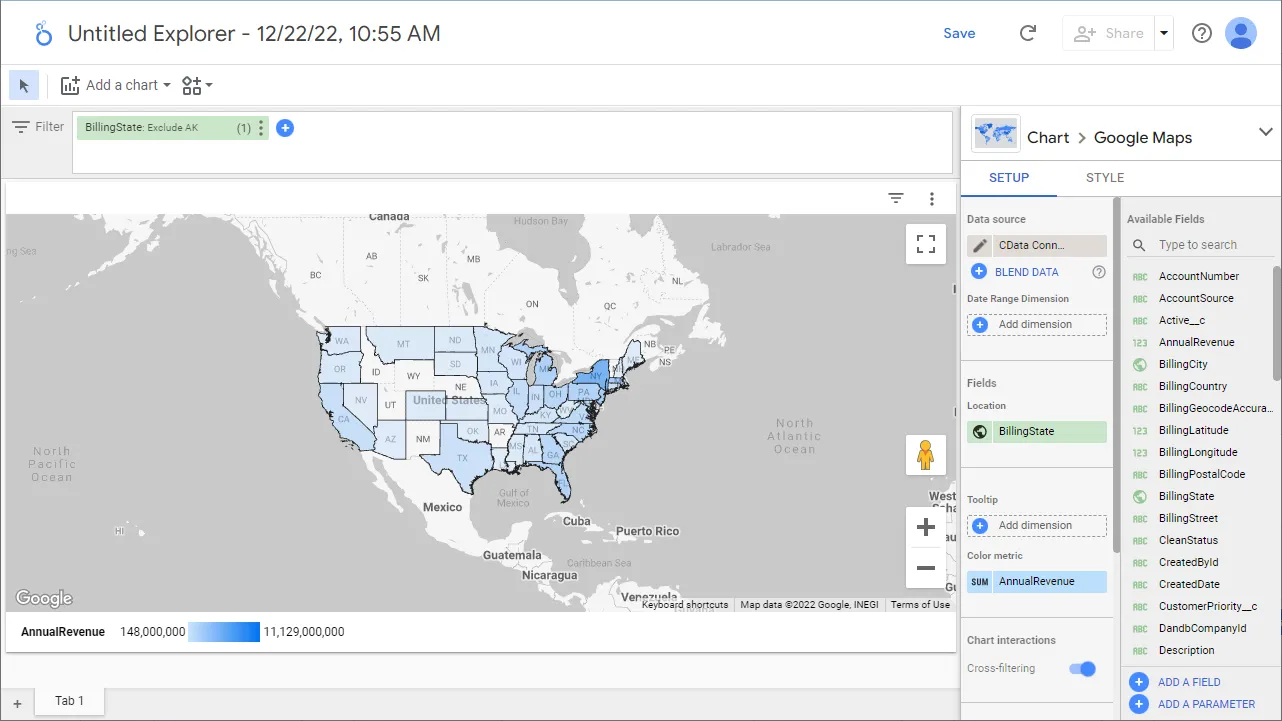
- Select a visualization style and add it to the report.
- Select Dimensions and Measures to customize your visualization.
Live Access to Printify Data from Cloud Applications
Now you have a direct, cloud-to-cloud connection to live Printify data from your Looker Studio workbook. You can create more data sources and new visualizations, build reports, and more — all without replicating Printify data.
Try CData Connect AI and get real-time data access to hundreds of SaaS, Big Data, and NoSQL sources directly from your cloud applications.