







Create DB2-Connected Dashboards in Grafana

Grafana is an open-source platform that allows users to analyze, monitor, and visualize telemetry from various data sources. When combined with CData Connect AI, you gain immediate access to DB2 data for business dashboards. This article outlines the process of connecting to DB2 using Connect AI and creating a basic dashboard from DB2 data within Grafana.
CData Connect AI offers a pure SQL Server, cloud-to-cloud interface for DB2, enabling the creation of dashboards directly from live DB2 data within Grafana, all without the need for data replication to a native database. As you build visualizations, Grafana generates SQL queries to gather data. With its inherent optimized data processing capabilities, CData Connect AI efficiently channels all supported SQL operations, including filters and JOINs, directly to DB2. This leverages server-side processing to swiftly deliver the requested DB2 data.
Configure DB2 Connectivity for Grafana
Connectivity to DB2 from Grafana is made possible through CData Connect AI. To work with DB2 data from Grafana, we start by creating and configuring a DB2 connection.
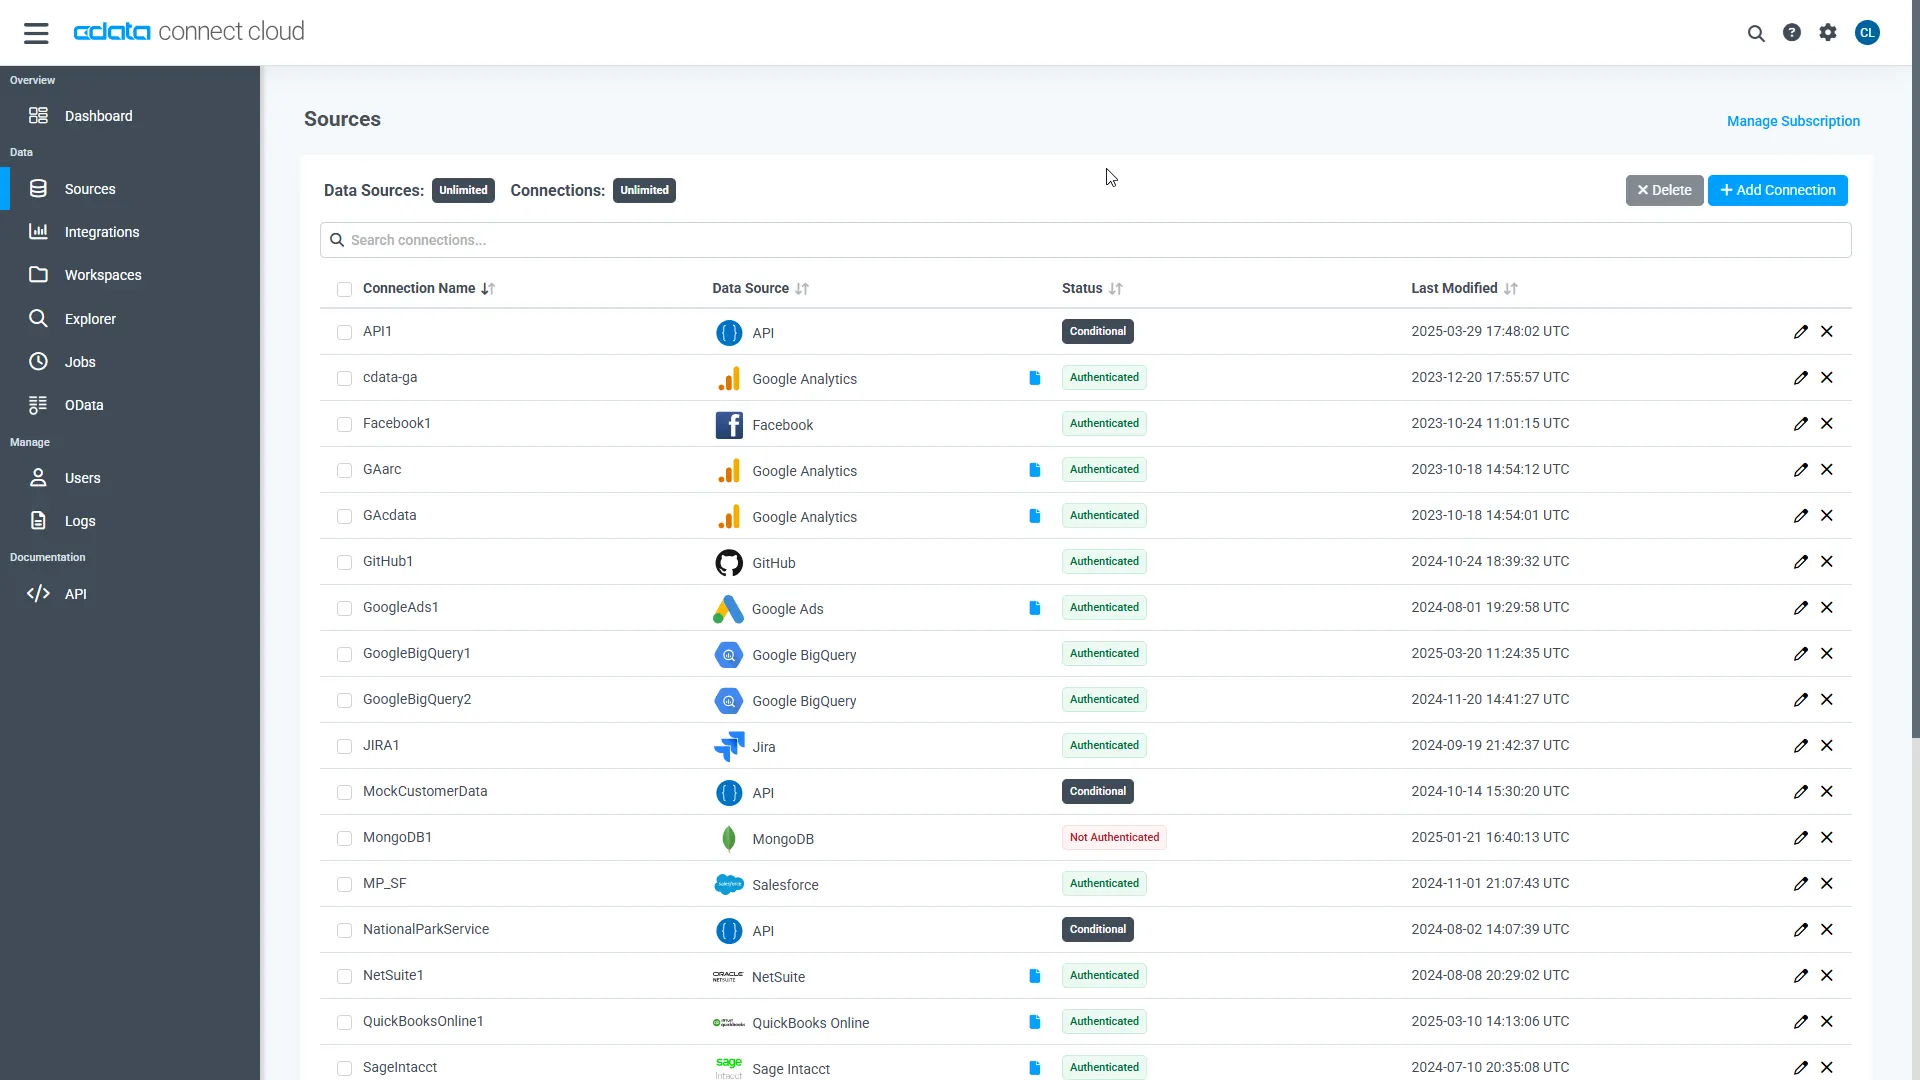
- Log into Connect AI, click Sources, and then click Add Connection
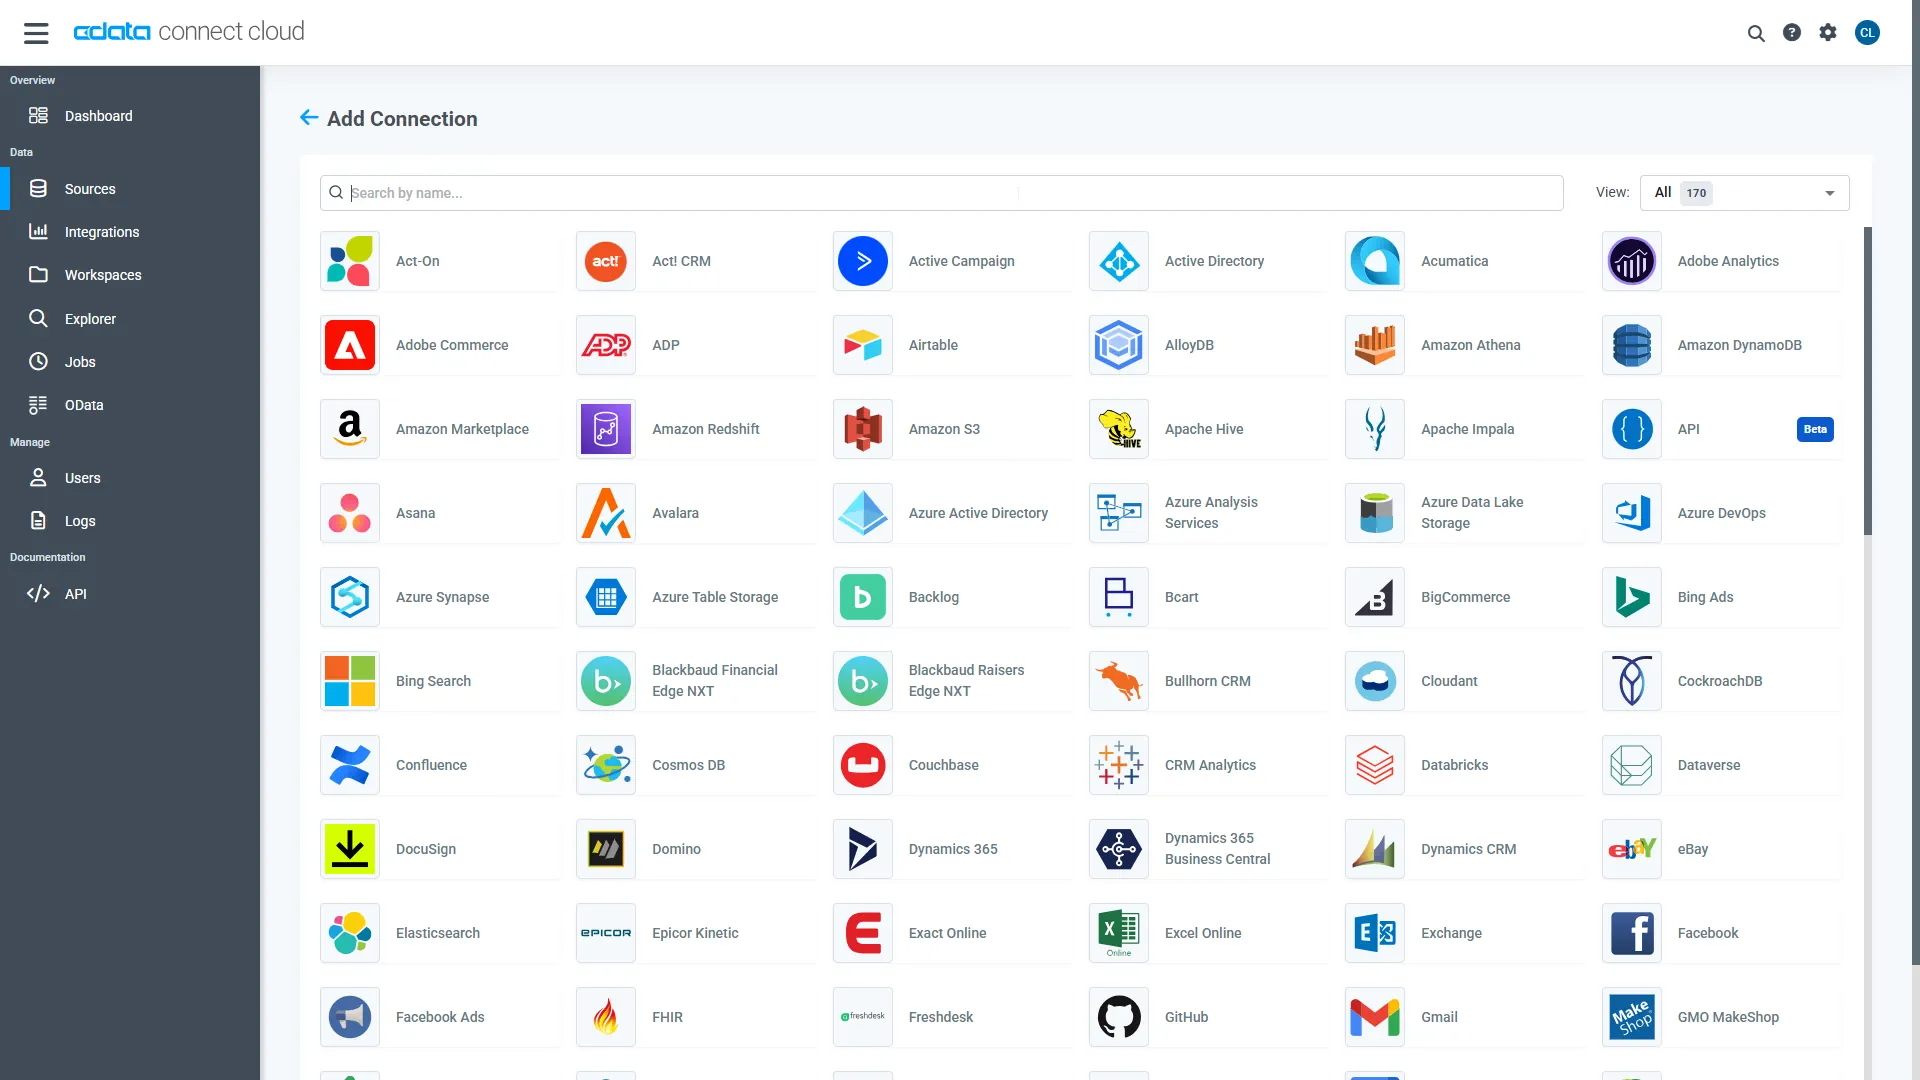
- Select "DB2" from the Add Connection panel
-
Enter the necessary authentication properties to connect to DB2.
Set the following properties to connect to DB2:
- Server: Set this to the name of the server running DB2.
- Port: Set this to the port the DB2 server is listening on.
- Database: Set this to the name of the DB2 database.
- User: Set this to the username of a user allowed to access the database.
- Password: Set this to the password of a user allowed to access the database.
You will also need to install the corresponding DB2 driver:
- Windows: Install the IBM Data Server Provider for .NET.
On Windows, installing the IBM Data Server Provider is sufficient, as the installation registers it in the machine.config.
- Java: Install the IBM Data Server Driver for JDBC.
In the Java version, place the IBM Data Server Driver JAR in the www\WEB-INF\lib\ folder for this application.
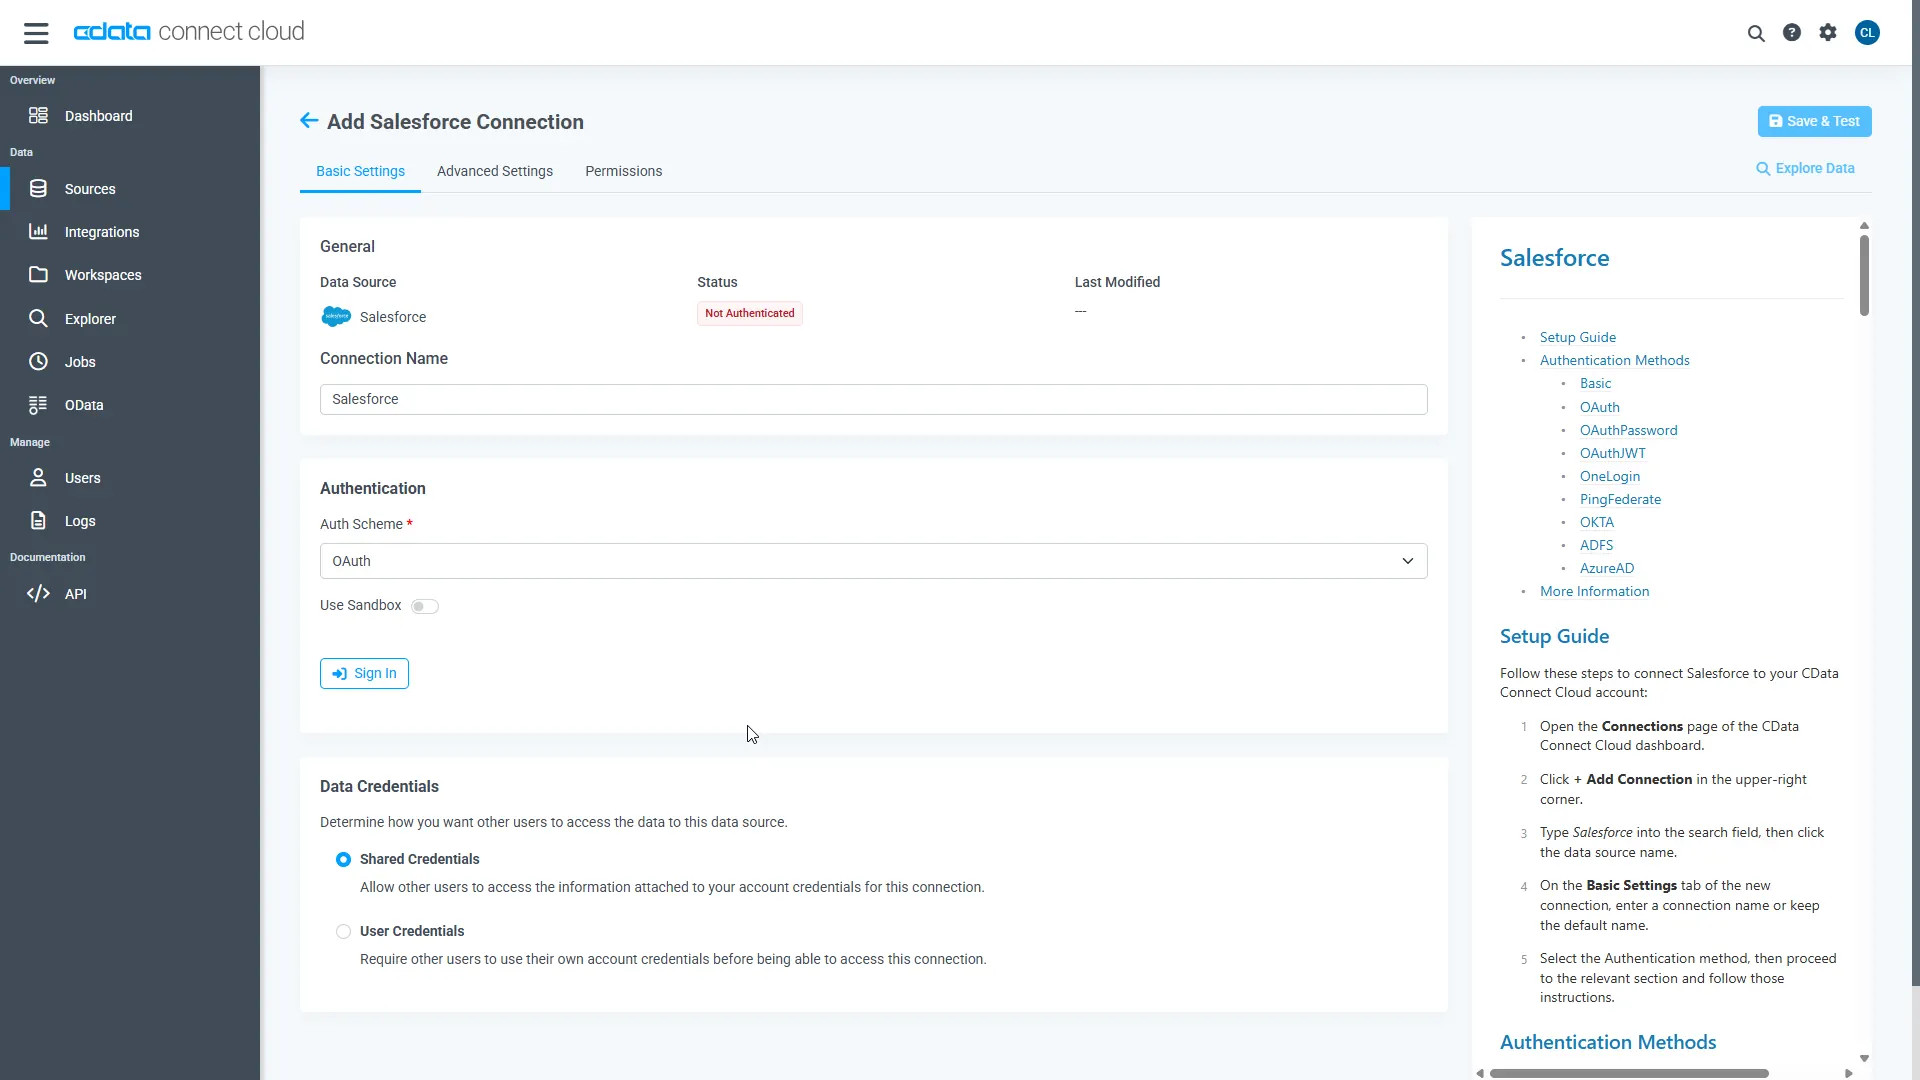
- Click Save & Test
-
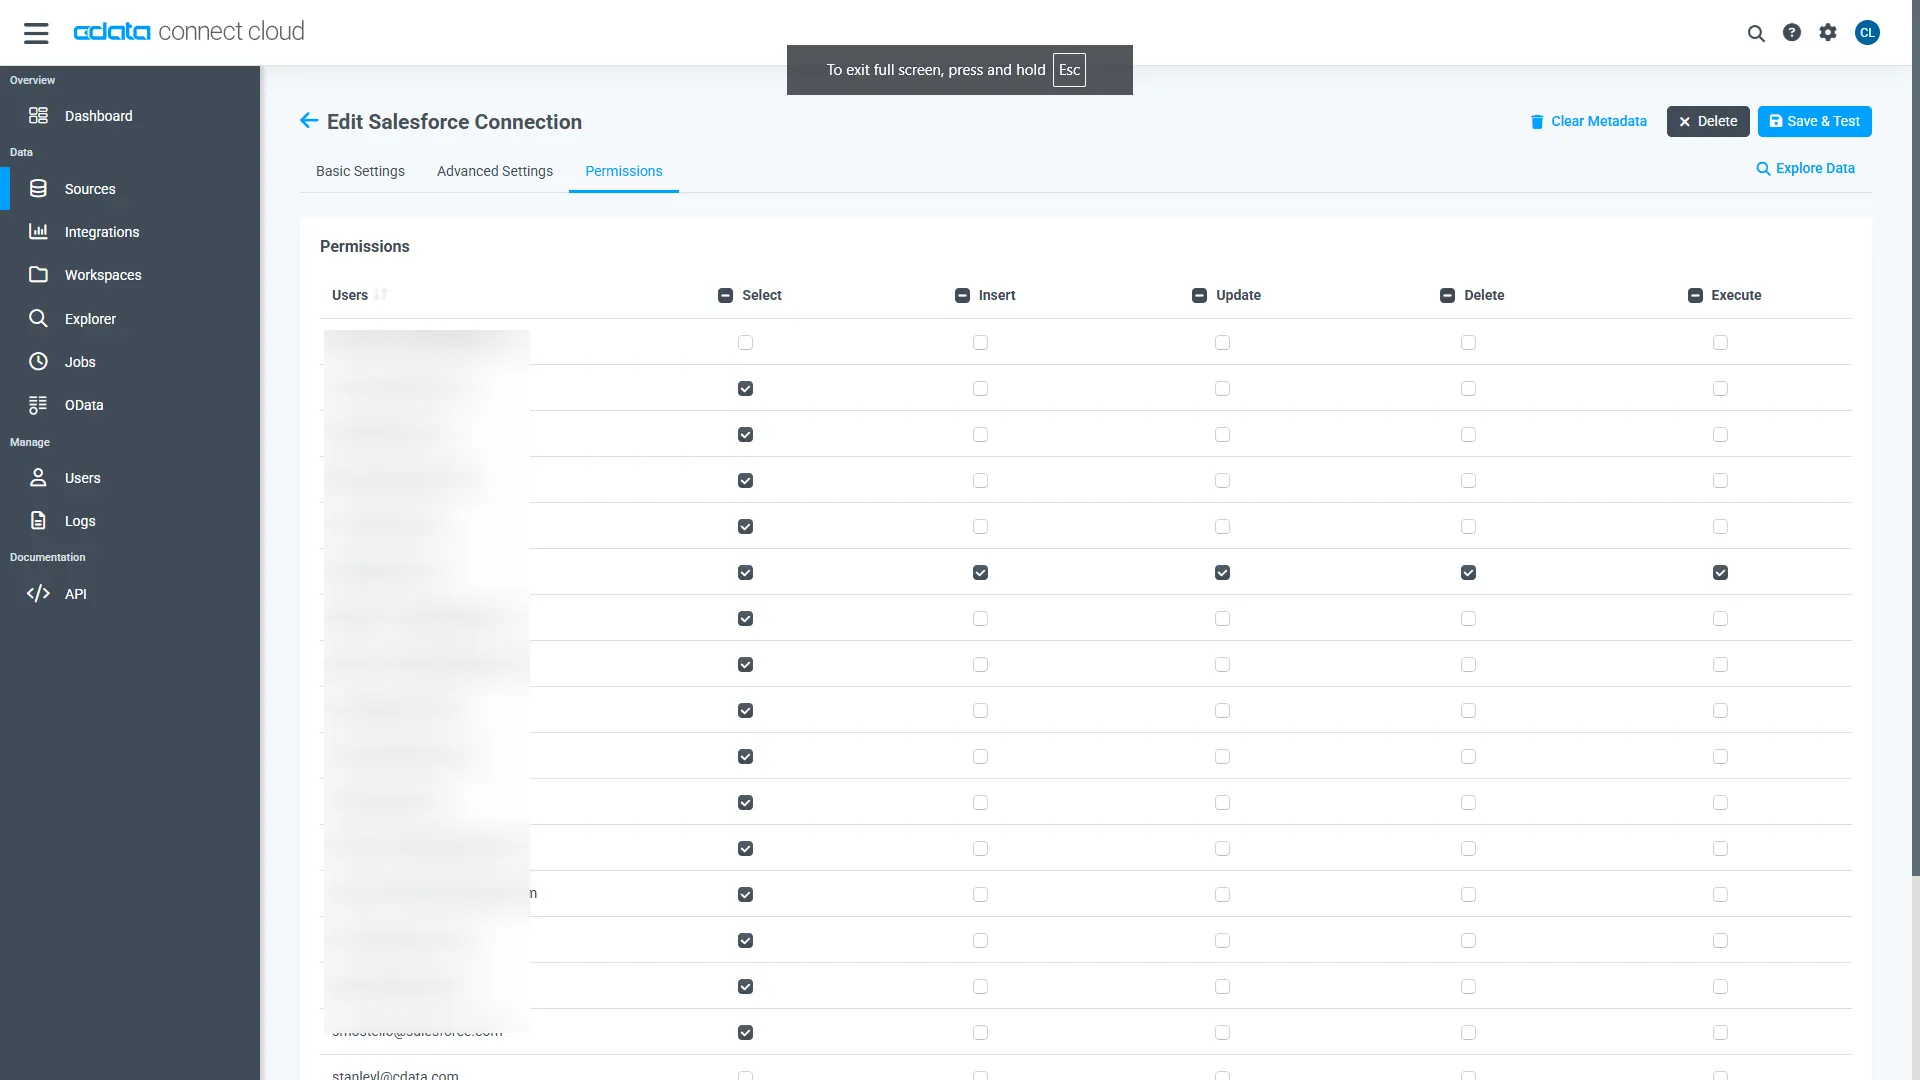
Navigate to the Permissions tab in the Add DB2 Connection page and update the User-based permissions.
Add a Personal Access Token
When connecting to Connect AI through the REST API, the OData API, or the Virtual SQL Server, a Personal Access Token (PAT) is used to authenticate the connection to Connect AI. It is best practice to create a separate PAT for each service to maintain granularity of access.
- Click on the Gear icon () at the top right of the Connect AI app to open the settings page.
- On the Settings page, go to the Access Tokens section and click Create PAT.
-
Give the PAT a name and click Create.
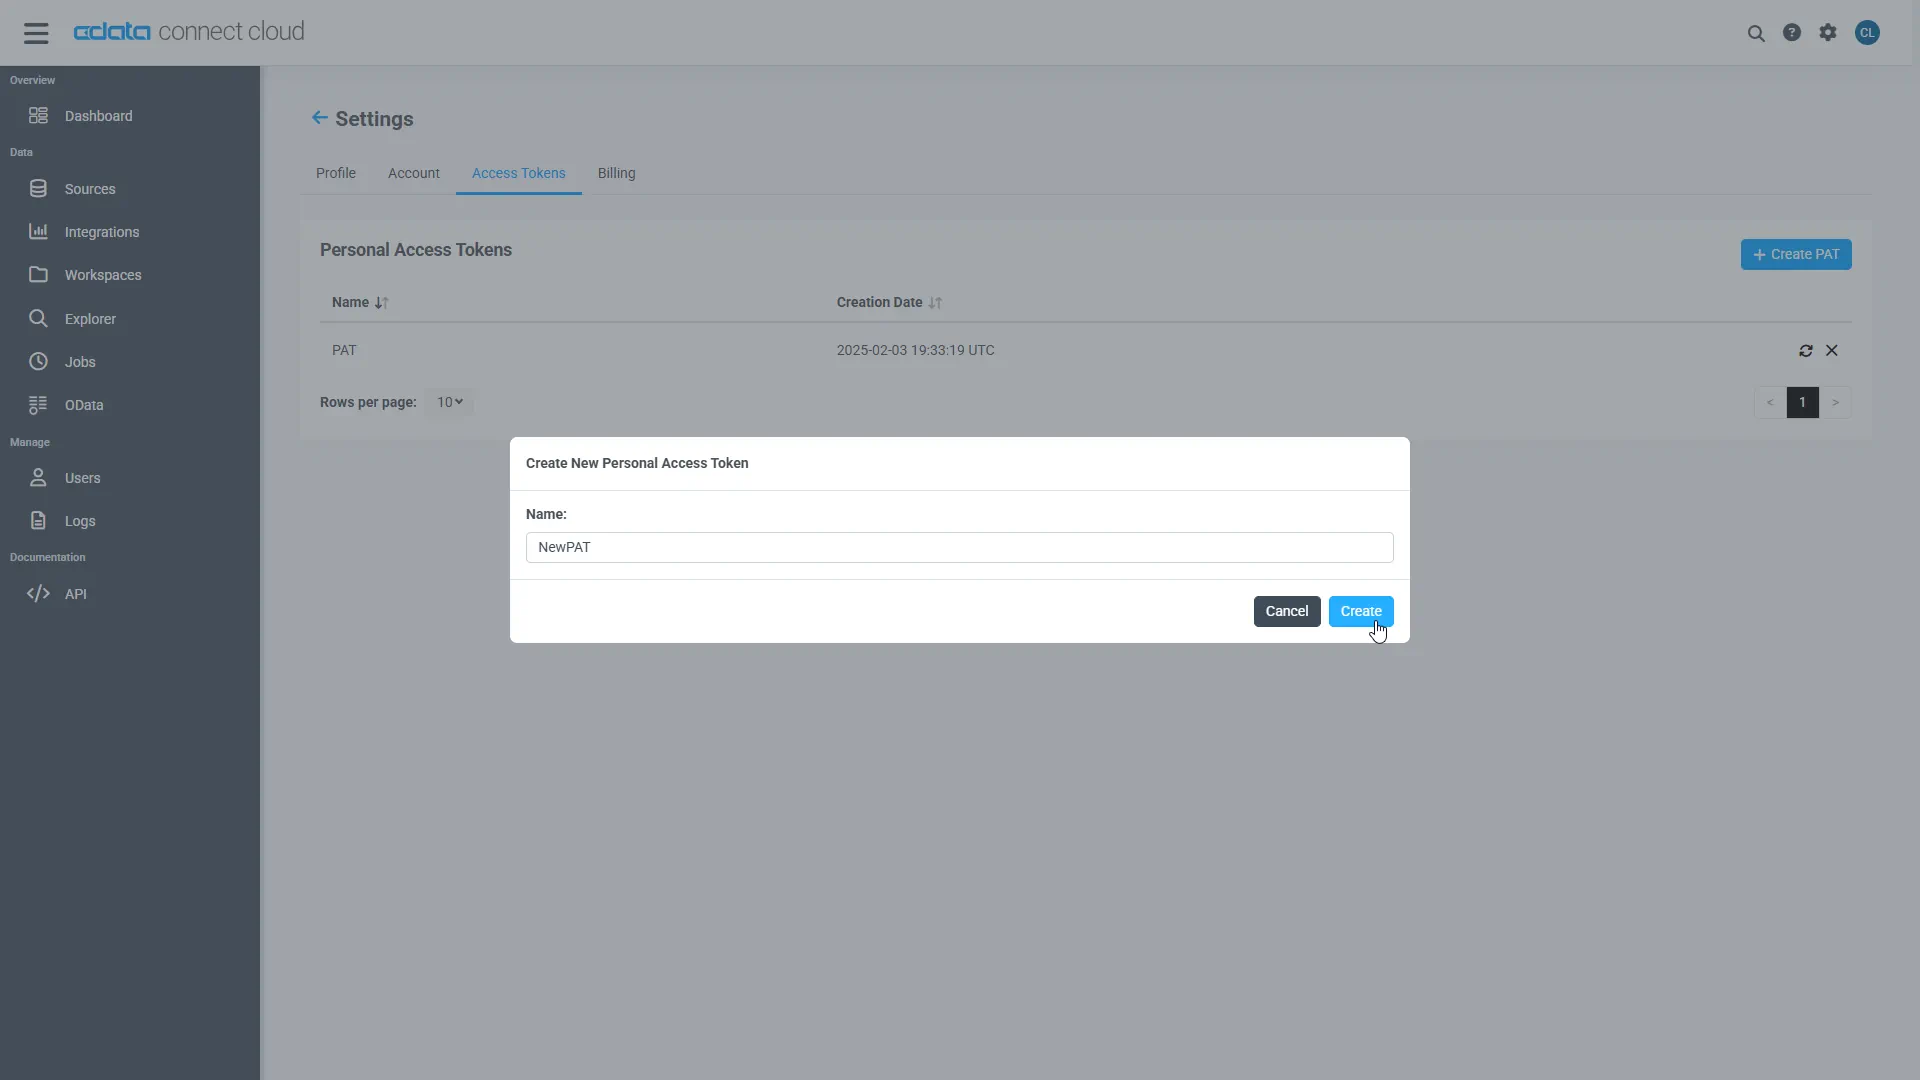
- The personal access token is only visible at creation, so be sure to copy it and store it securely for future use.
With the connection configured and a PAT generated, you are ready to connect to DB2 data from Grafana.
Visualize Live DB2 Data in Grafana
To establish a connection from Grafana to the CData Connect AI Virtual SQL Server API, follow these steps.
- If you have not already done so, download and install Grafana for your operating system from the Grafana Website. Once installed, access Grafana at http://localhost:3000/.
- Log in to Grafana with your username and password for Grafana. If this is your first time logging in, the username is admin and the password is admin.
-
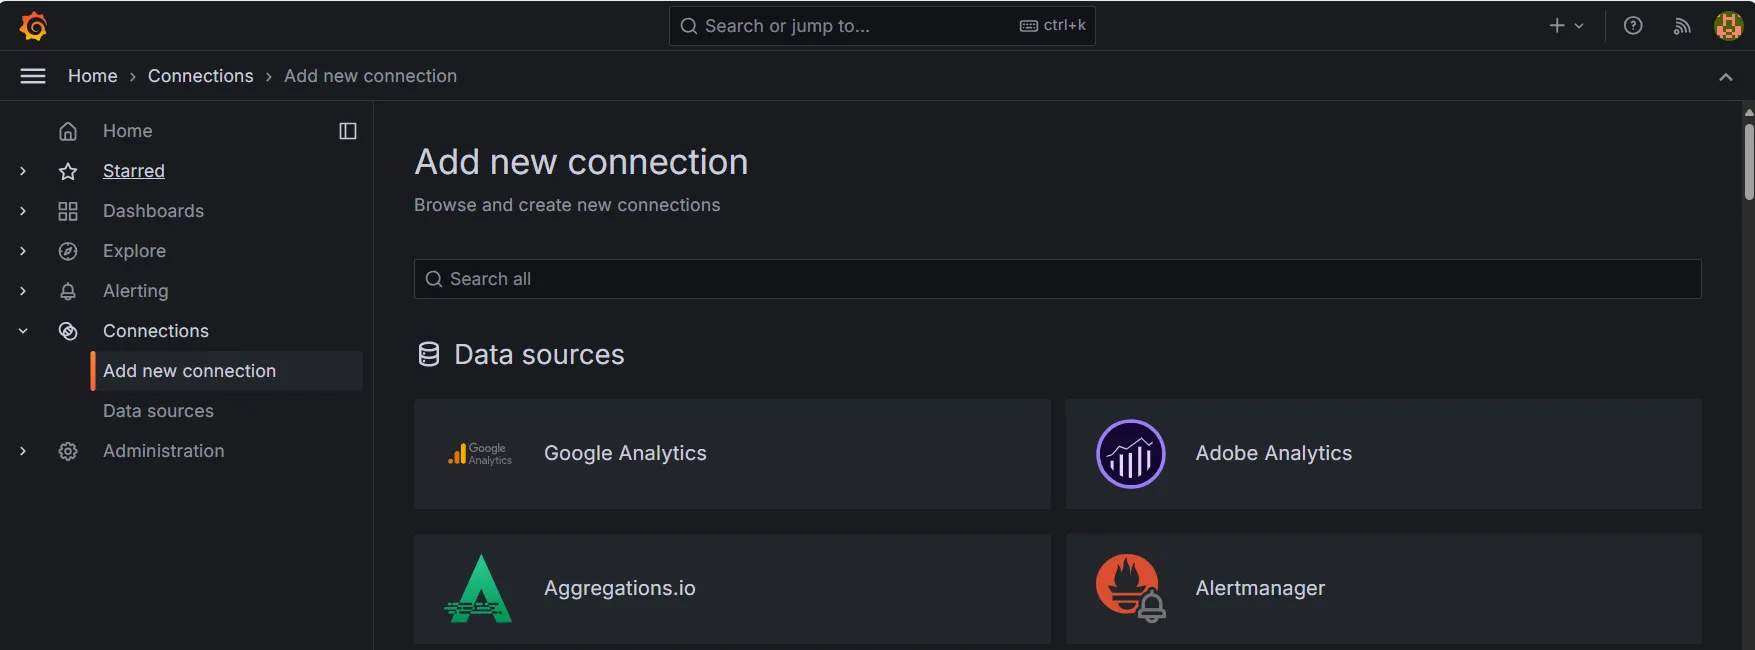
On the navigation menu, click Sources > Add new connection. On this page, you can search for Microsoft SQL Server and select it as your data source.
-
Select Microsoft SQL Server and click Add new data source.

-
Enter a name for the new data source and then enter the following connection settings:
- Host: tds.cdata.com:14333
- Database: enter the Connection Name of the CData Connect AI data source you want to connect to (for example, DB21).
- Username: enter your CData Connect AI username. This is displayed in the top-right corner of the CData Connect AI interface. For example, [email protected].
- Password: enter the PAT you previously generated.
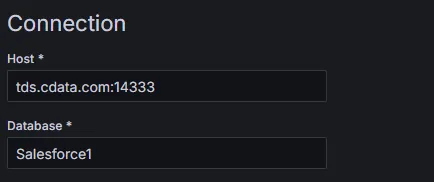
- Click Save & Test. A Database Connect OK message appears when you have a successful connection established.
Create a Dashboard
Once you create the data source for DB2, you can start building dashboards on DB2 data. Start in the navigation menu and click Dashboards
- On the Dashboards page, click + Create dashboard, then click + Add visualization.
-
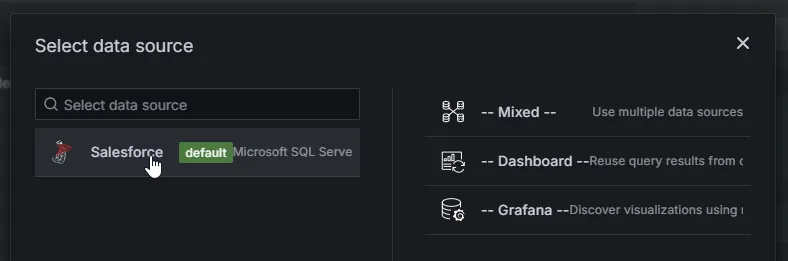
This opens the Select data source window where you can select your created connection.
-
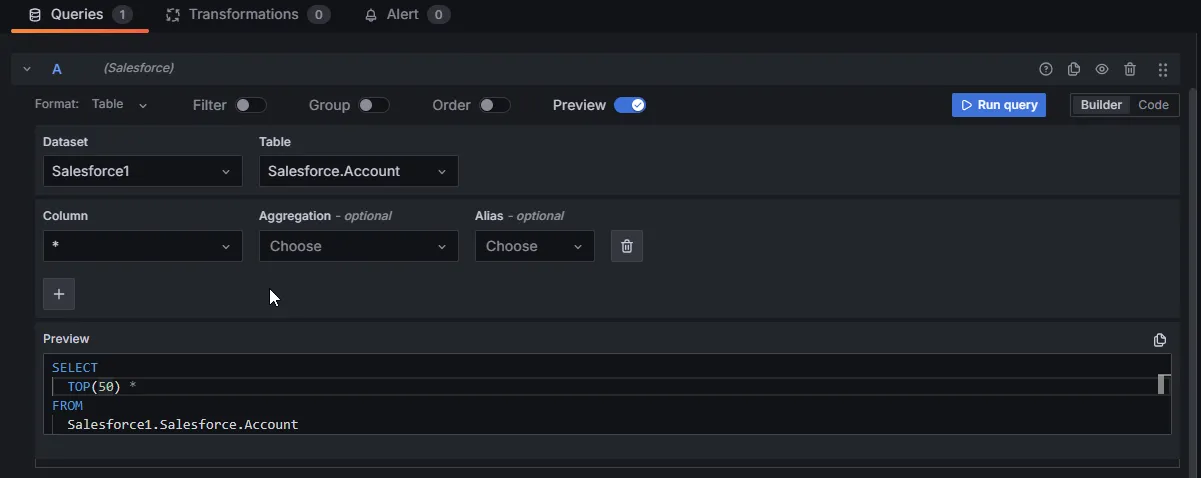
After selecting your connection, you can choose the tables and columns that you want to query for your visualization. Then press Run Query to run the generated query.
-
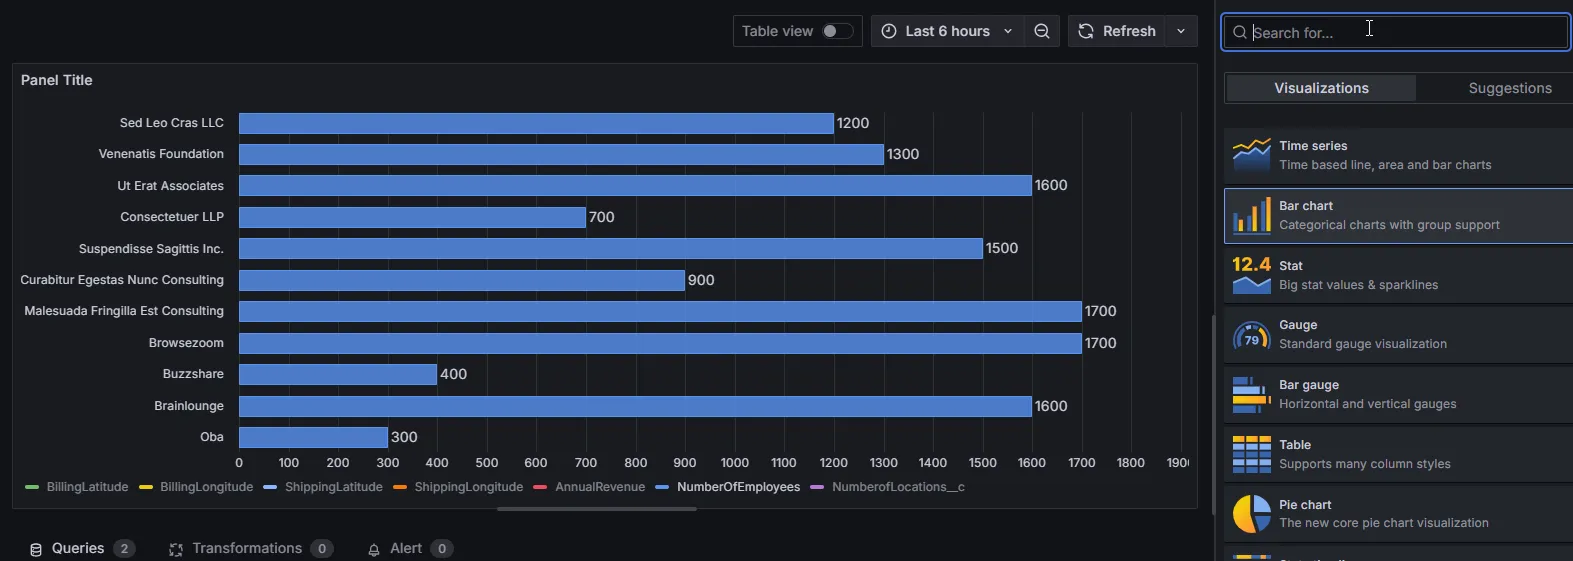
After running your query, the resulting data is populated above the query editor. Here you can select the visualization that you want to use to present your data on the dashboard panel.
- When you have finished editing your panel, you can click Save dashboard to save the changes made to your Dashboard.
To get live data access to hundreds of SaaS, Big Data, and NoSQL sources directly from your cloud applications, try CData Connect AI today!