 CData has recently released a new set of drivers and connectors for Klaviyo, making it easier than ever to connect Klaviyo data with your favorite BI tools, databases, and custom apps. In this blog post, we take a closer look at what this new connectivity means for Klaviyo users, walk through some key features and data model highlights, and share a simple example of how to connect to your Klaviyo data in Power BI Desktop.
What is Klaviyo?
Klaviyo is a marketing automation and customer data platform that helps businesses deliver personalized experiences across email, SMS, and other digital channels. It allows marketers to manage audiences, automate campaigns, and analyze customer behavior within a single, unified platform.
Klaviyo organizes data into key components such as Profiles, Campaigns, Lists, Segments, and Events, each representing a different aspect of the customer journey. This structure enables users to build targeted communications, monitor engagement, and optimize performance based on real-time insights.
With CData Klaviyo Drivers and Connectors, users can easily access and analyze data such as Campaigns, CampaignStats, Lists, Segments, Events, and Profiles using standard SQL. This connectivity makes it simple to integrate Klaviyo marketing data with BI tools, databases, AI applications, and custom solutions for deeper, data-driven decision-making.
CData drivers and connectors for Klaviyo
Connectivity options and available tools
CData’s connectivity solutions for Klaviyo provide simple, seamless access to your marketing data from virtually any data tool, platform, or application.
JDBC Driver: Connects to tools such as DBeaver, DbVisualizer, SQuirreL SQL, MicroStrategy, Sisense, and Yellowfin.
ODBC Driver: Compatible with applications such as Qlik, Alteryx, Microsoft Access, SAP BusinessObjects, SAS, A5 SQL, and SQL Server Linked Servers.
NET Provider: Integrates with .NET environments, including SQL Server Analysis Services and custom .NET applications.
Excel Add-In: Allows direct access to Klaviyo data within Microsoft Excel for seamless reporting and analysis.
Tableau and Power BI Connectors: Enable live connectivity for real-time visualization and analytics.
Python Connector: Provides integration with Python libraries such as pandas, SQLAlchemy, and Dash for advanced analytics and automation.
PowerShell Cmdlets: Offer command-line access to Klaviyo data, ideal for scripting and workflow automation.
Key features
Live access to Klaviyo data: Query data such as Campaigns, CampaignStats, Lists, Segments, Events, and Profiles directly from your tools.
Full SQL-92 support: Work with Klaviyo data using standard SQL queries.
Built-in authentication: Secure access through Klaviyo API Keys and OAuthPKCE.
Broad compatibility: Connect with over 270 BI, analytics, reporting, AI, and data integration tools.
Read and write capabilities: Retrieve and update data in real time for analytics, automation, and data management.
Data model
The CData Klaviyo Power BI Connector exposes your asset data through a relational model. That means you can treat Klaviyo data as if it were a standard SQL database, while maintaining a live connection to your Klaviyo environment. Commonly used data objects include:
Accounts: A table that contains account information (such as Id, name, and organization information) for the current private API key.
Campaigns: A table that stores all campaigns in the account, including campaign ID, name, channel, status, scheduled date, send time, and other metadata
CampaignStats: A table that consists of all the performance metrics for campaigns (e.g., opens, clicks, delivery rates) in read-only view form.
Profiles: A table that stores customer profile data (engagement history, properties, values).
Events: A table that contains lists of event data recorded in the account, such as customer activities and engagement actions.
SegmentStats: A view that tracks the analytics data for segments such as growth and engagement over time.
ProfilesAnalytics: A view that contains the aggregated analytics for customer profiles, including purchase or engagement activity.
Example: Access live Klaviyo data in Power BI
As an example, let’s walk through how to use the CData Klaviyo Power BI Connector in Power BI Desktop to build dashboards that visualize and track your campaign data, such as campaign stats, profiles, lists, segments, or events. You can query Klaviyo data from Power BI in four simple steps (for a full tutorial, check out this Knowledge Base article):
Install the CData Power BI connector: Install the CData Klaviyo Power BI Connector on the machine running Power BI Desktop. You can download a free 30-day trial of the Power BI Connector here.
Connect to Klaviyo: Open the ODBC Administrator (ensure that it matches the bitness of your Power BI installation: 32-bit or 64-bit). Then, configure or create a new DSN using the installed Klaviyo connector.
Enter a Data Source Name, set the Auth Scheme to APIKey, provide your API Key, confirm the schema, and click Test Connection to verify connectivity with your Klaviyo account. Once the connection is successful, click OK to save the DSN configuration.
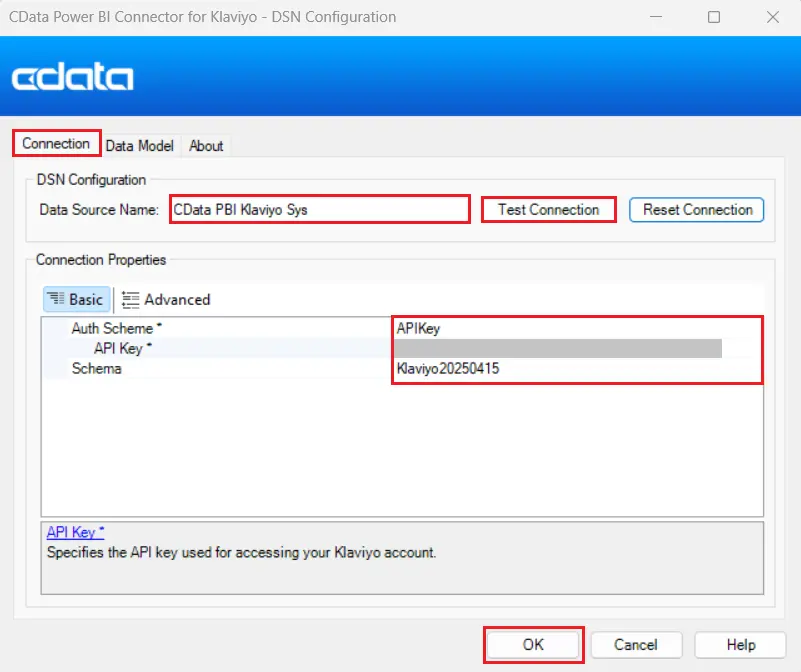
Note: You can read more about the connection properties in our Klaviyo Driver Documentation.
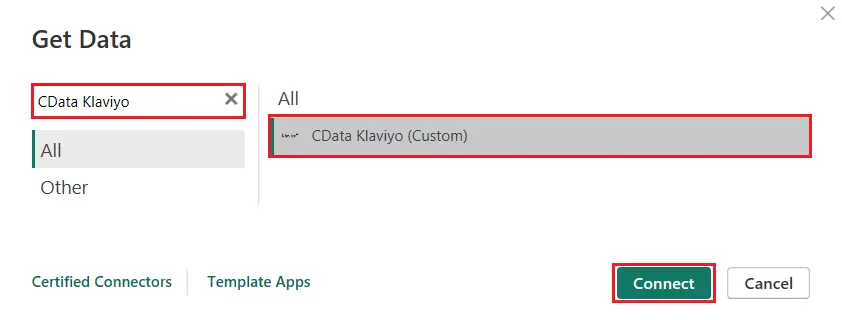
Open Klaviyo connection in Power BI: Launch Power BI Desktop, click Get Data, and search for CData Klaviyo under the "All" option. Select it and click Connect.
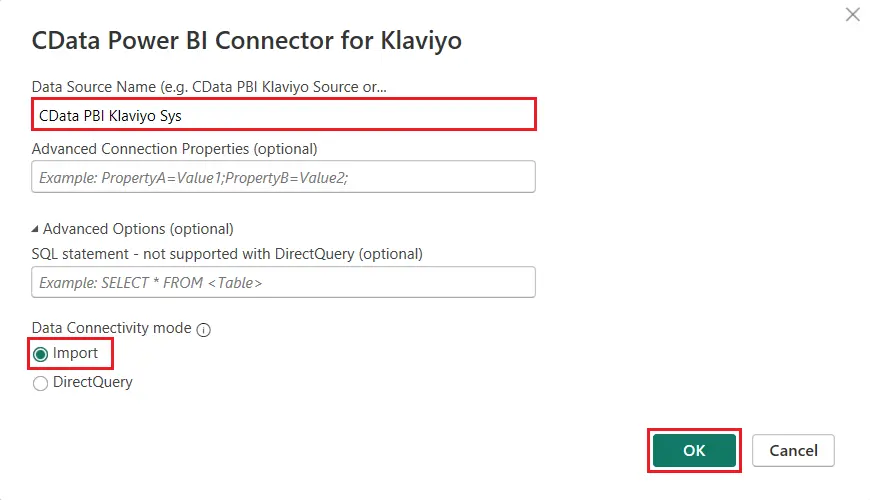
When prompted, enter the DSN name you configured in the previous step.
Choose your preferred Data Connectivity mode (Import or DirectQuery), and then select the tables, such as Accounts, Campaigns, and Events, that you want to work with from the Navigator window.
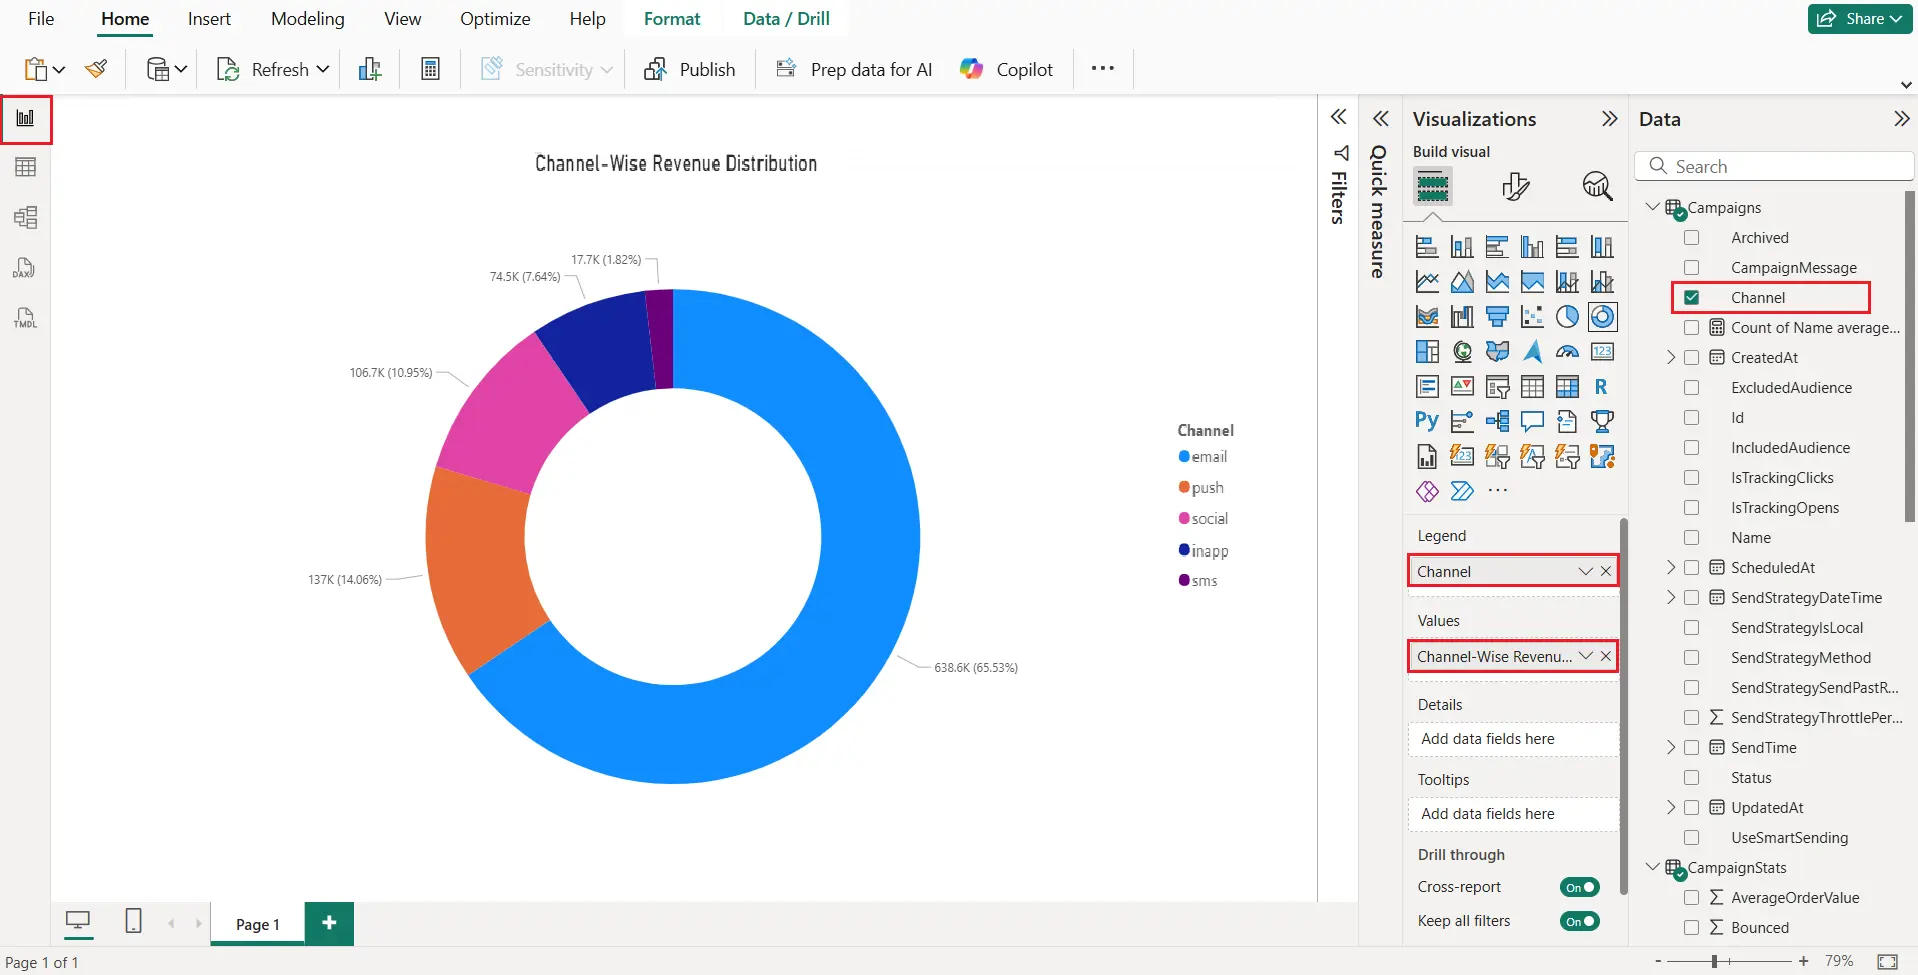
Visualize Klaviyo data in Power BI: Once your Klaviyo data is loaded into Power BI, you can begin creating insightful visualizations in the Report View. Using the connected Campaigns and CampaignStats tables, you can build dashboards that track campaign performance, engagement, and revenue across different marketing channels. In the example below, we created a donut chart to show the distribution of total revenue by channel. The visualization uses:
Each segment of the chart represents a specific marketing channel (such as email, push, social, in-app, or SMS) along with its percentage contribution to total revenue, which helps in identifying which channels drive the most sales and where to focus future marketing efforts.
Simplified Klaviyo connectivity with CData
Check out our other integration guides to see how easy it is to use CData connectivity solutions to work with Klaviyo data exactly where you want. Start connecting to your Klaviyo data — download a free 30-day trial of any of our CData Drivers and Connectors today!
Explore CData Drivers and Connectors
Get blazing fast access to live data for BI, reporting, and integration with seamless connectivity from data sources to the tools you use every day. Our standards-based connectors make data integration effortless—just point, click, and go.


