







Connect to and Visualize Live ChartMogul Data in Tableau Prep

Tableau is a visual analytics platform transforming the way businesses use data to solve problems. When paired with the CData API Driver for Tableau, you can easily get access to live ChartMogul data within Tableau Prep. This article shows how to connect to ChartMogul in Tableau Prep and build a simple chart.
The CData Tableau Connectors enable high-speed access to live ChartMogul data in Tableau. Once you install the connector, you simply authenticate with ChartMogul and you can immediately start building responsive, dynamic visualizations and dashboards. By surfacing ChartMogul data using native Tableau data types and handling complex filters, aggregations, & other operations automatically, CData Tableau Connectors grant seamless access to ChartMogul data.
NOTE: The CData Tableau Connectors support Tableau Prep Builder 2020.4.1 or higher. If you are using an older version of Tableau Prep Builder, you will need to use the CData JDBC Driver.
Install the CData Tableau Connector
When you install the CData Tableau Connector for ChartMogul, the installer should copy the TACO and JAR files to the appropriate directories. If your data source does not appear in the connection steps below, you will need to copy two files:
- Copy the TACO file (cdata.api.taco) found in the lib folder of the connector's installation location (C:\Program Files\CData\CData Tableau Connector for ChartMogul 20XX\lib on Windows) to the Tableau Prep Builder repository:
- Windows: C:\Users\[Windows User]\Documents\My Tableau Prep Repository\Connectors
- MacOS: /Users//Documents/My Tableau Prep Repository/Connectors
- Copy the JAR file (cdata.tableau.api.jar) found in the same lib folder to the Tableau drivers directory, typically [Tableau installation location]\Drivers.
Connect to ChartMogul in Tableau Prep Builder
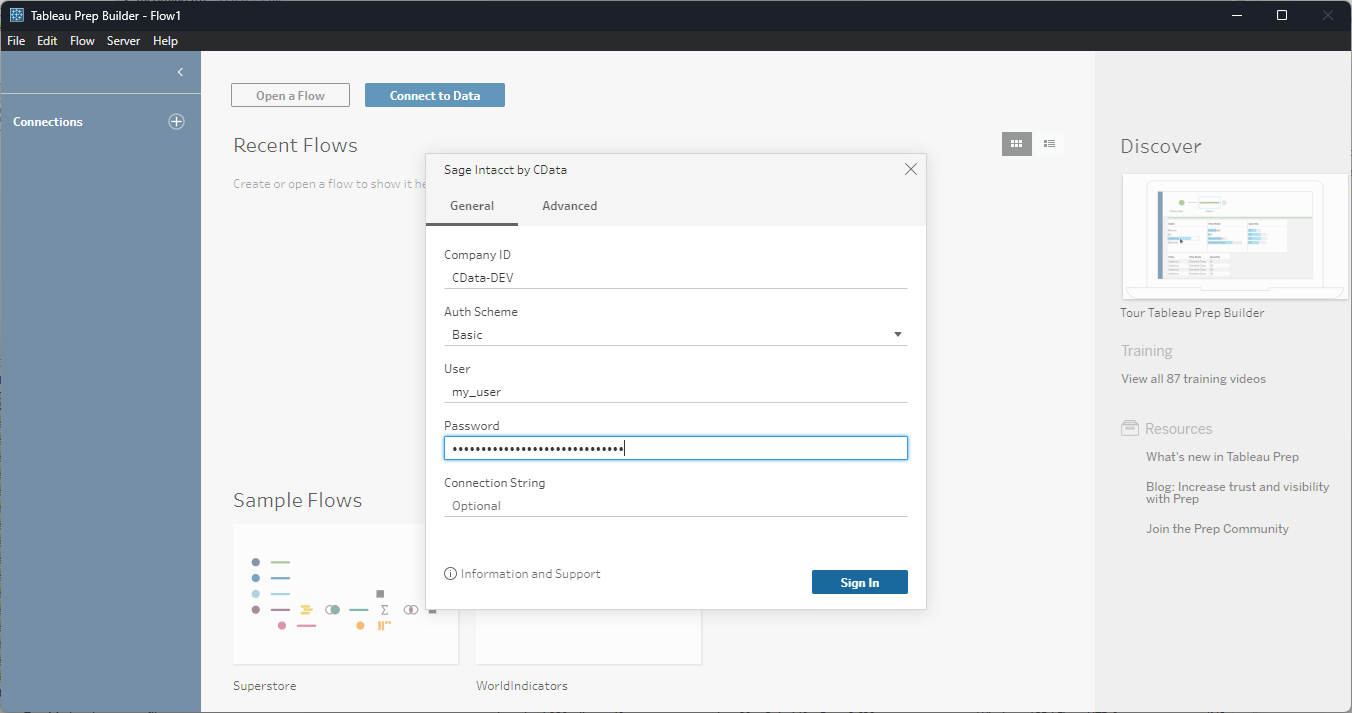
Open Tableau Prep Builder and click "Connect to Data" and search for "ChartMogul by CData." Configure the connection and click "Sign In."
Start by setting the Profile connection property to the location of the ChartMogul Profile on disk (e.g. C:\profiles\Chartmogul.apip). Next, set the ProfileSettings connection property to the connection string for ChartMogul (see below).
ChartMogul API Profile Settings
Log into your ChartMogul account, navigate to Settings > API Keys, and click Add API Key to generate a new key.
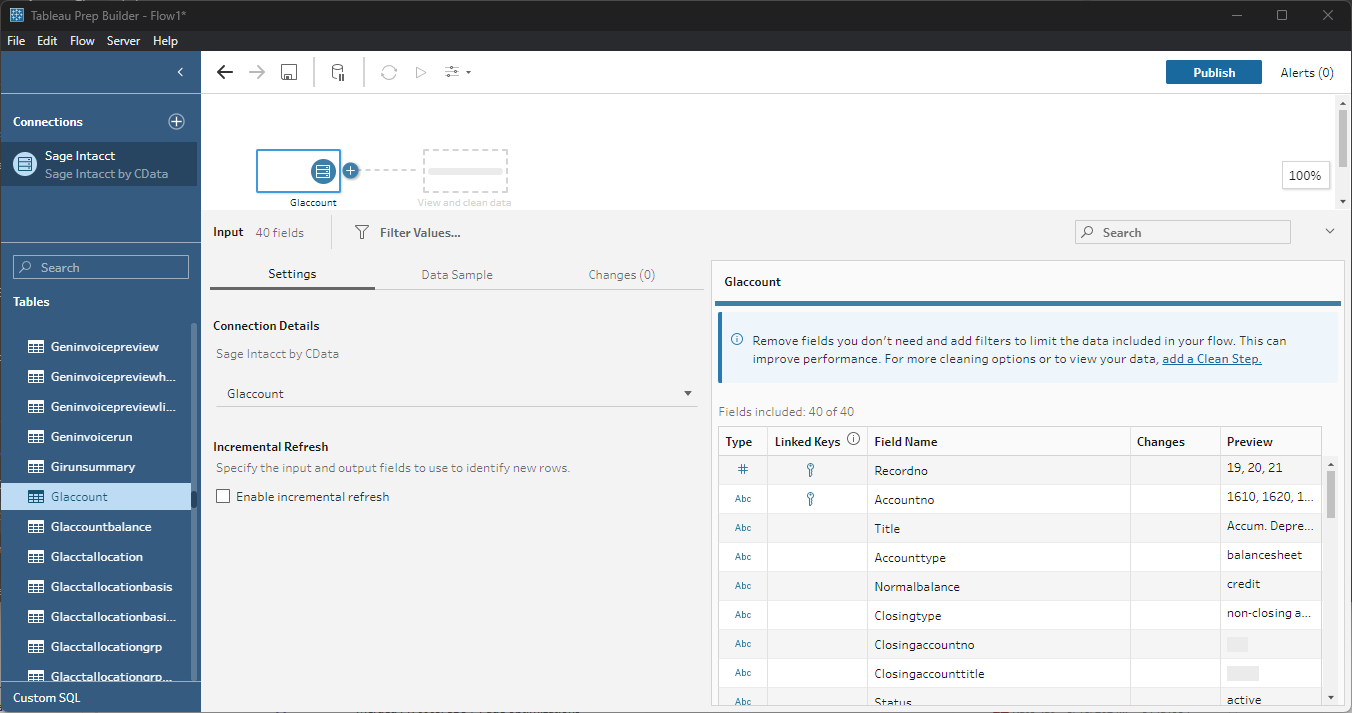
Discover and Prep Data
Drag the tables and views you wish to work with onto the canvas. You can include multiple tables.
Data Cleansing & Filtering
To further prepare the data, you can implement filters, remove duplicates, modify columns and more.
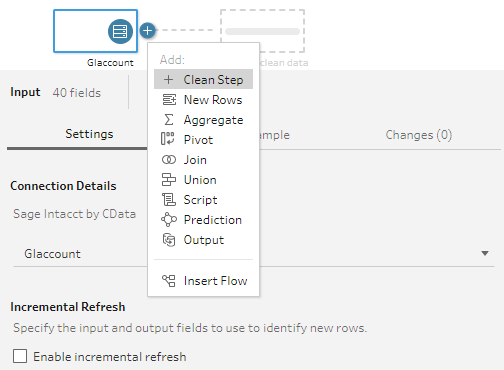
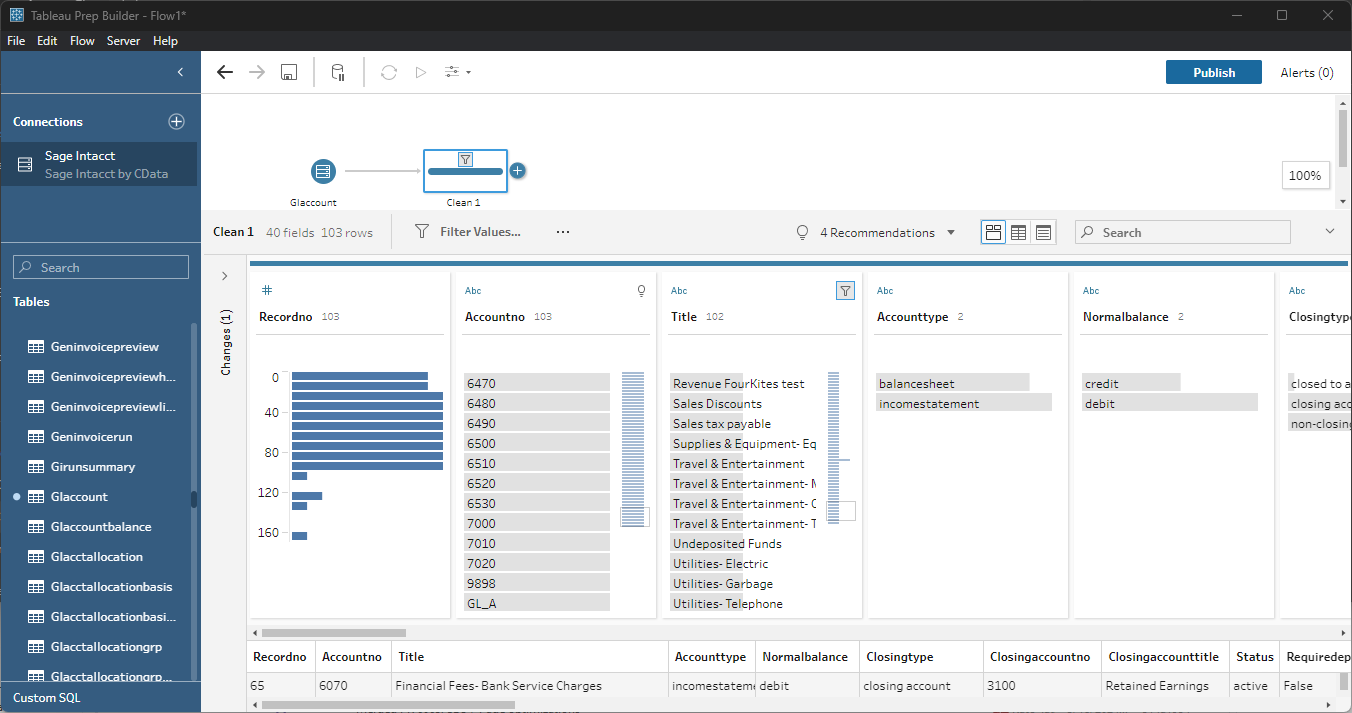
- Start by clicking on the plus next to your table and selecting the Clean Step option.
- Select the field values to filter by. As you select values, you can see how your selections impact other fields.
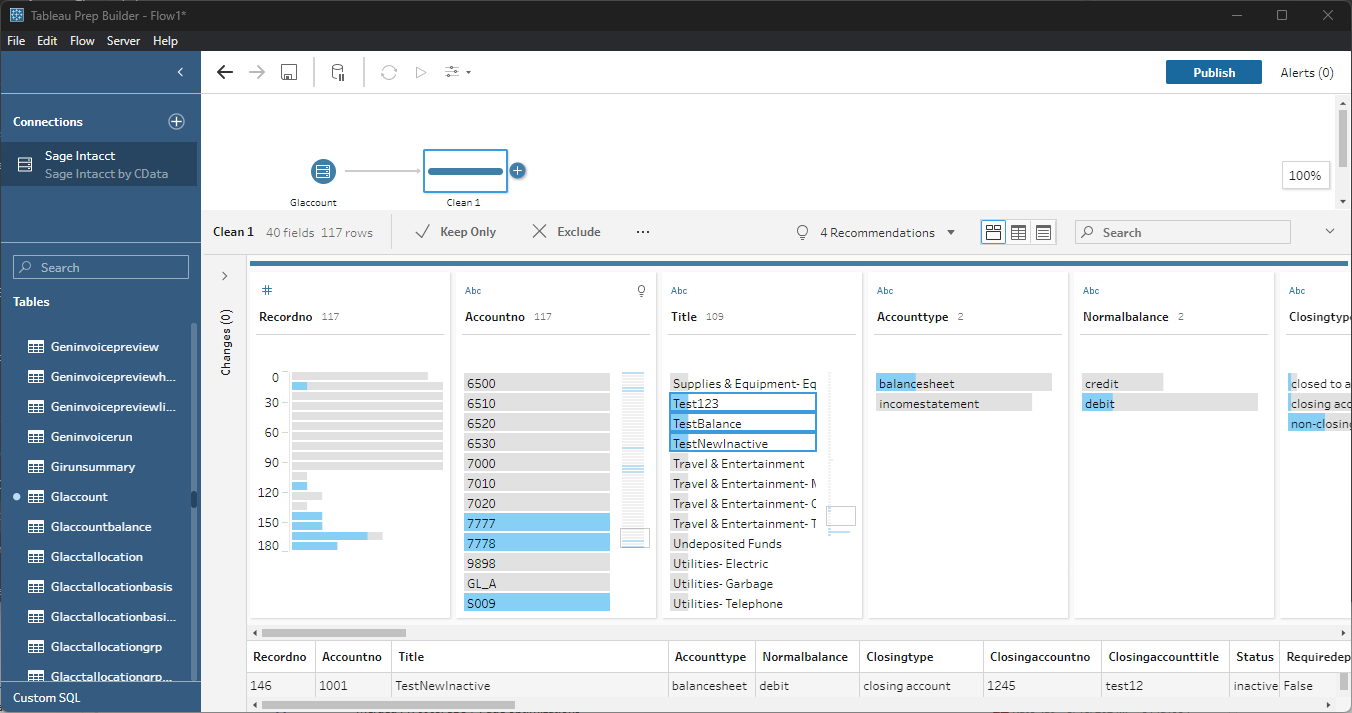
- Opt to "Keep Only" or "Exclude" entries with your select values and the data changes in response.
Data Joins and Unions
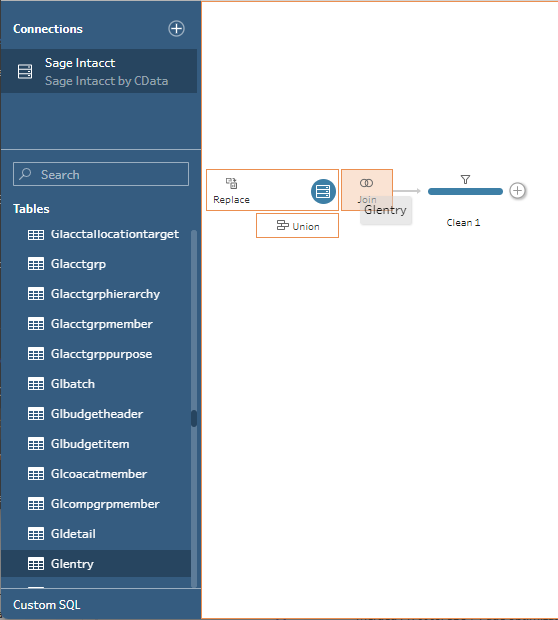
Data joining involves combining data from two or more related tables based on a common field or key.
- To join multiple tables, drag a related table next to an existing table in the canvas and place it in the Join box.
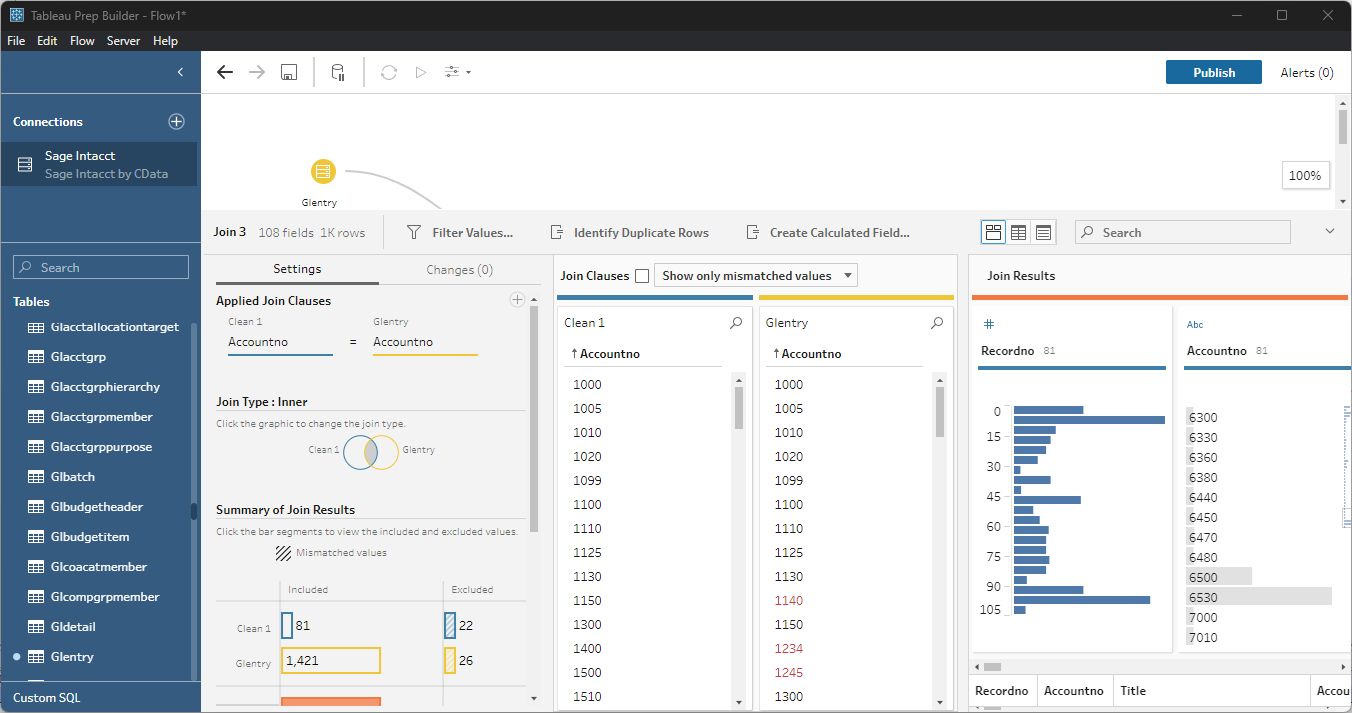
- Select the foreign keys that exist in both tables.
Exporting Prepped Data
After you perform any cleansing, filtering, transformations, and joins, you can export the data for visualization in Tableau.
- Add any other needed transformations then insert an Output node at the end of the flow.
- Configure the node to save to a file in the format of your choice.
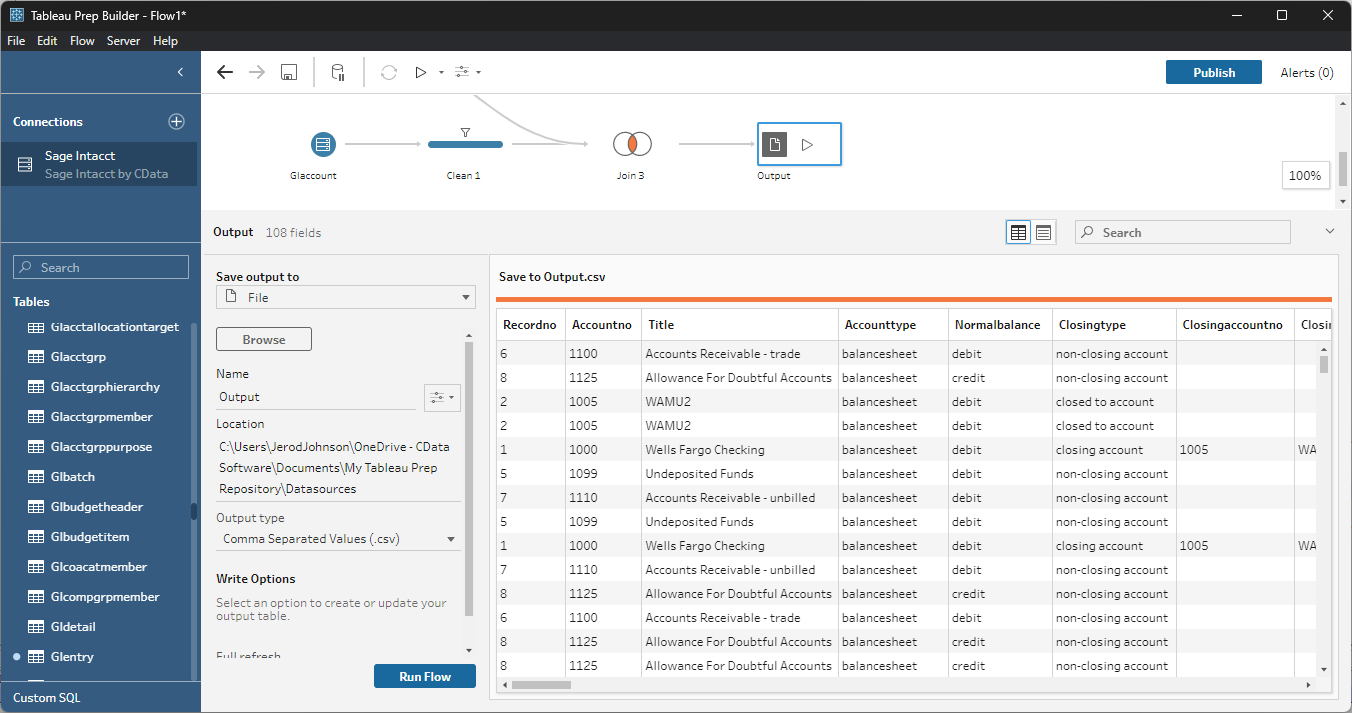
Once the output data is saved, you can work with it in Tableau, just like you would any other file source.
Using the CData API Driver for Tableau with Tableau Prep Builder, you can easily join, cleanse, filter, and aggregate ChartMogul data for visualizations and reports in Tableau. Download a free, 30-day trial and get started today.