







How to Visualize Zendesk Data in Python with pandas via CData Connect AI

The rich ecosystem of Python modules lets you get to work quickly and integrate your systems more effectively. With the CData Connect AI Python SDK, the pandas and Matplotlib modules, you can build Zendesk-connected Python applications and scripts for visualizing Zendesk data. This article shows how to connect to Connect AI and use the pandas and Matplotlib built-in functions to query Zendesk data and visualize the results.
The Connect AI Python SDK (cdata-connect-ai) is a DB-API 2.0 (PEP 249) compliant client, so pandas can read query results directly from the SDK connection object. There is no driver to install per source and no SQLAlchemy engine to configure: connect with a Personal Access Token and pass the connection straight to pandas.read_sql.
Connect to Zendesk in Connect AI
CData Connect AI uses a straightforward, point-and-click interface to connect to data sources.
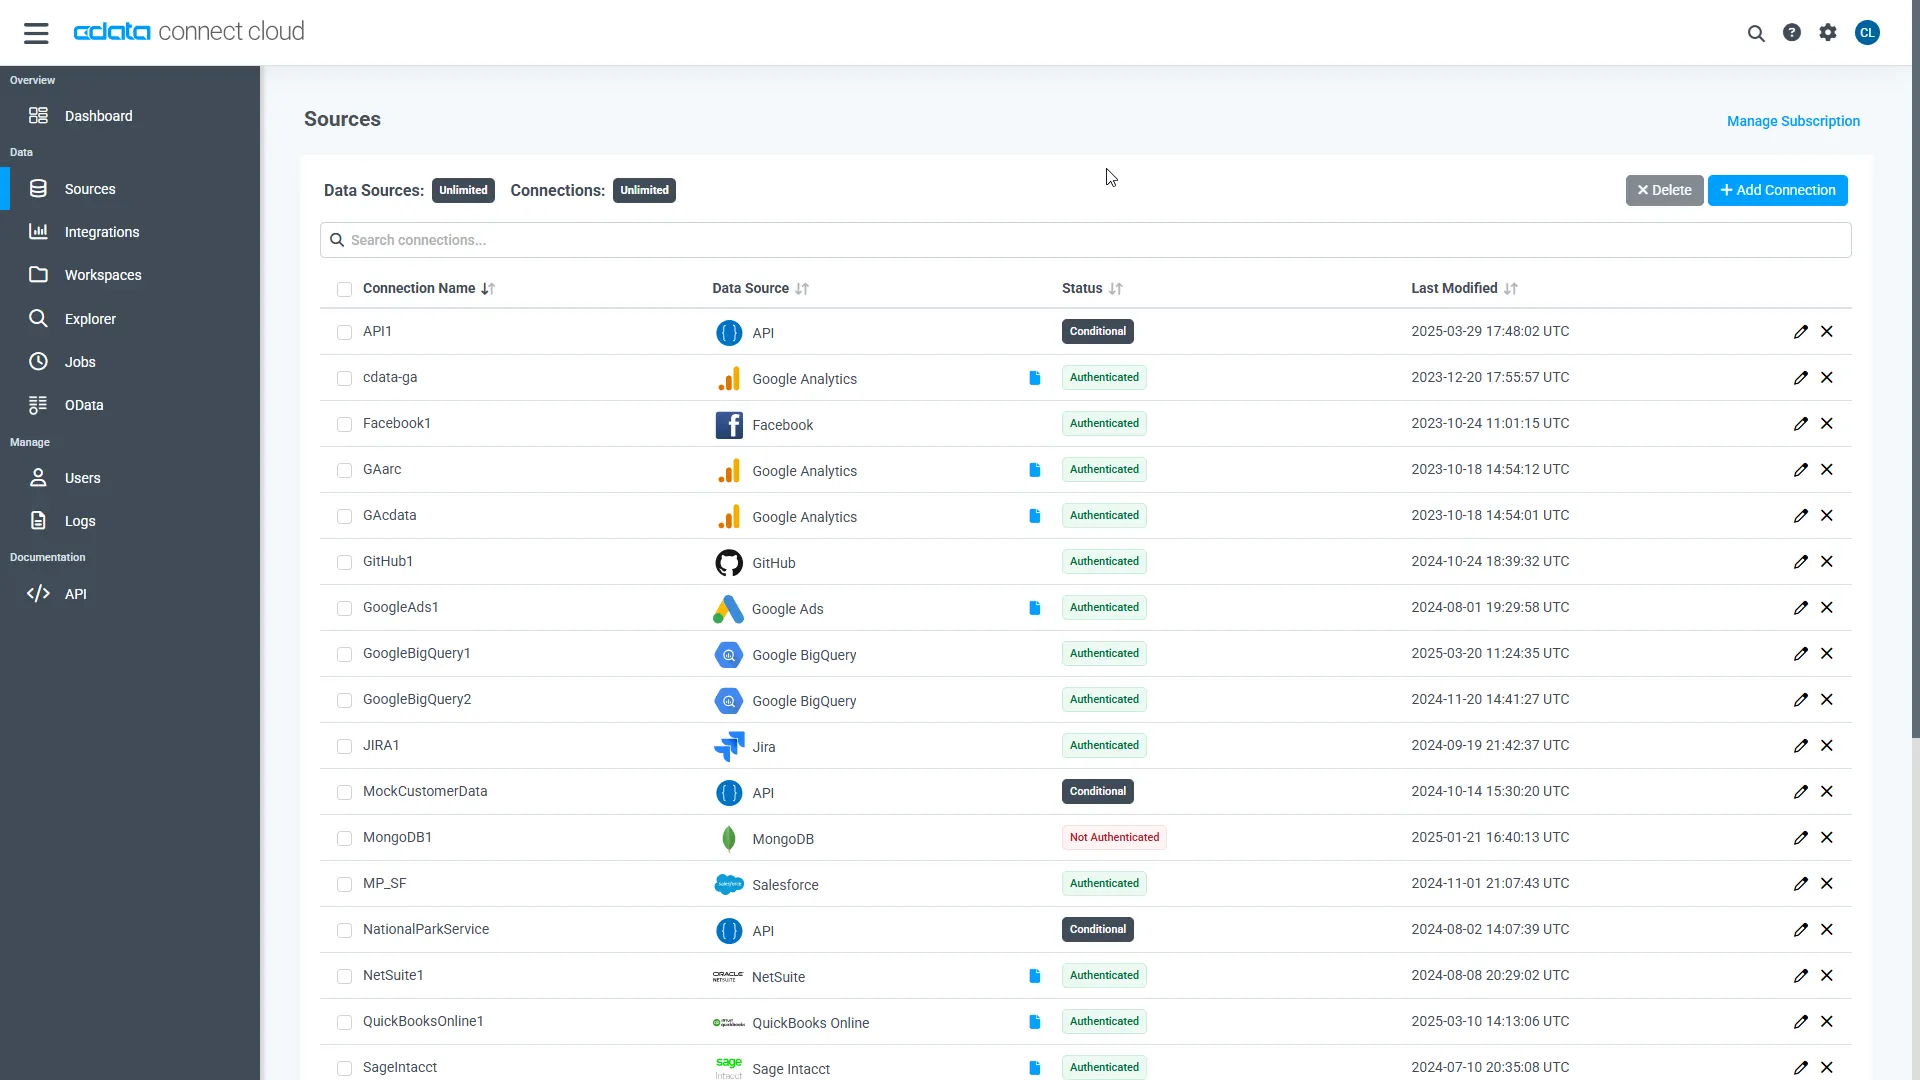
- Log into Connect AI, click Sources, and then click Add Connection
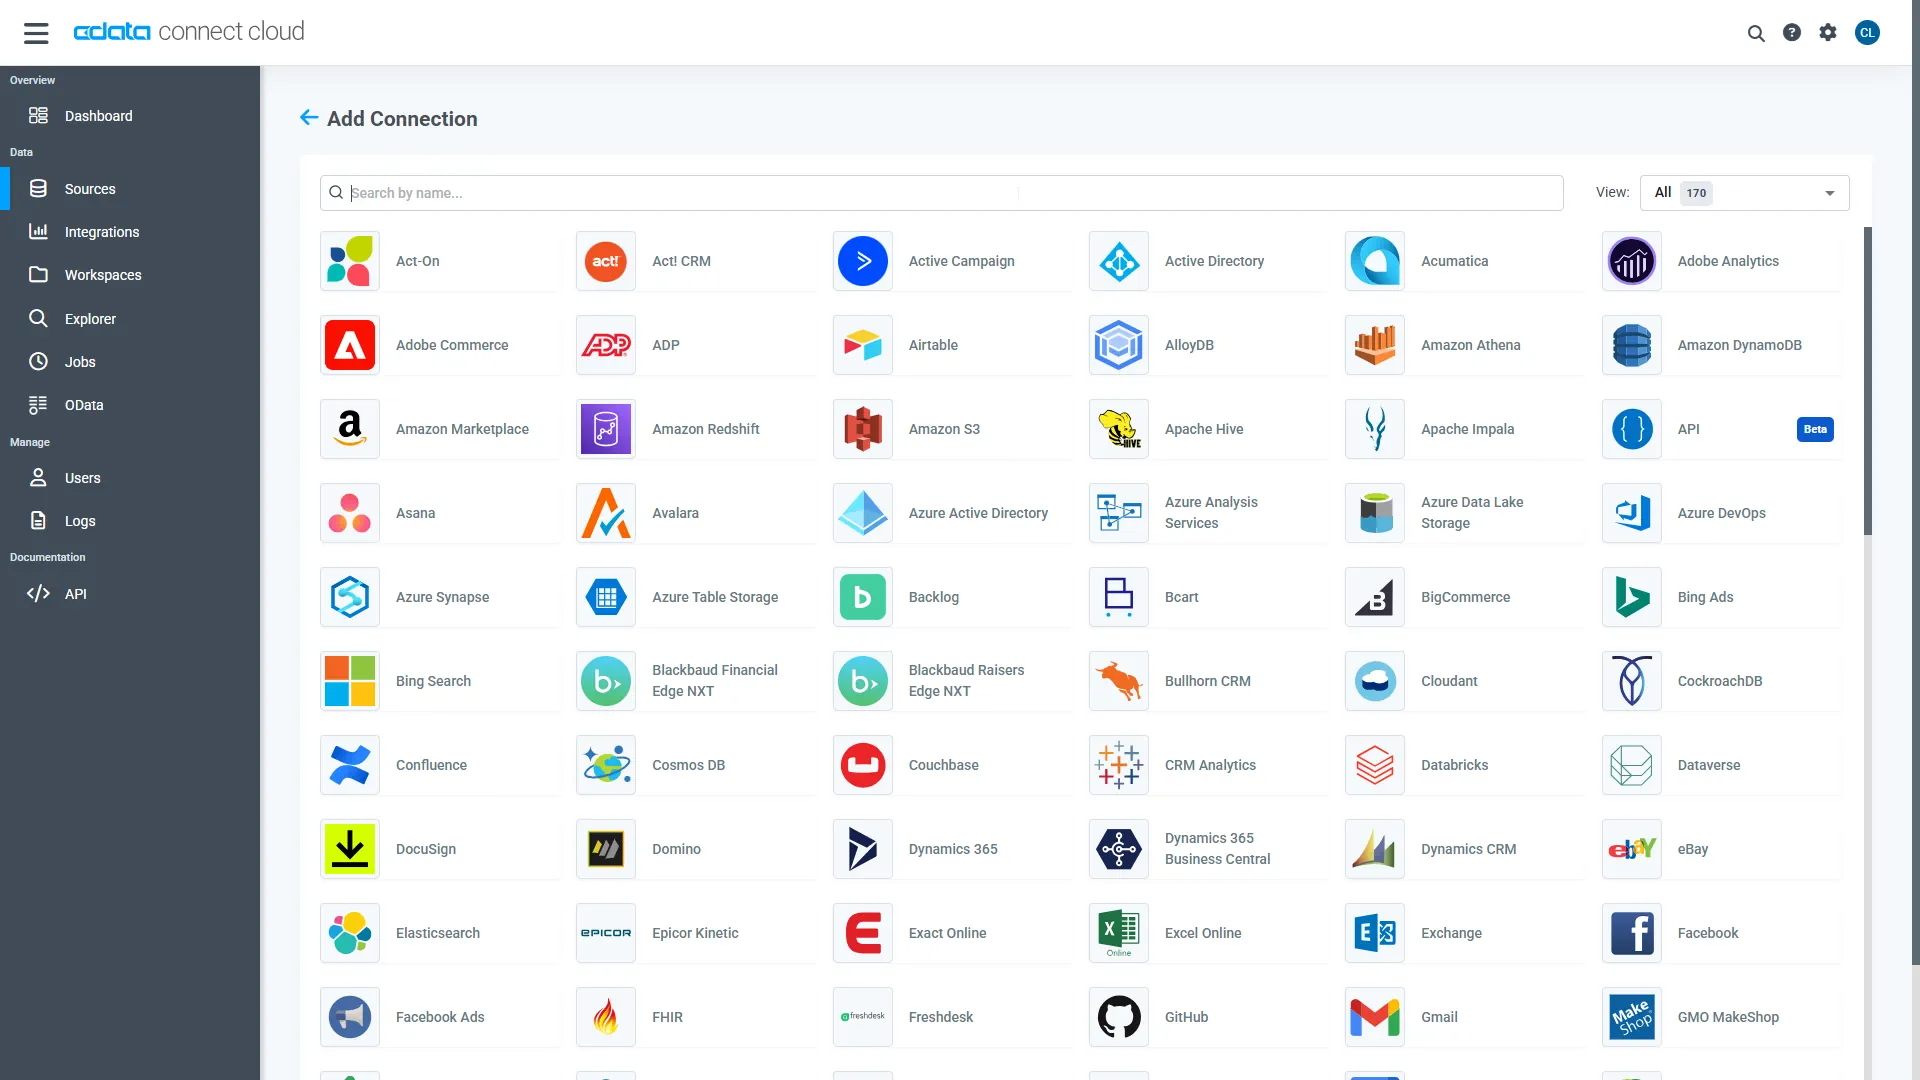
- Select "Zendesk" from the Add Connection panel
-
Enter the necessary authentication properties to connect to Zendesk.
Connecting to Zendesk
To connect, set the URL and provide authentication. The URL is your Zendesk Support URL: https://{subdomain}.zendesk.com.
Authenticating to Zendesk
You can authenticate using the Basic or OAuth methods.
Using Basic Authentication
To use Basic authentication, specify your email address and password or your email address and an API token. Set User to your email address and follow the steps below to provide the Password or ApiToken.
- Enable password access in the Zendesk Support admin interface at Admin > Channels > API.
- Manage API tokens in the Zendesk Support Admin interface at Admin > Channels > API. More than one token can be active at the same time. Deleting a token deactivates it permanently.
Using OAuth Authentication
See the Getting Started guide in the CData driver documentation for an authentication guide.
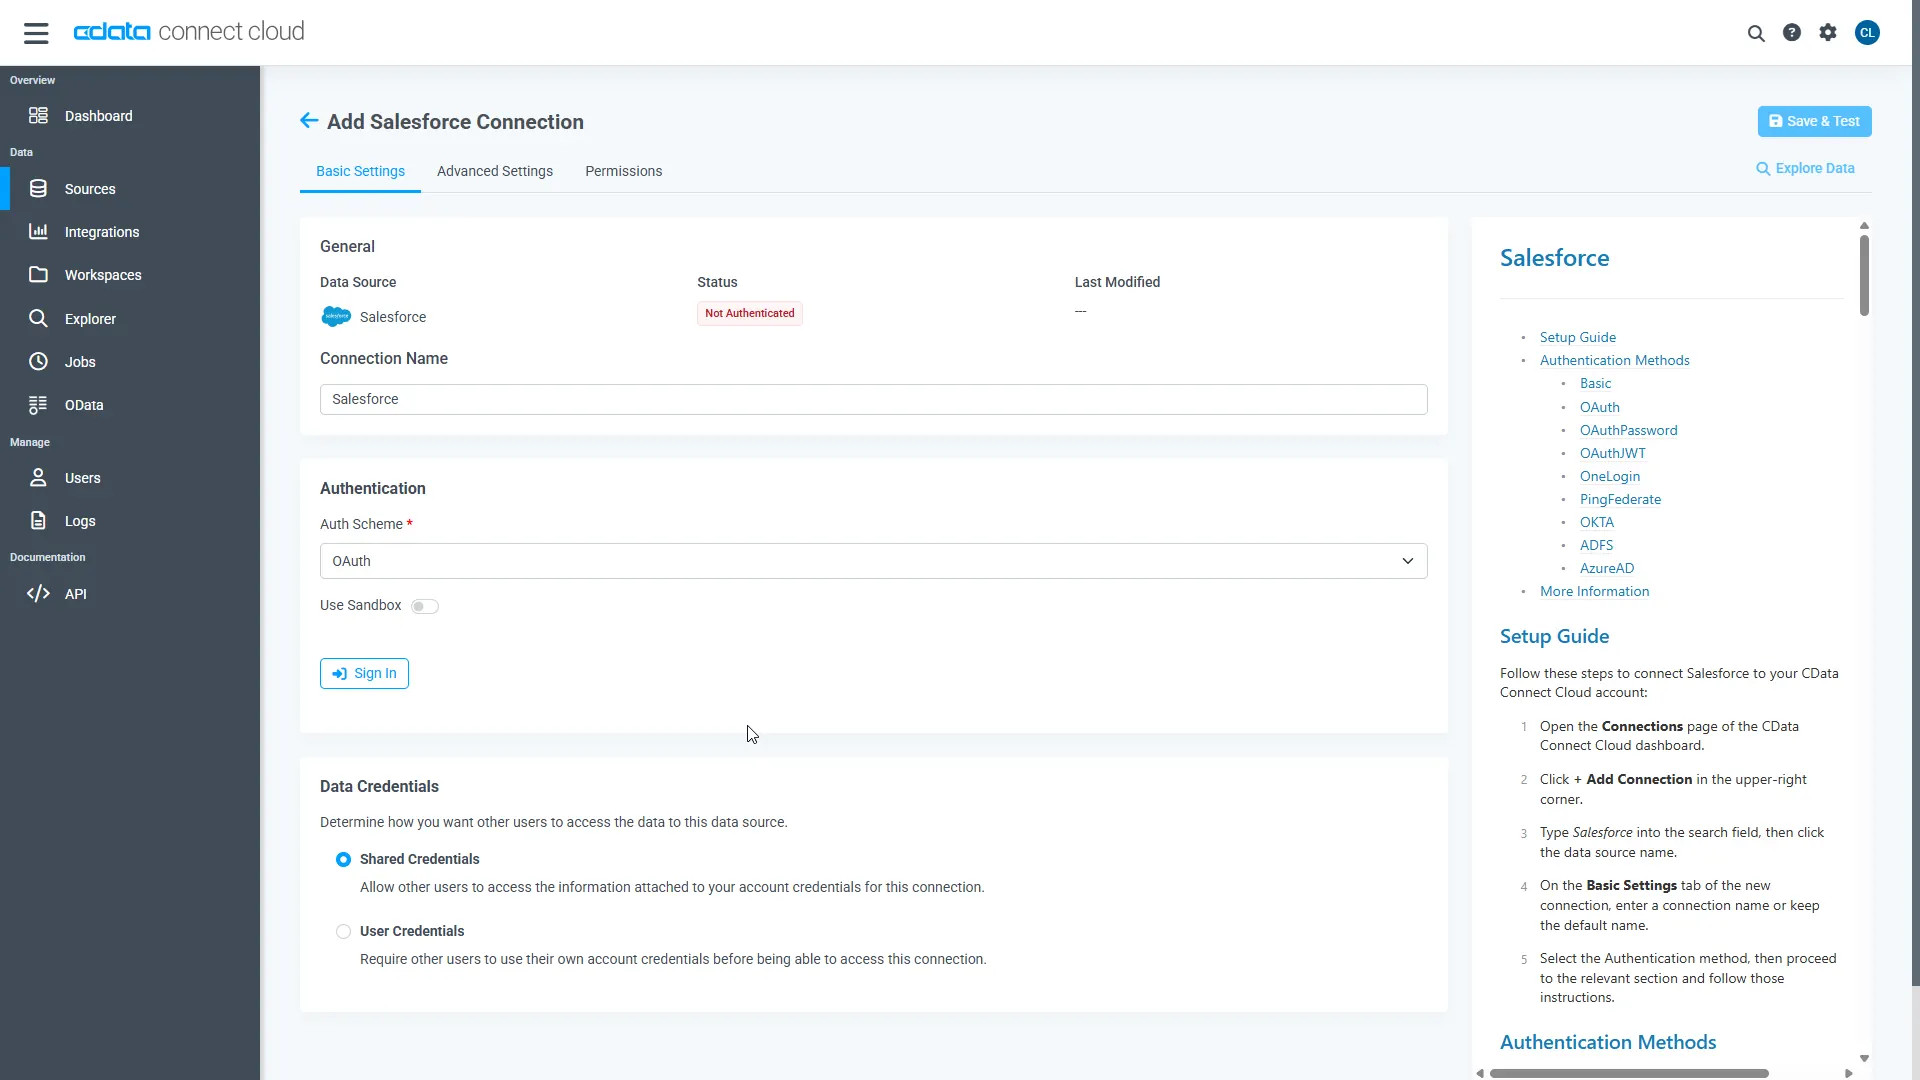
- Click Save & Test
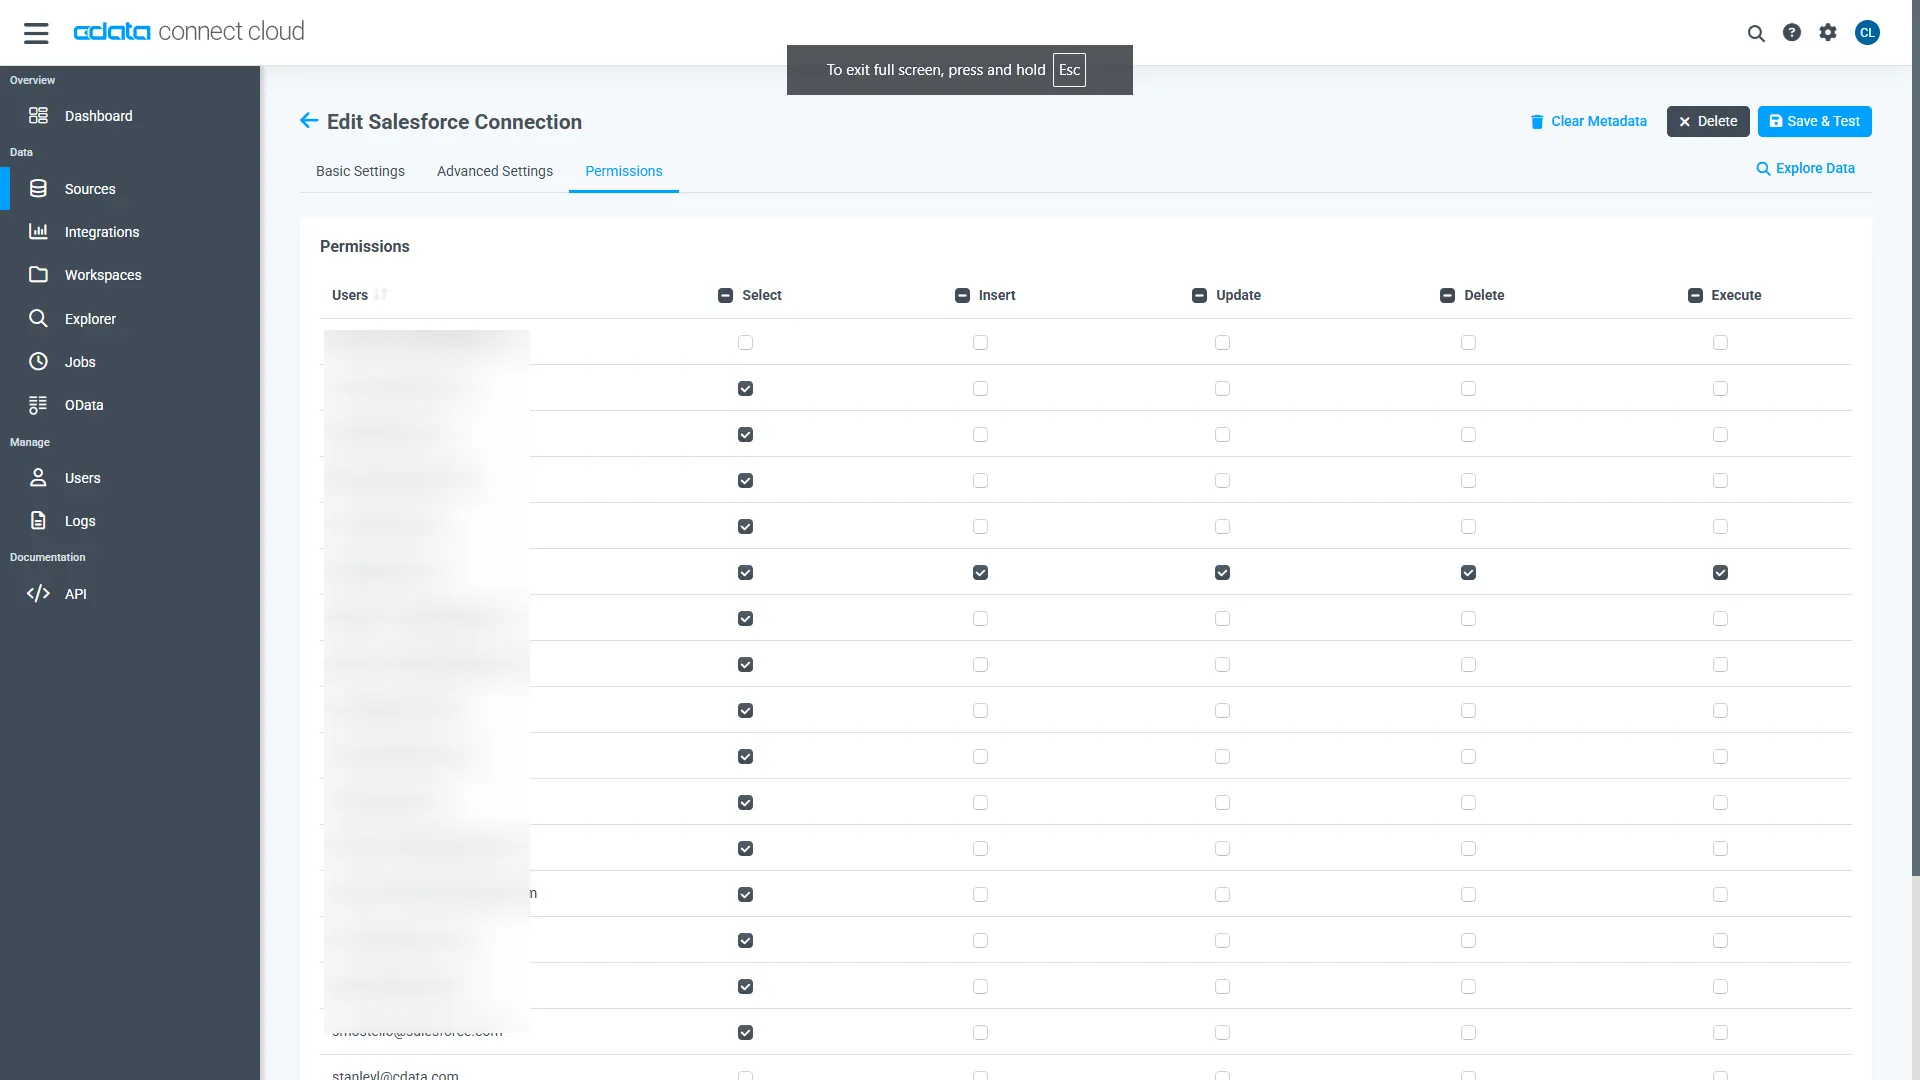
- Navigate to the Permissions tab and update the user-based permissions.
Generate a Personal Access Token (PAT)
The Python SDK authenticates to Connect AI with your account email and a Personal Access Token (PAT). It is best practice to create a separate PAT for each application to maintain granularity of access.
- Click the Gear icon () at the top right of the Connect AI app to open the Settings page.
- On the Settings page, go to the Access Tokens section and click Create PAT.
- Give the PAT a name and click Create.
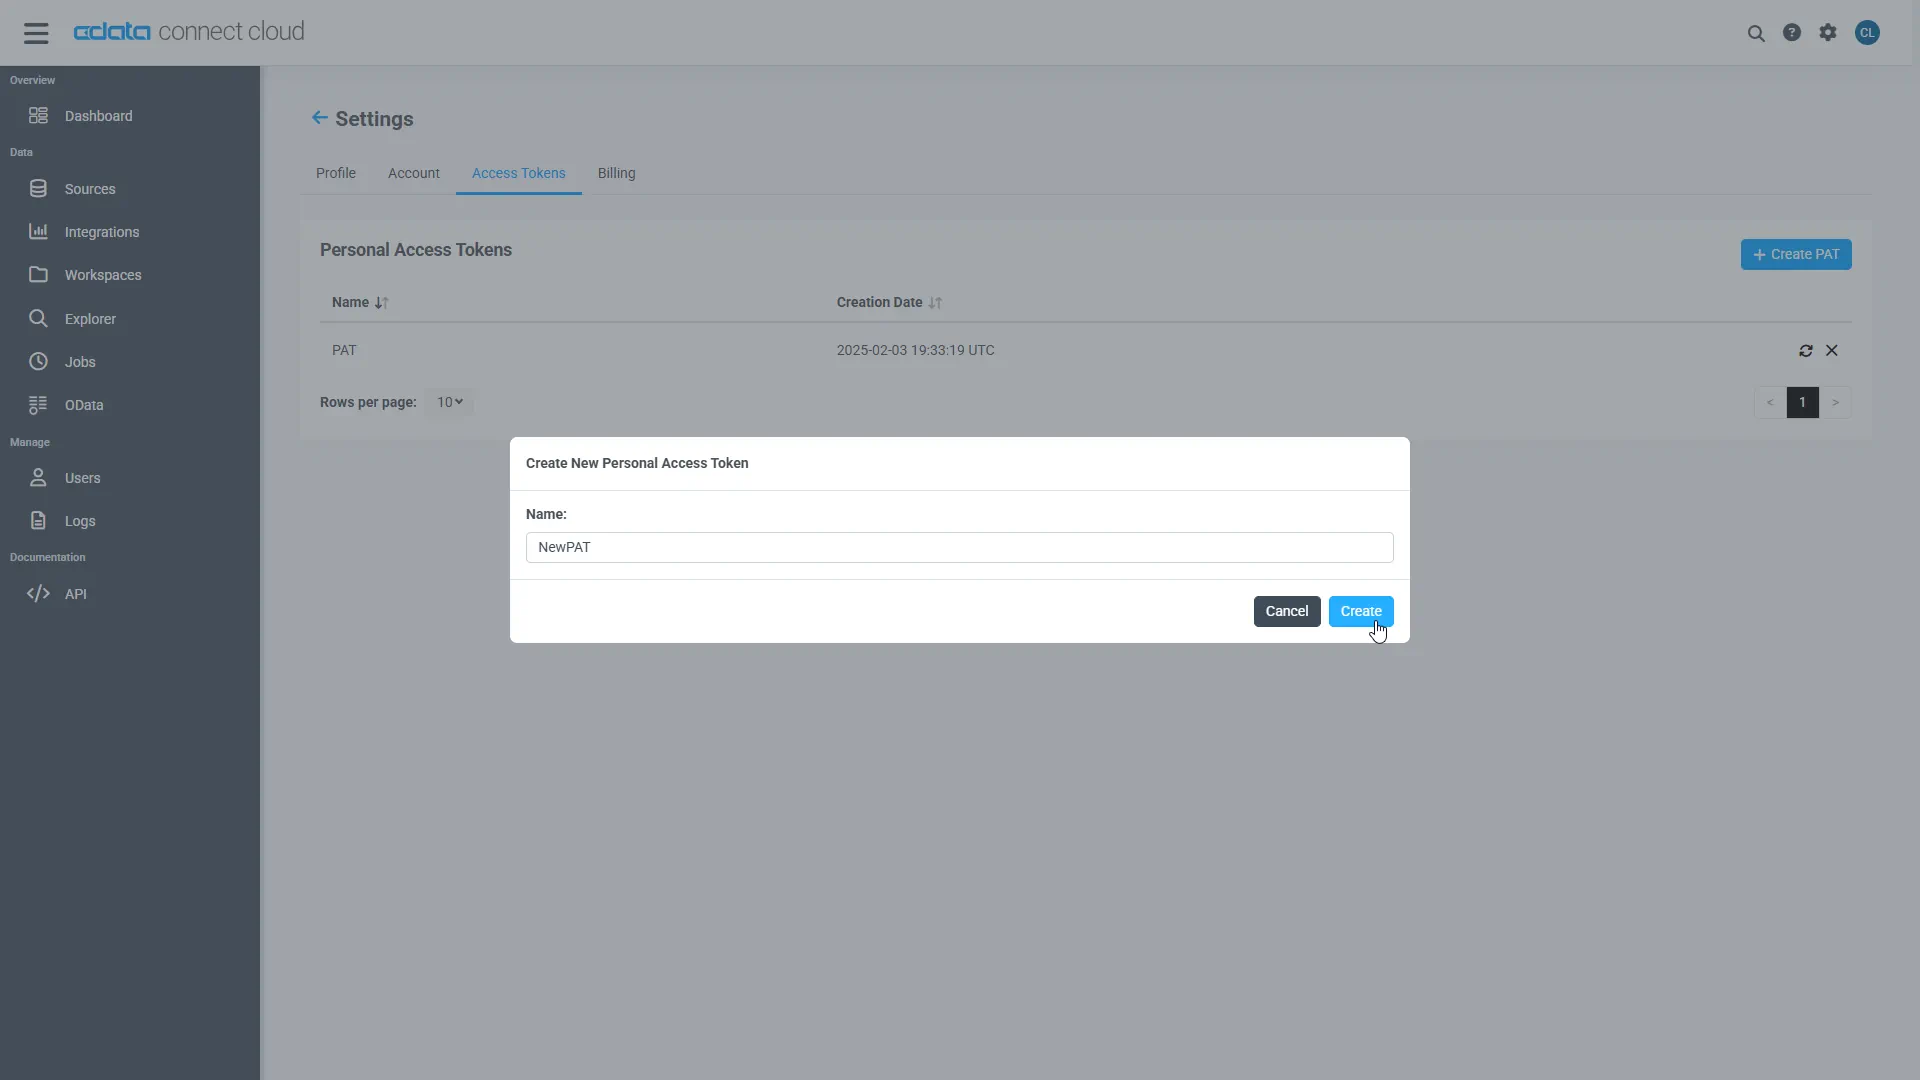
- The PAT is only visible at creation, so copy it and store it securely.
Install Required Modules
Install the SDK (with the pandas extra) and Matplotlib using the pip utility:
pip install "cdata-connect-ai[full]"
pip install matplotlib
Visualize Zendesk Data in Python
Import the modules, then connect to Connect AI with your account email and PAT. Identifiers are three-part: <Connection>.<Schema>.<Table>, where the connection name defaults to the source name (for example, Zendesk1).
import pandas
import matplotlib.pyplot as plt
import cdata_connect_ai

conn = cdata_connect_ai.connect(
    username="[email protected]",
    password="<your_pat>",
)
Query Zendesk with pandas
Use the read_sql function from pandas to execute a SQL statement and store the result set in a DataFrame. Pass the SDK connection directly, no engine required.
df = pandas.read_sql(
    "SELECT Id, Subject "
    "FROM [Zendesk1].[Zendesk].[Tickets] "
    "WHERE Industry = 'Floppy Disks'",
    conn,
)
Note: pandas may print a UserWarning stating that it only officially supports SQLAlchemy connectables. This is expected when passing a DB-API connection directly—the query runs correctly and the warning is safe to ignore.
Visualize Zendesk Data
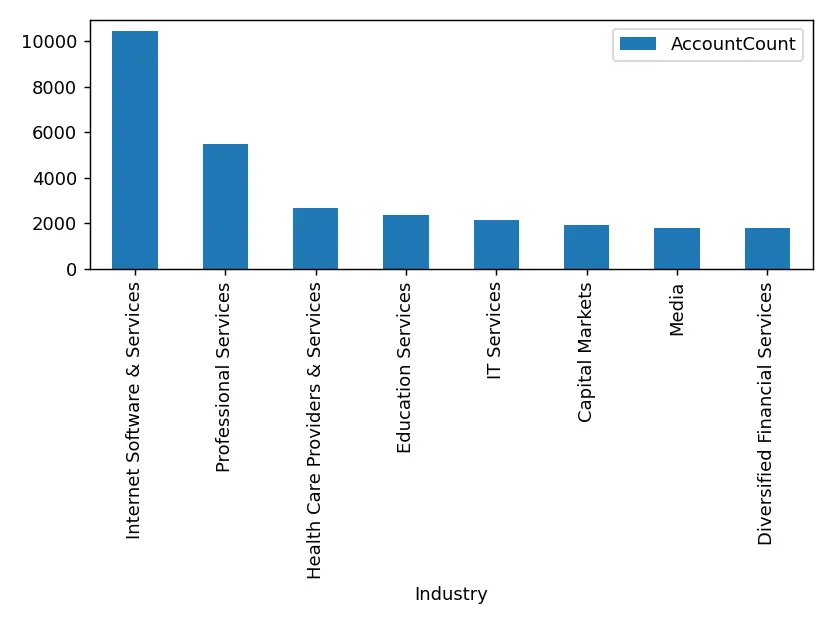
With the query results stored in a DataFrame, use the plot function to build a chart. The show method displays the chart in a new window.
df.plot(kind="bar", x="Id", y="Subject")
plt.show()

conn.close()
More Information and Free Trial
Now you can read live Zendesk data into pandas through the CData Connect AI Python SDK. For more information on connecting to Zendesk (and hundreds of other data sources), visit the Connect AI page. Sign up for a free trial and start working with live Zendesk data in Python.
Full Source Code
import pandas
import matplotlib.pyplot as plt
import cdata_connect_ai

conn = cdata_connect_ai.connect(
    username="[email protected]",
    password="<your_pat>",
)

df = pandas.read_sql(
    "SELECT Id, Subject "
    "FROM [Zendesk1].[Zendesk].[Tickets] "
    "WHERE Industry = 'Floppy Disks'",
    conn,
)

df.plot(kind="bar", x="Id", y="Subject")
plt.show()

conn.close()