Discover how a bimodal integration strategy can address the major data management challenges facing your organization today.
Get the Report →Building Dynamic D3.js Apps with Database Data
D3.js is a JavaScript library for producing dynamic, interactive data visualizations in Web browsers, using the widely implemented SVG, HTML5, and CSS standards. The CData API Server enables you to generate REST APIs for 80+ data sources, including both on-premises and cloud-based databases. This article walks through setting up the CData API Server to create a REST API for a SQLite database and creating a simple D3.js Web application that has live access to the database data. The D3.js app dynamically builds a simple bar chart based on the database data. While the article steps through most of the code, you can download the sample project and SQLite database to see the full source code and test the functionality for yourself.
Setting Up the API Server
If you have not already done so, download the CData API Server. Once you have installed the API Server, follow the steps below to run the application, configure the application to connect to your data (the instructions in this article are for the included sample database), and then configure the application to create a REST API for any tables you wish to access in your D3 app.
Enable CORS
If the D3 Web app and API Server are on different domains, the D3 library will generate cross-domain requests. This means that CORS (cross-origin resource sharing) must be enabled on any servers queried by D3 Web apps. You can enable CORS for the API Server on the Server tab in the SETTINGS page:
- Click the checkbox to enable cross-origin resource sharing (CORS).
- Either click the checkbox to allow all domains without '*' or specify the domains that are allowed to connect in Access-Control-Allow-Origin.
- Set Access-Control-Allow-Methods to "GET,PUT,POST,OPTIONS".
- Set Access-Control-Allow-Headers to "authorization".
- Click Save Changes.
Configure Your Database Connection
Follow the steps below to configure the API Server to connect to your database:
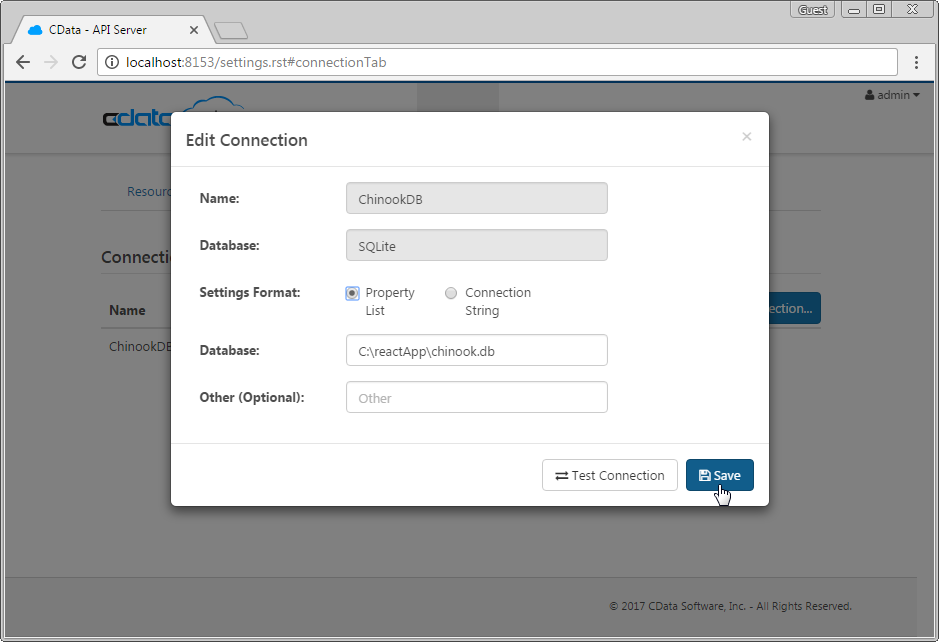
- Navigate to the Connections tab on the SETTINGS page.
- Click Add Connection.
- Configure the connection in the resulting dialog: Name your connection, select SQLite as the database, and fill the Database field with the full path to the SQLite database (the included database is chinook.db from the SQLite Tutorial).
Configure a User
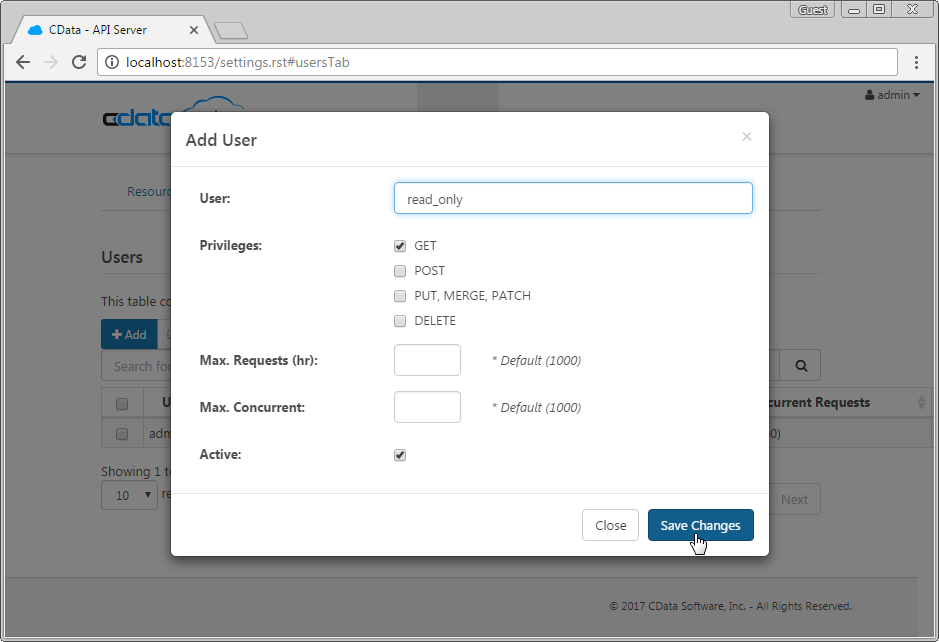
Next, create a user to access your database data through the API Server. You can add and configure users on the Users tab of the SETTINGS page. In this simple D3 app for viewing data, create a user that has read-only access: Click Add, give the user a name, select GET for the Privileges, and click Save Changes.
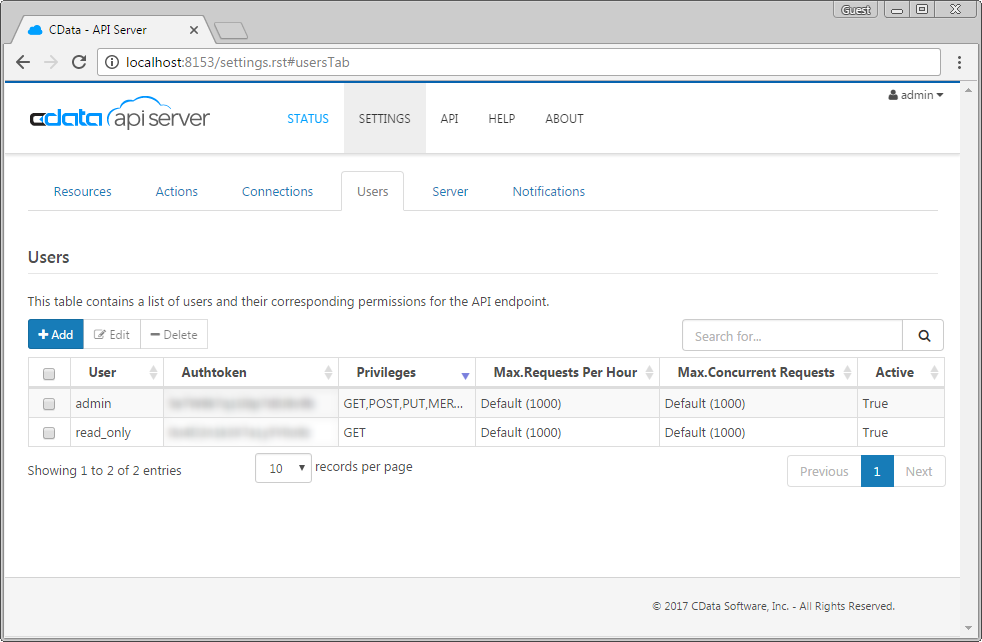
An authtoken is then generated for the user. You can find authtokens and other information for each user on the Users tab:
Accessing Tables
Having created a user, you are ready to enable access to the database tables:
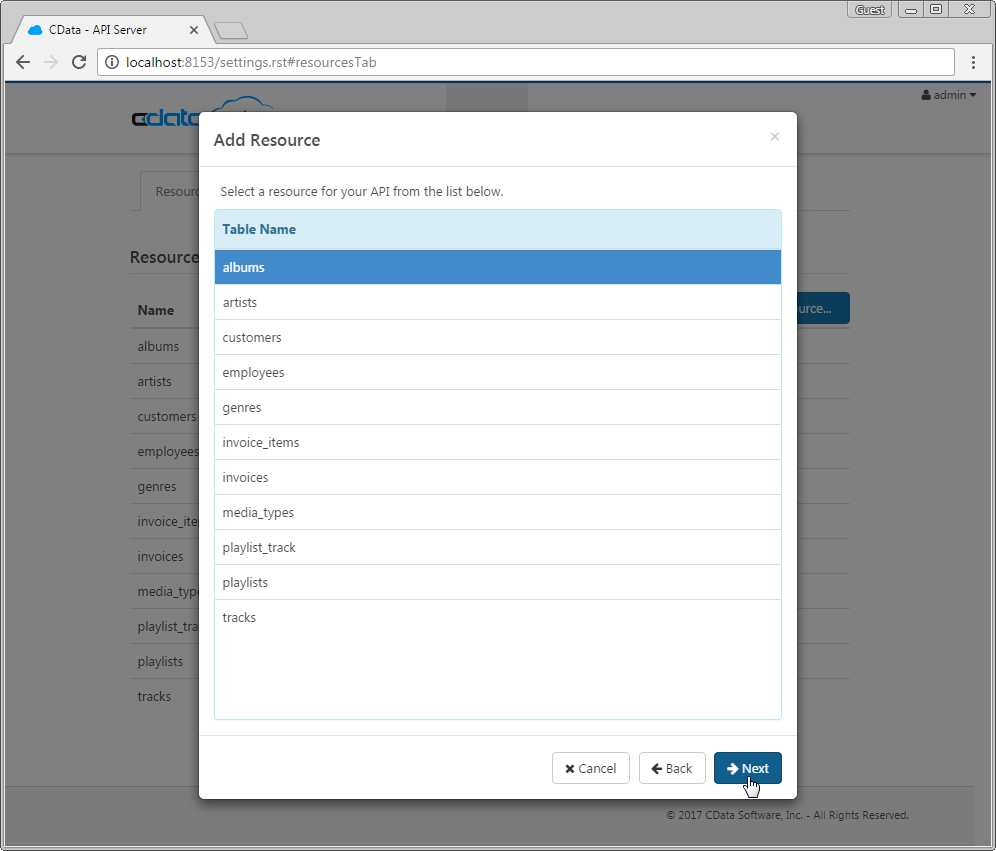
- Click the Add Resources button on the Resources tab of the SETTINGS page.
- Select the data connection you wish to access and click Next.
- With the connection selected, enable resources by selecting each table name and clicking Next.
Sample URLs for the REST API
Having configured a connection to the database, created a user, and added resources to the API Server, you now have an easily accessible REST API based on the OData protocol for those resources. Below, you will see a list of tables and the URLs to access them. For more information on accessing the tables, you can open the API page from the navigation bar. To work with JavaScript, you can append the @json parameter to the end of URLs that do not return JSON data by default.
| Table | URL | |
|---|---|---|
| Entity (table) List | http://address:port/api.rsc/ | |
| Metadata for table albums | http://address:port/api.rsc/albums/$metadata?@json | |
| Albums data | http://address:port/api.rsc/albums |
As with standard OData feeds, if you wish to limit the fields returned, you can add a $select parameter to the query, along with other standard URL parameters, such as $filter, $orderby, $skip, and $top.
Building a D3.js Application
With the API Server setup completed, you are ready to build the sample D3.js app. The following steps walk through the source code for the Web app contained in the .zip file, making note of any relevant sections.
index.html
This file contains all of the source for the D3.js Web app, including script references, styles, basic HTML to create a general layout for the Web app, and JavaScript code using the D3.js library to dynamically populate the app and generate a bar chart based on data from the API Server.
<body>
This HTML element contains the basic HTML code for the Web app: a drop down menu to select the table, drop down menus to for the domain and range of the bar chart and an SVG to contain the bar chart itself. The specific attributes and values of each element are defined dynamically using the D3 JavaScript library.
The body element also contains the script element that encompasses the JavaScript used to dynamically build the Web app.
<script>
The first lines of JavaScript set up the SVG for the bar chart and initialize the other global variables. After the initial setup, the functions to populate the drop down menus for the table and columns are called.
var svg = d3.select("svg"),
    margin = {top: 20, right: 20, bottom: 120, left: 60},
    width = +svg.attr("width") - margin.left - margin.right,
    height = +svg.attr("height") - margin.top - margin.bottom;

var x = d3.scaleBand().rangeRound([0, width]).padding(0.2),
    y = d3.scaleLinear().rangeRound([height, 0]);

var g = svg.append("g")
    .attr("transform", "translate(" + margin.left + "," + margin.top + ")");

var userName = "read_only";
var authToken = "********************";

var selectedTable = "";
var selectedDomain = "";
var selectedRange = "";

populateTableOptions();

populateDomainAndRangeOptions();
populateTableOptions
This function uses the D3.js library to perform the HTTP GET against the API Server to retrieve the list of tables, populate the options for the drop down menu used to choose a table, set the behavior for when the selection changes, set the selected table for the Web app, and set up the button for retrieving specific table data.
populateTableOptions() {
  d3.json("http://localhost:8153/api.rsc/")
    .header("Authorization", "Basic " + btoa(userName + ":" + authToken))
    .get(function(error, data) {
      if (error) throw error;

      var values = data.value;

      d3.select("select.tableSelect")
        .on('change', function() {
          clearChart();
          selectedTable = d3.select("select.tableSelect").property("value");
          populateDomainAndRangeOptions(selectedTable);
          d3.select("button.dataButton")
          .text(function(d) {
            return "Get [" + selectedTable + "] Data";
          });
        })
        .selectAll('option')
        .data(values)
        .enter().append("option")
        .text(function(d) {
          return d.name;
        });

      selectedTable = d3.select("select.tableSelect").property("value");

      d3.select("button.dataButton")
        .on('click', function() {
          clearChart();
          buildChart();
        })
        .text(function(d) {
          return "Get [" + selectedTable + "] Data";
        });
    });
}
populateDomainAndRangeOptions
This function retrieves a list of available columns from the API Server based on the selected table, calls the populateColumnOptions function to populate the domain and range drop down menus with those columns, and sets the selected domain and range.
populateDomainAndRangeOptions() {
  d3.json("http://localhost:8153/api.rsc/" + selectedTable + "/$metadata?@json")
    .header("Authorization", "Basic " + btoa(userName+":"+authToken))
    .get(function(error, data) {
      if (error) throw error;
      populateColumnOptions("domain", data);
      populateColumnOptions("range", data);
      selectedDomain = d3.select("select.domainSelect").property("value");
      selectedRange = d3.select("select.rangeSelect").property("value");
    });
}
populateColumnOptions
This function uses the raw data from the API Server column request to populate the domain and range drop down menus and define the behavior for both drop down menus when the selection changes.
populateColumnOptions(data) {
  var values = data.items[0]["odata:cname"];
  var axes = ["domain", "range"];

  axes.forEach(function(axis) {

    d3.select("select." + axis + "Select")
      .selectAll("*")
      .remove();

    d3.select("select." + axis + "Select")
      .on('change', function() {
        clearChart();
        if (axis == "domain")
          selectedDomain = d3.select("select." + axis + "Select").property("value");
        else if (axis == "range")
          selectedRange = d3.select("select." + axis + "Select").property("value");
      })
      .selectAll('option')
      .data(values)
      .enter().append("option")
      .text(function(d) {
        return d;
      });
  });
}
buildChart
This function does all of the work to build the bar chart, using the values from the selected domain column to fill out the x axis and the values from the selected range column to set the height of the bars and fill out the y-axis. The function retrieves all of these values by performing an HTTP GET request against the API Server, requesting only the selected columns from the selected table.
buildChart() {
  d3.json("http://localhost:8153/api.rsc/" + selectedTable + "/?$select=" + selectedDomain + "," + selectedRange)
      .header("Authorization", "Basic " + btoa(userName + ":" + authToken))
      .get(function(error, data) {
        if (error) throw error;

        var values = data.value;

        x.domain(values.map(function(d) { return d[selectedDomain].toString(); }));
        y.domain([0, d3.max(values, function(d) { return d[selectedRange]; })]);

        g.append("g")
            .attr("class", "axis axis--x")
            .attr("transform", "translate(0," + height + ")")
            .call(d3.axisBottom(x));

        g.selectAll("g.tick")
            .attr("text-anchor", "end")
            .selectAll("text")
            .attr("transform", "rotate(-45)");

        g.append("g")
            .attr("class", "axis axis--y")
            .call(d3.axisLeft(y))
            .append("text")
            .attr("transform", "rotate(-90)")
            .attr("y", 6)
            .attr("dy", "0.71em")
            .attr("text-anchor", "end")
            .text("Value");

        g.selectAll(".bar")
          .data(values)
          .enter().append("rect")
            .attr("class", "bar")
            .attr("x", function(d) { return x(d[selectedDomain].toString()); })
            .attr("y", function(d) { return y(d[selectedRange]); })
            .attr("width", x.bandwidth())
            .attr("height", function(d) { return height - y(d[selectedRange]); })
            .attr("title", function(d) { return d[selectedRange]; })
            .text(function(d) { return d[selectedRange]; });
      });

}
clearChart
This function simply removes all of the bar chart elements from the SVG, allowing you to build new charts whenever you need.
clearChart() {
  d3.select("svg")
    .select("g")
    .selectAll("*")
    .remove();
}
Configuring the D3.js Web App
With the connection to data configured and the source code for the Web app reviewed, you are ready to start the Web app. You need to have node.js installed on your machine and you will need to install or run a Web server in order to properly manage the requests and responses between the Web app and the API Server.
Setting Up the Web App
In the next steps you will set up your Web app, creating and populating the package.json file.
- In the command line,
change to the directory with the source files:
cd ./apiserver-d3
-
Once in the directory, interactively create the package.json file:
npm init
-
Follow the prompts to set the name, version, description, and more for the package. Since this is a sample project, you can safely use the default values or blanks for the test command, git repository, keywords, author, and license. With package.json created, simply edit the file and replace "test": "echo \"Error: no test specified\" && exit 1" with "start": "node node_modules/http-server/bin/http-server -p 3000 -o" in the "scripts" element. This will start a light-weight HTTP server when you use npm start to run the Web app.
Installing a Lightweight HTTP Server
With the package.json file created, you can now install a lightweight HTTP server to run the Web app, if needed:
npm install http-server --save
Running the Web App
Now that you created the package.json file and installed the necessary modules, you are ready to run the Web app. To do so, simply navigate to the directory for the Web app in a command-line interface and execute the following command:
npm start
When the Web app launches, you will be able to see the drop down menus for the table, domain, and range, along with the button to click to build the chart. The list of tables and columns are retrieved from the API Server and include all of the tables you added as resources when configuring the API Server.
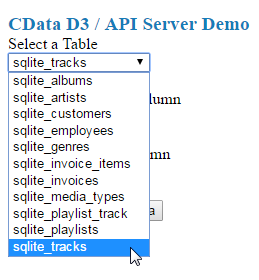
Once you select the table and columns, you can click the Get [table] Data button to retrieve data from your database via the API Server. The bar chart will be built based on the table you selected and the columns you selected for the domain and range.
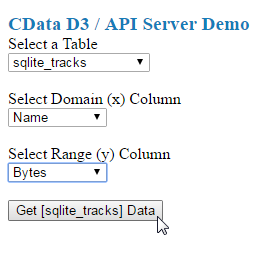
Below you can see a sample bar chart based on the number of bytes in a given song track, listed by the title of the track.

Free Trial & More Information
Now that you have accomplished the steps needed to connect to your database data in dynamic Web pages, download the API Server to start building dynamic Web pages using live data from your on-premises and cloud-based databases, including SQLite, MySQL, SQL Server, Oracle, and PostgreSQL! As always, our world-class support team is ready to answer any questions you may have.

