Discover how a bimodal integration strategy can address the major data management challenges facing your organization today.
Get the Report →


Power BI Connector Getting Started Guide
The CData Power BI Connector provides self-service integration with Microsoft Power BI, linking your Power BI reports to real-time data. That way, you can monitor enterprise data through dashboards and ensure that your analysis reflects your data in real-time by scheduling refreshes or refreshing on demand. This article explains how to install the CData Power BI Connector, configure a connection to data, and visualize data in Power BI.
It is important to note that although this article references the Salesforce Power BI Connector, the same principles herein can be applied to any of the 250+ data sources that we support.
Download and Install the Power BI Connector
First, download and install the Power BI Connector from the CData website: https://www.cdata.com/drivers/salesforce/download/powerbi/
Fill in the appropriate contact information.
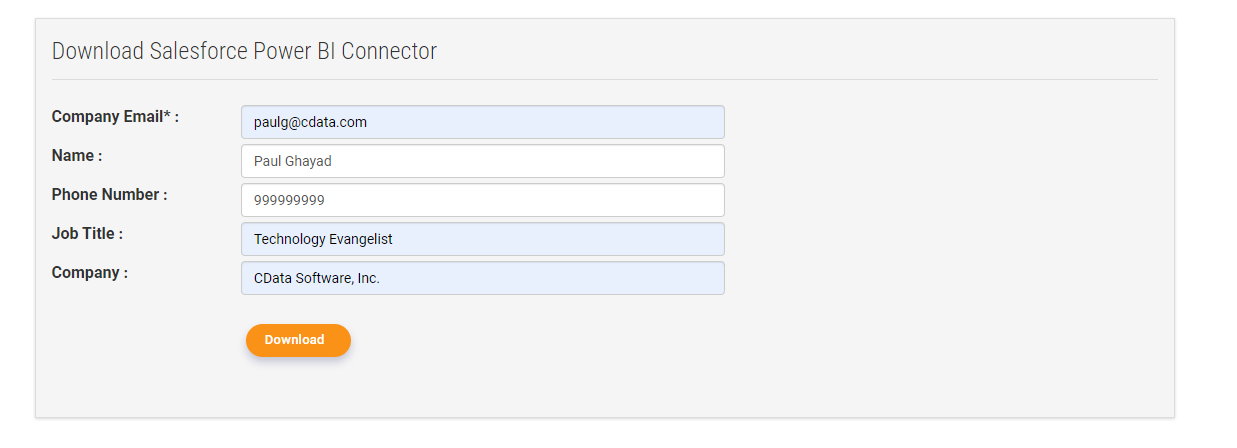
Note: If you are downloading a licensed installer, use your company email address and product key.
During installation, you may encounter this dialog box:
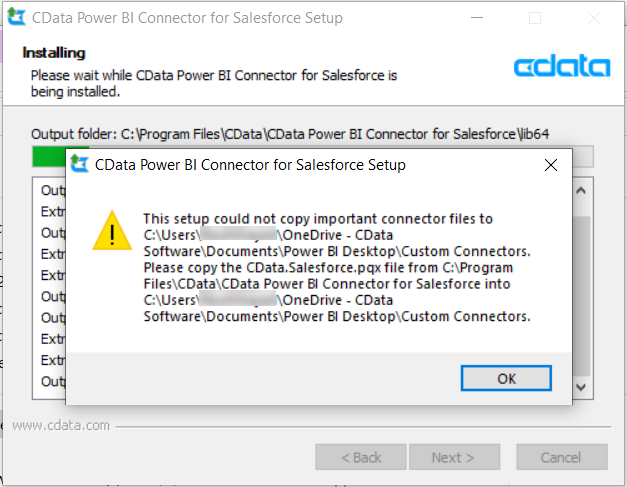 Create the necessary directory, place the specified file into the new directory, and proceed with installation.
Configure the DSN
After the connector installs, a screen will pop up for configuring the DSN.
After filling in the connection properties (e.g. user, password, and security token), click "Test Connection."
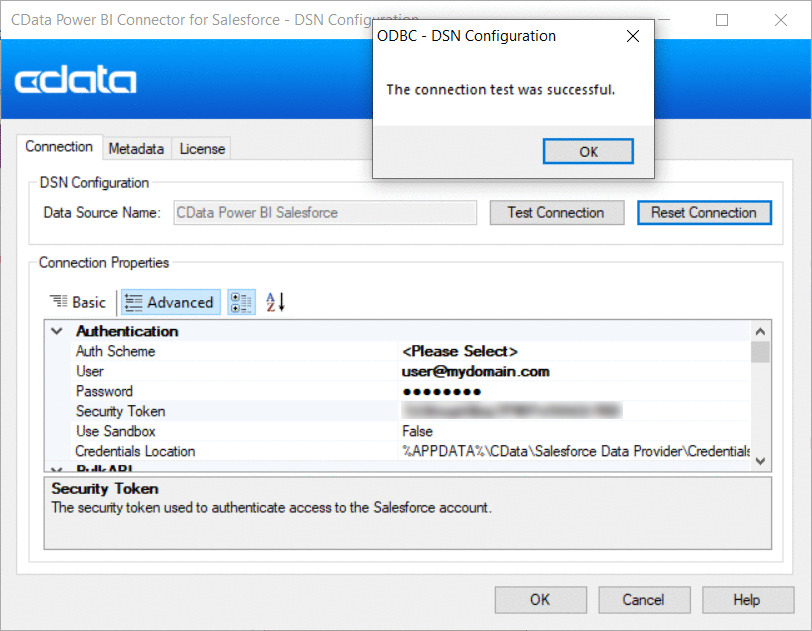 Take note of the Data Source Name, since it will be needed later.
Install Power BI Desktop
Now, download and install Power BI Desktop: https://powerbi.microsoft.com/en-us/downloads/
Import Data and Create a Data Visualization in Power BI
After installing Power BI Desktop, follow the steps below in order to pull data from our Salesforce connection:
-
Open Power BI Desktop and click Get Data -> Other -> CData Salesforce
![]()
-
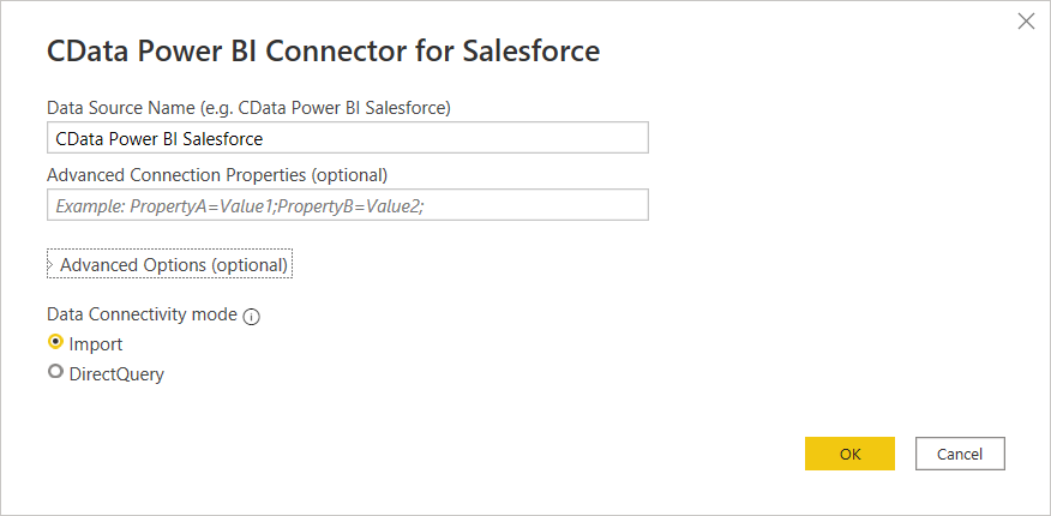
Enter "CData PowerBI Salesforce" in the Data Source Name menu. Next, select a data connectivity mode.
Select Import if you want to import a copy of the data into your project. You can refresh this data on demand.
Otherwise, select DirectQuery if you want to work with the remote data. Click OK.
![]()
-
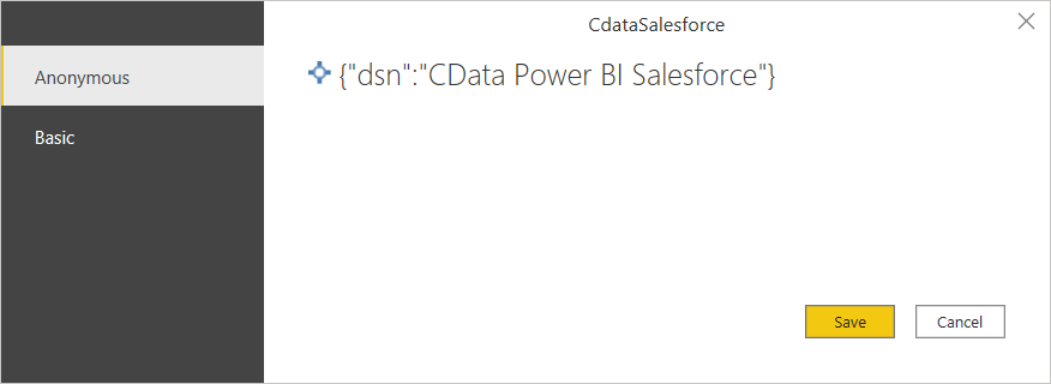
Next, choose Anonymous Authentication and click Save.
![]()
-
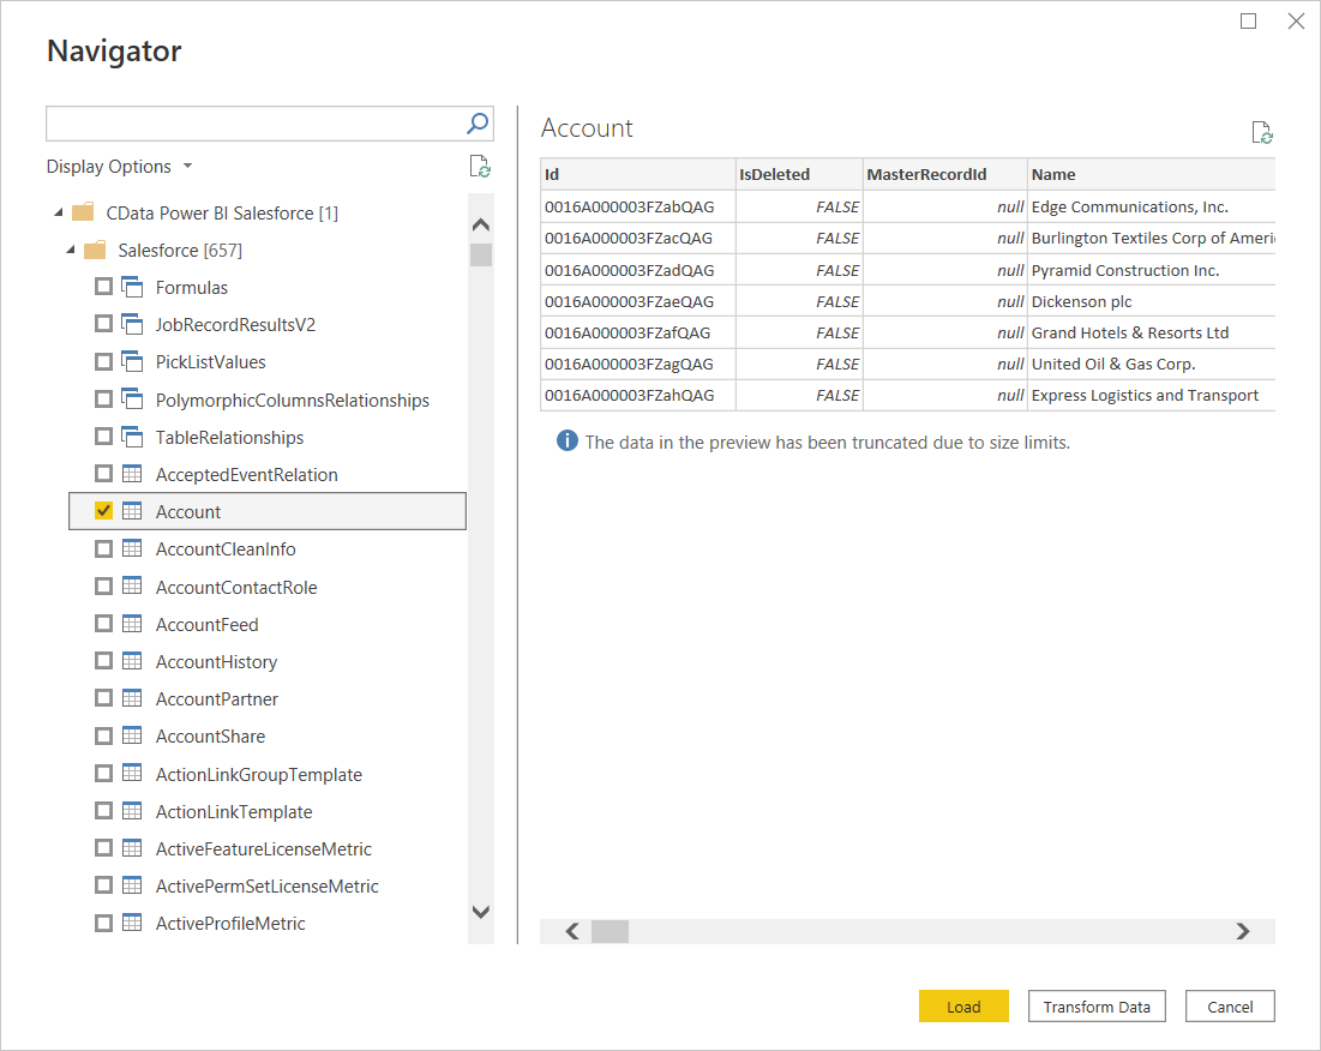
Then, choose a table from the Navigator and click Load.
![]()
-
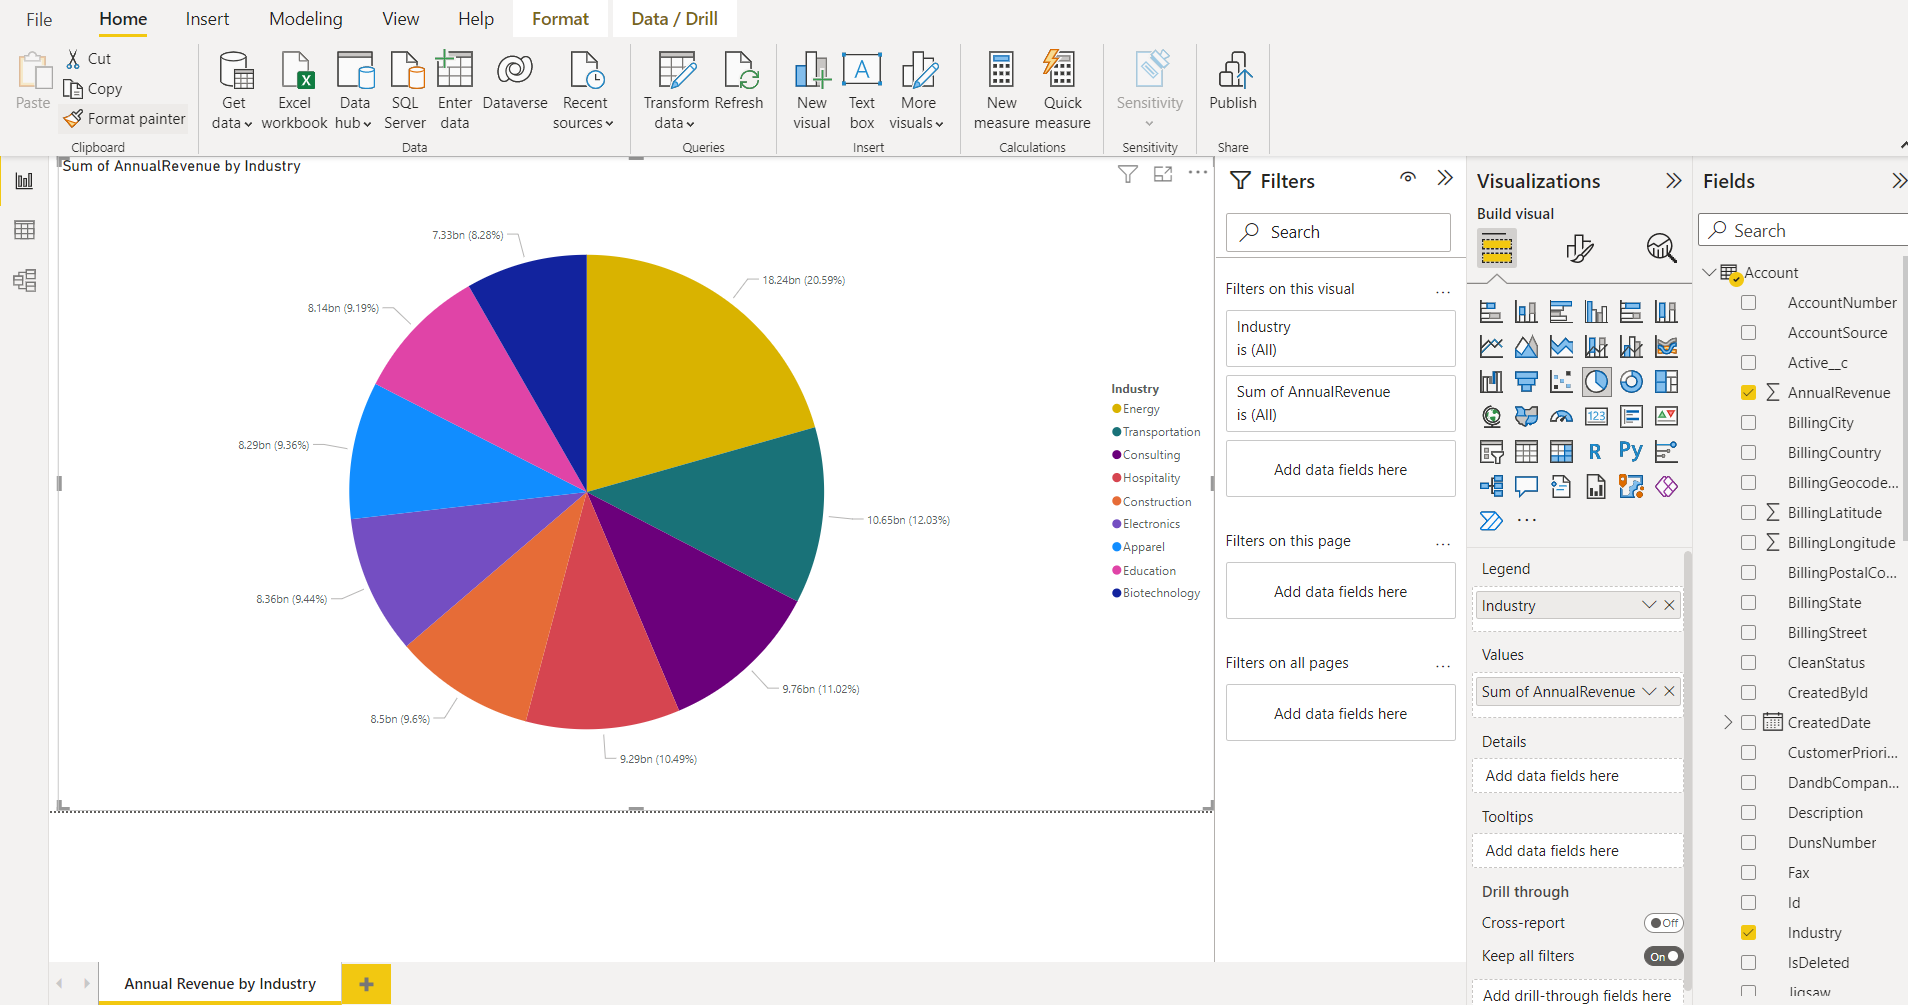
After pulling the data into Power BI, you can create data visualizations in the Report view by
dragging fields from the Fields pane onto the canvas. Follow the steps below to create a pie chart:
- Select the pie chart icon in the Visualizations pane.
- Select a dimension in the Fields pane: for example, Industry.
- Select a measure in the Fields pane: for example, AnnualRevenue.
![]()

CData Connectors for 250+ Data Sources
For more information on CData's suite of connectors, visit our Power BI Connector page.
Download a free 30-day trial of the CData Power BI Connector and get simplified access to your data today.
Data Connectors
ETL/ ELT Solutions
Cloud & API Connectivity
OEM & Custom Drivers