Discover how a bimodal integration strategy can address the major data management challenges facing your organization today.
Get the Report →Create Data Visualizations Based On ADP Data in Mode
Use CData Connect Cloud to connect to ADP Data from Mode and build visualizations using live ADP data.
Mode is a collaborative data platform that combines SQL, R, Python, and visual analytics in one place. When paired with CData Connect Cloud, you get instant, cloud-to-cloud access to ADP data for use in data visualizations. This article shows how to connect to ADP in Connect Cloud, connect to ADP data in Mode, and create a simple visualization using that data.
CData Connect Cloud provides a pure cloud-to-cloud interface for ADP, allowing you to build data visualizations from live ADP data in Mode — without replicating the data to a natively supported database. In order to create visualizations, users write SQL queries to gather data. Using optimized data processing out of the box, CData Connect Cloud pushes all supported SQL operations (filters, JOINs, etc.) directly to ADP, leveraging server-side processing to quickly return the requested ADP data.
Configure ADP Connectivity for Mode
Connectivity to ADP from Mode is made possible through CData Connect Cloud. To work with ADP data from Mode, we start by creating and configuring a ADP connection.
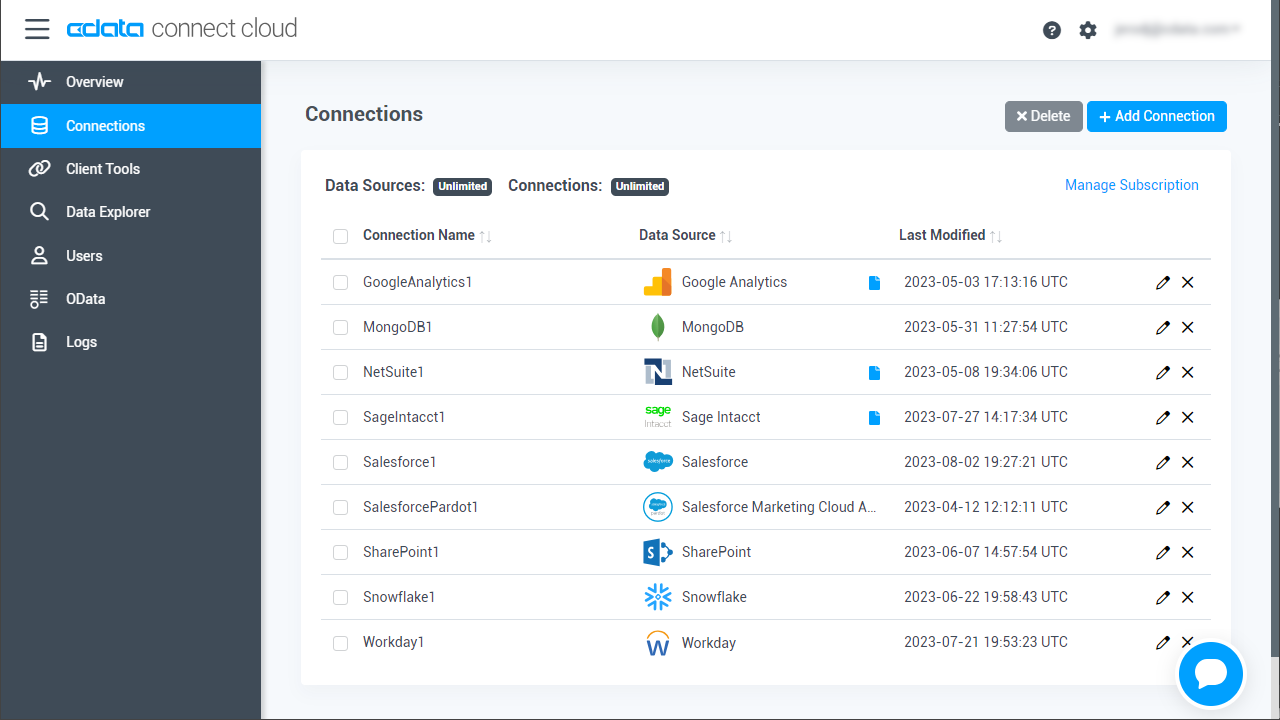
- Log into Connect Cloud, click Connections and click Add Connection
![Adding a Connection]()
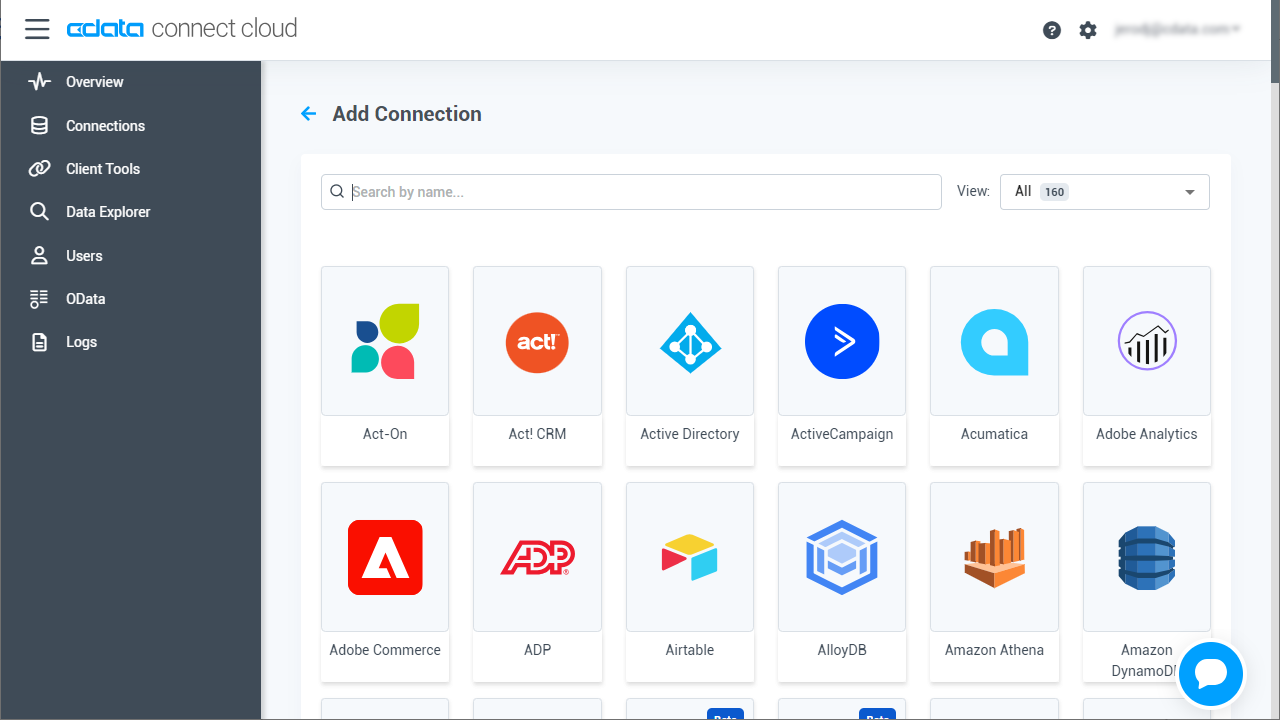
- Select "ADP" from the Add Connection panel
![Selecting a data source]()
-
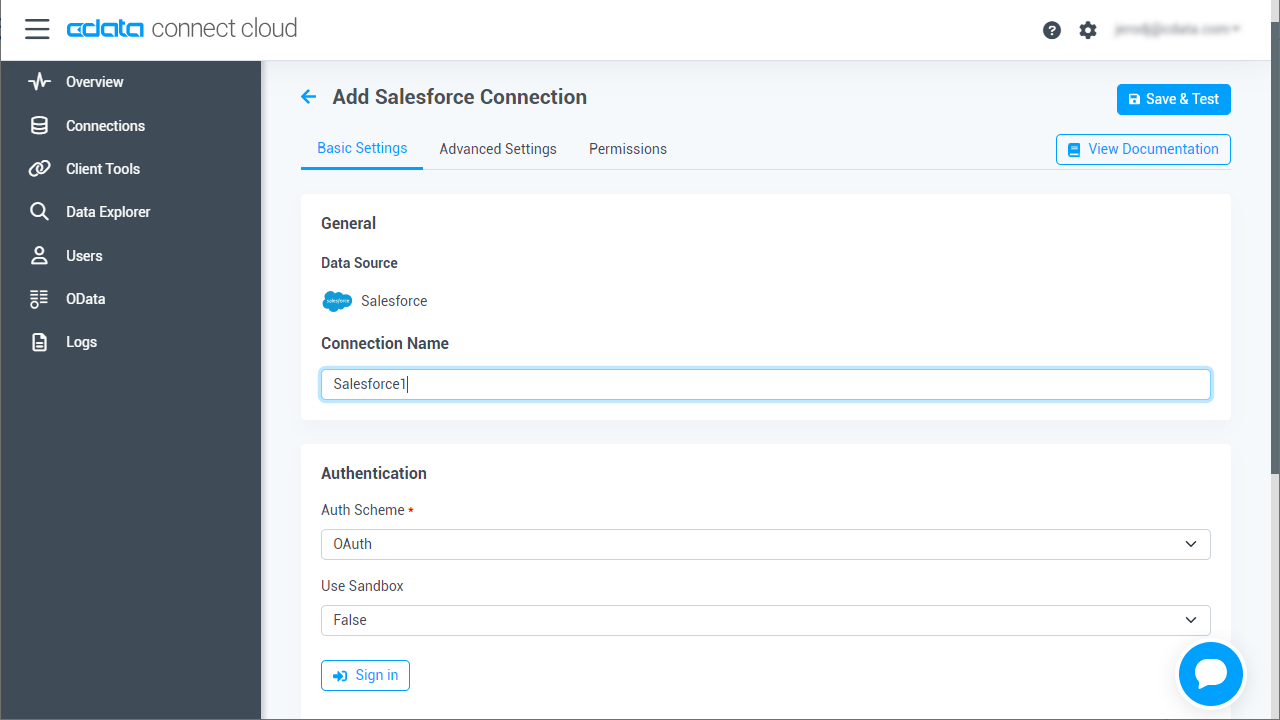
Enter the necessary authentication properties to connect to ADP.
Connect to ADP by specifying the following properties:
- SSLClientCert: Set this to the certificate provided during registration.
- SSLClientCertPassword: Set this to the password of the certificate.
- UseUAT: The connector makes requests to the production environment by default. If using a developer account, set UseUAT = true.
- RowScanDepth: The maximum number of rows to scan for the custom fields columns available in the table. The default value will be set to 100. Setting a high value may decrease performance.
The connector uses OAuth to authenticate with ADP. OAuth requires the authenticating user to interact with ADP using the browser. For more information, refer to the OAuth section in the Help documentation.
![Configuring a connection (Salesforce is shown)]()
- Click Create & Test
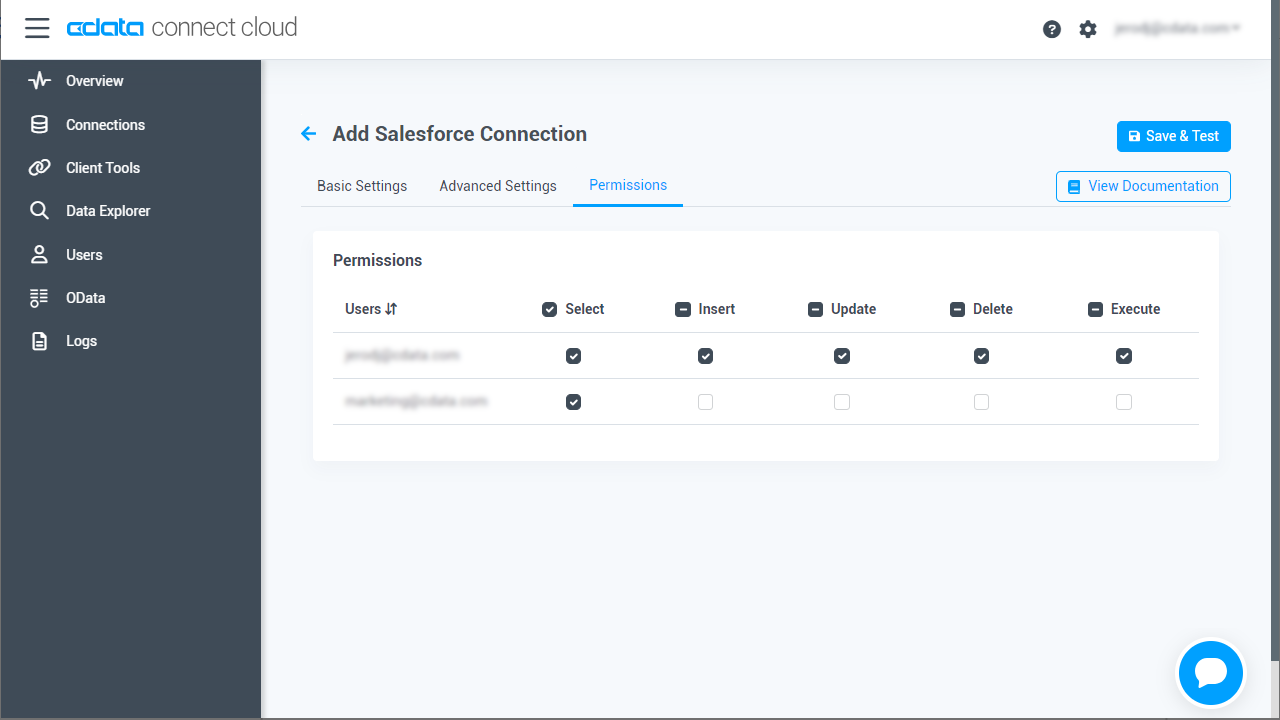
- Navigate to the Permissions tab in the Add ADP Connection page and update the User-based permissions.
![Updating permissions]()
Add a Personal Access Token
If you are connecting from a service, application, platform, or framework that does not support OAuth authentication, you can create a Personal Access Token (PAT) to use for authentication. Best practices would dictate that you create a separate PAT for each service, to maintain granularity of access.
- Click on your username at the top right of the Connect Cloud app and click User Profile.
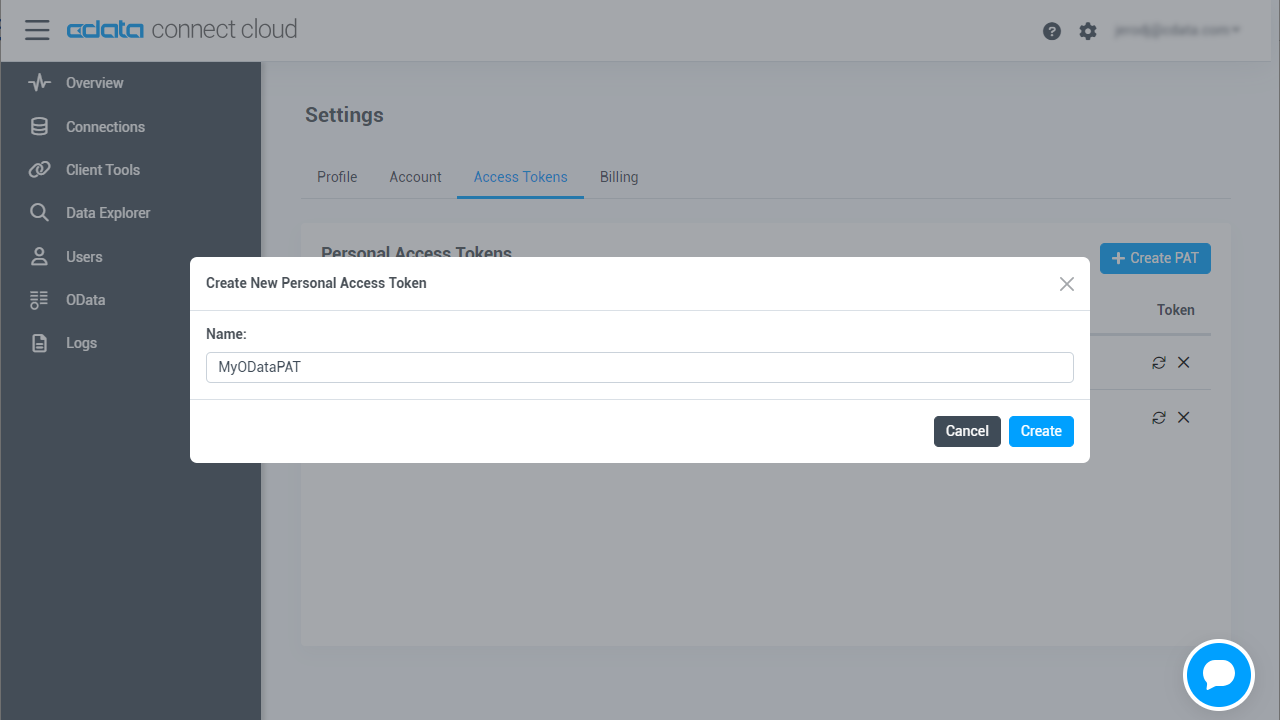
- On the User Profile page, scroll down to the Personal Access Tokens section and click Create PAT.
- Give your PAT a name and click Create.
![Creating a new PAT]()
- The personal access token is only visible at creation, so be sure to copy it and store it securely for future use.
With the connection configured, you are ready to connect to ADP data from Mode.
Connect to ADP in Mode
The steps below outline connecting to CData Connect Cloud from Mode to create a new ADP data source.
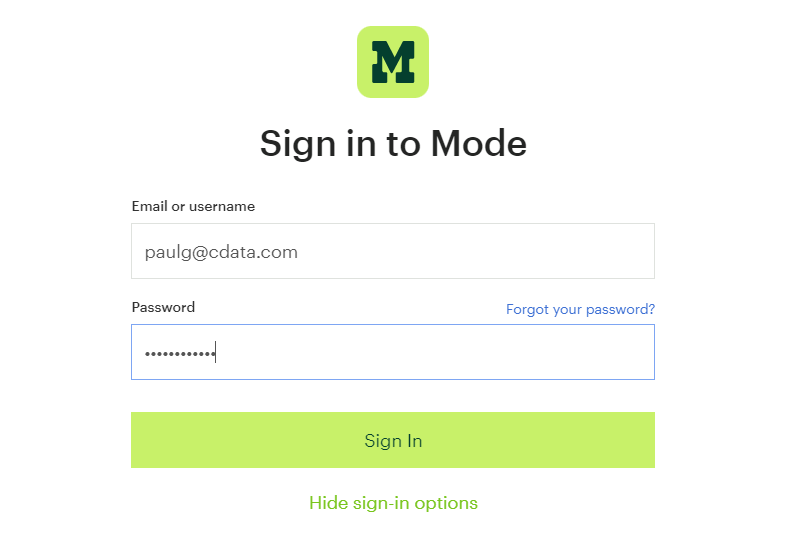
- Log-in to Mode
![Logging In]()
- In the top-left corner of the screen, click the down-arrow next to your name and select Connect a Database...
![Selecting Connect to Database]()
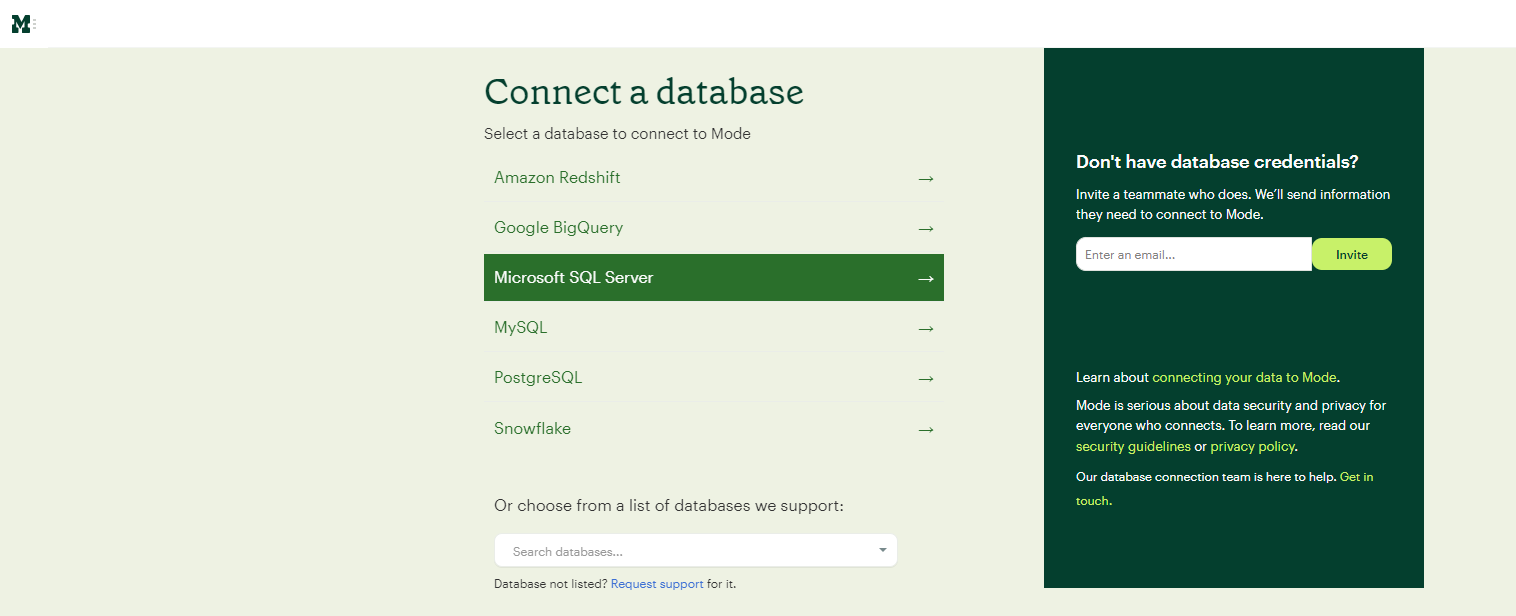
- On the next screen, select Microsoft SQL Server.
![Selecting Microsoft SQL Server]()
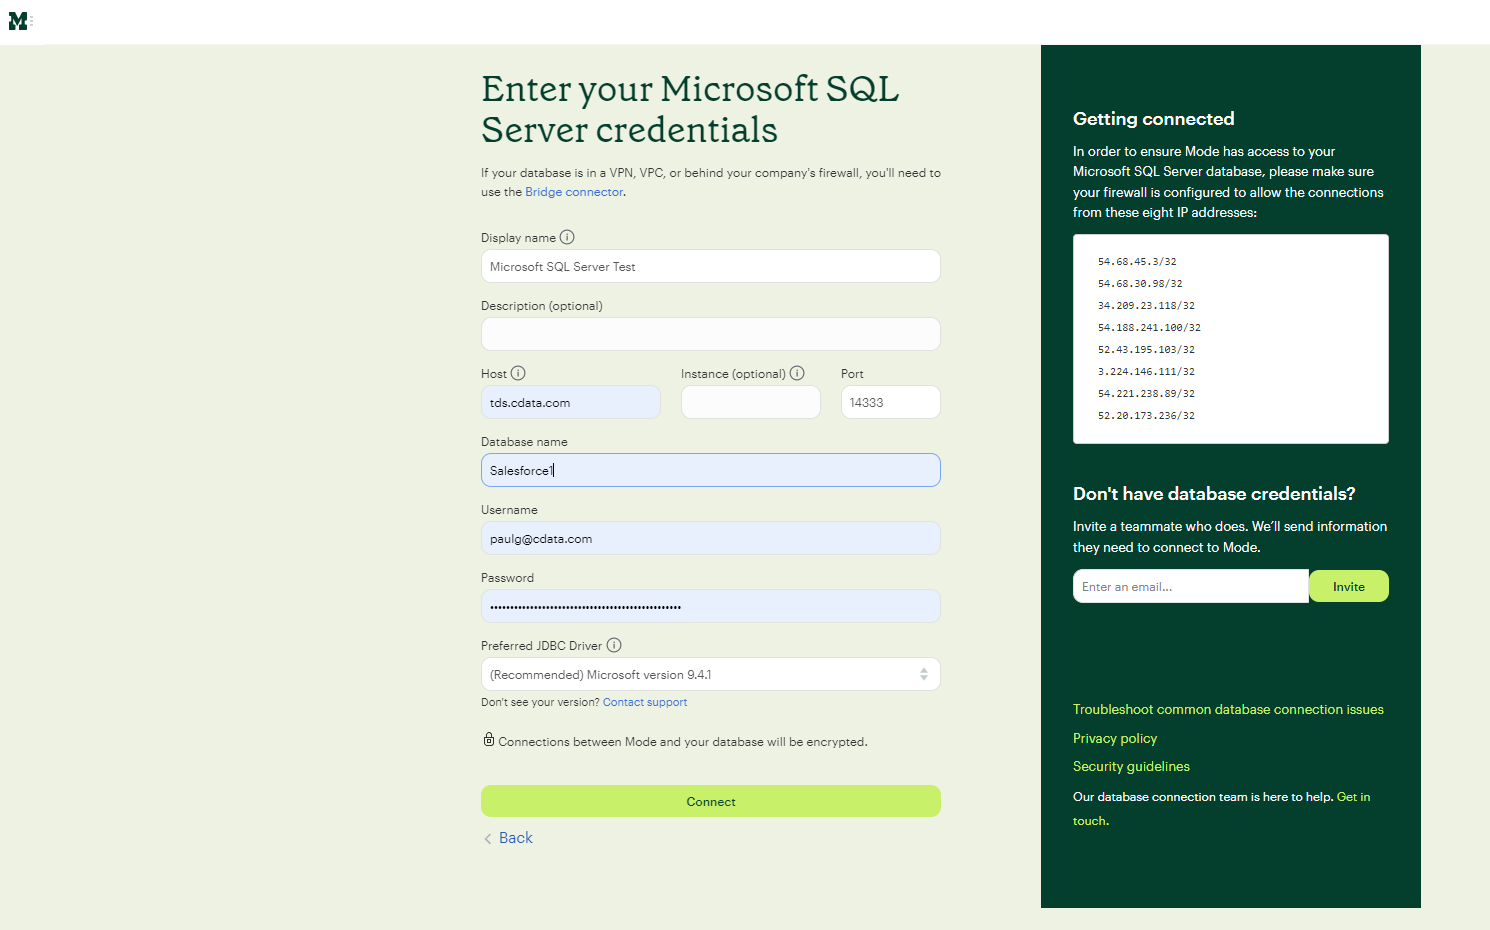
- Enter the Microsoft SQL Server credentials:
- Display Name: the name for the connection.
- Host/Port: enter tds.cdata.com in the Host field and 14333 in the Port field.
- Database name: enter the Connection Name of the CData Connect Cloud data source you want to connect to (for example, ADP1).
- Username: enter your CData Connect Cloud username. This is displayed in the top-right corner of the CData Connect Cloud interface. For example, [email protected]
- Password: enter the PAT you generated on the Settings page
![Configuring connection settings]()
- At the bottom of the page, click Connect to ensure that you can connect to CData Connect Cloud.
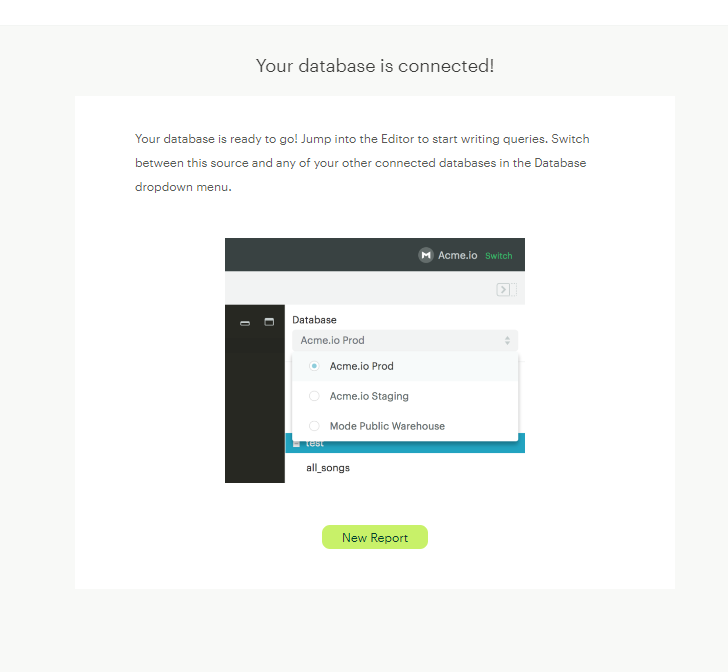
- Upon success, the following screen appears.
![New database connection added.]()
Your connection is now available for use in Mode. To connect to additional data sources from your CData Connect Cloud account, repeat the setup steps above, changing the value for Database for each data source.
Creating A Mode Visualization
To create a visualization in Mode, follow these steps:
- On the current screen, click New Report. The SQL query text editor appears.
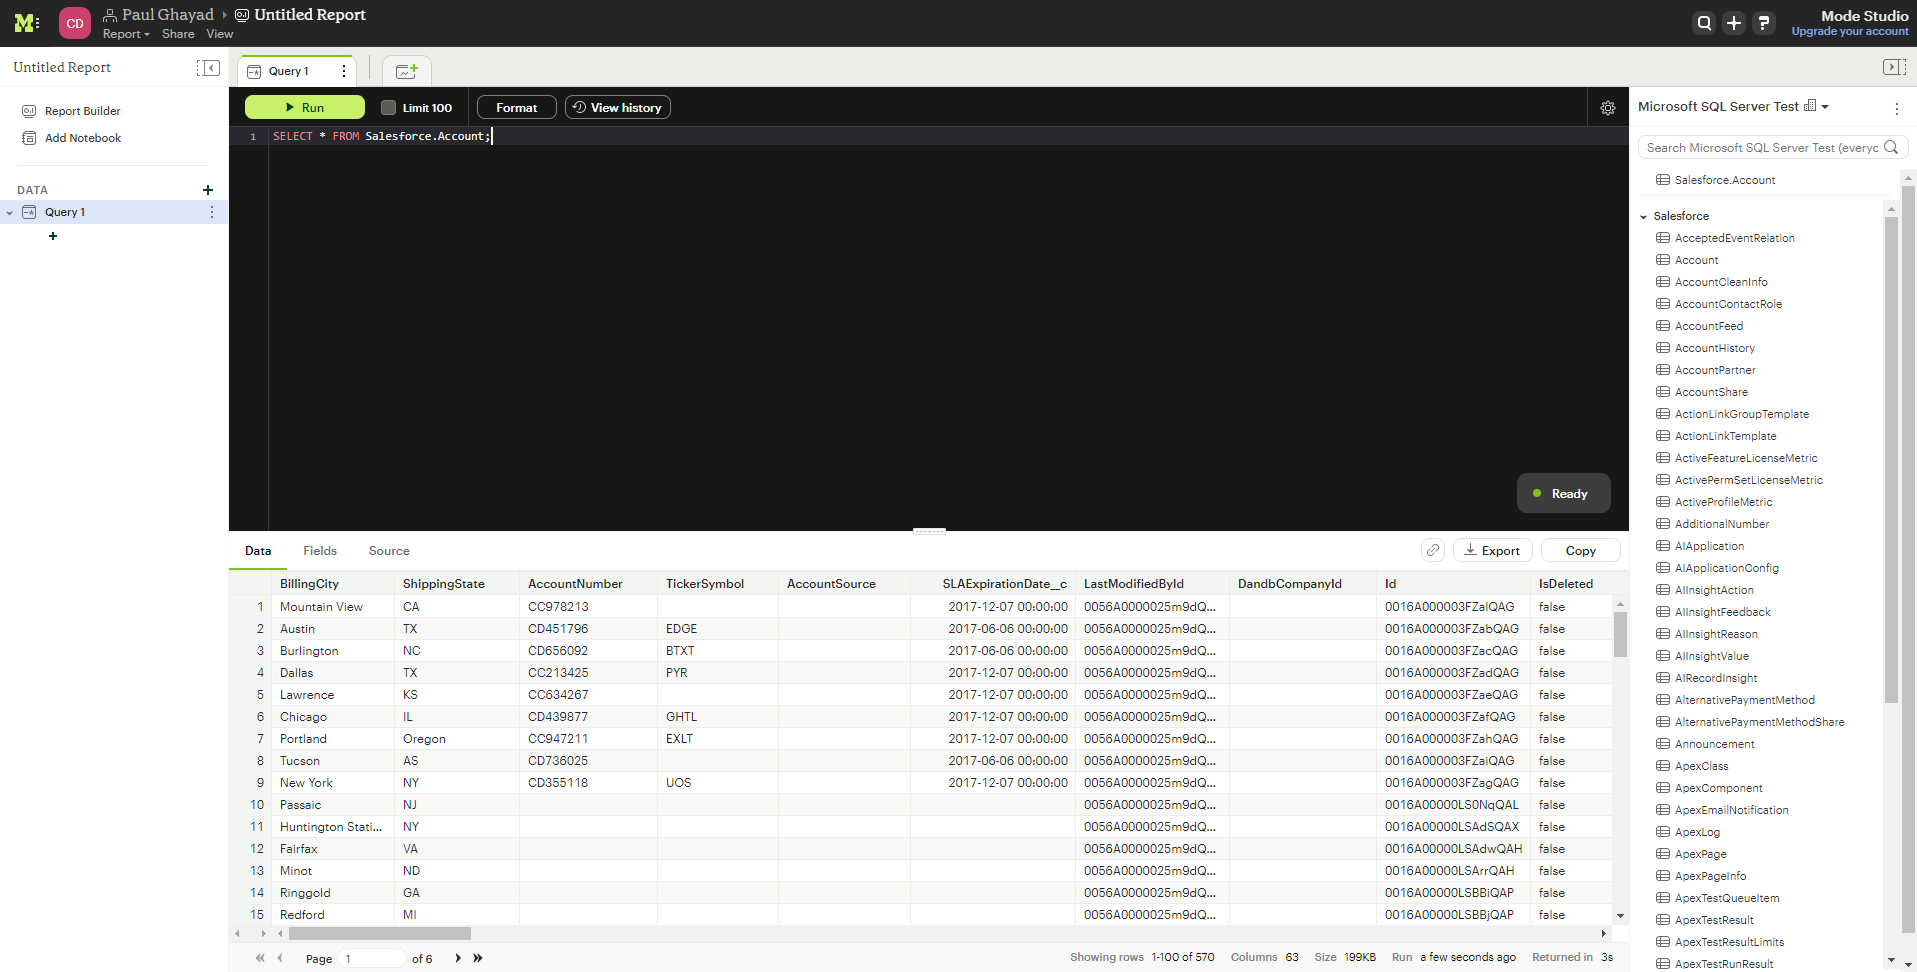
Enter the following query:
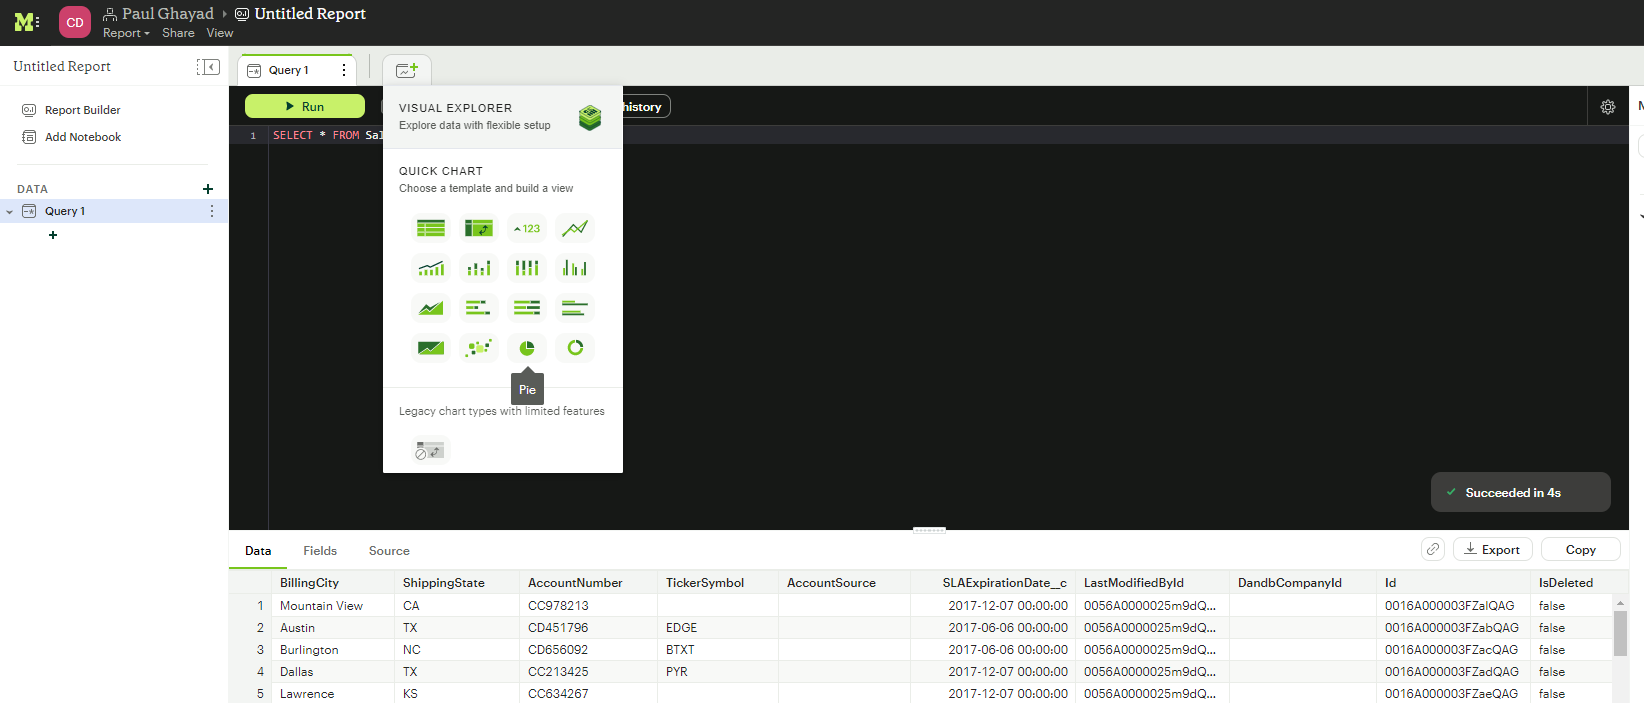
SELECT * FROM [ADP].[Workers];Click Run. The app now shows the query result:![Showing SQL query result.]()
- Running the query activates the New Chart tab. Click this tab and select Pie Chart.
![Selecting pie chart.]()
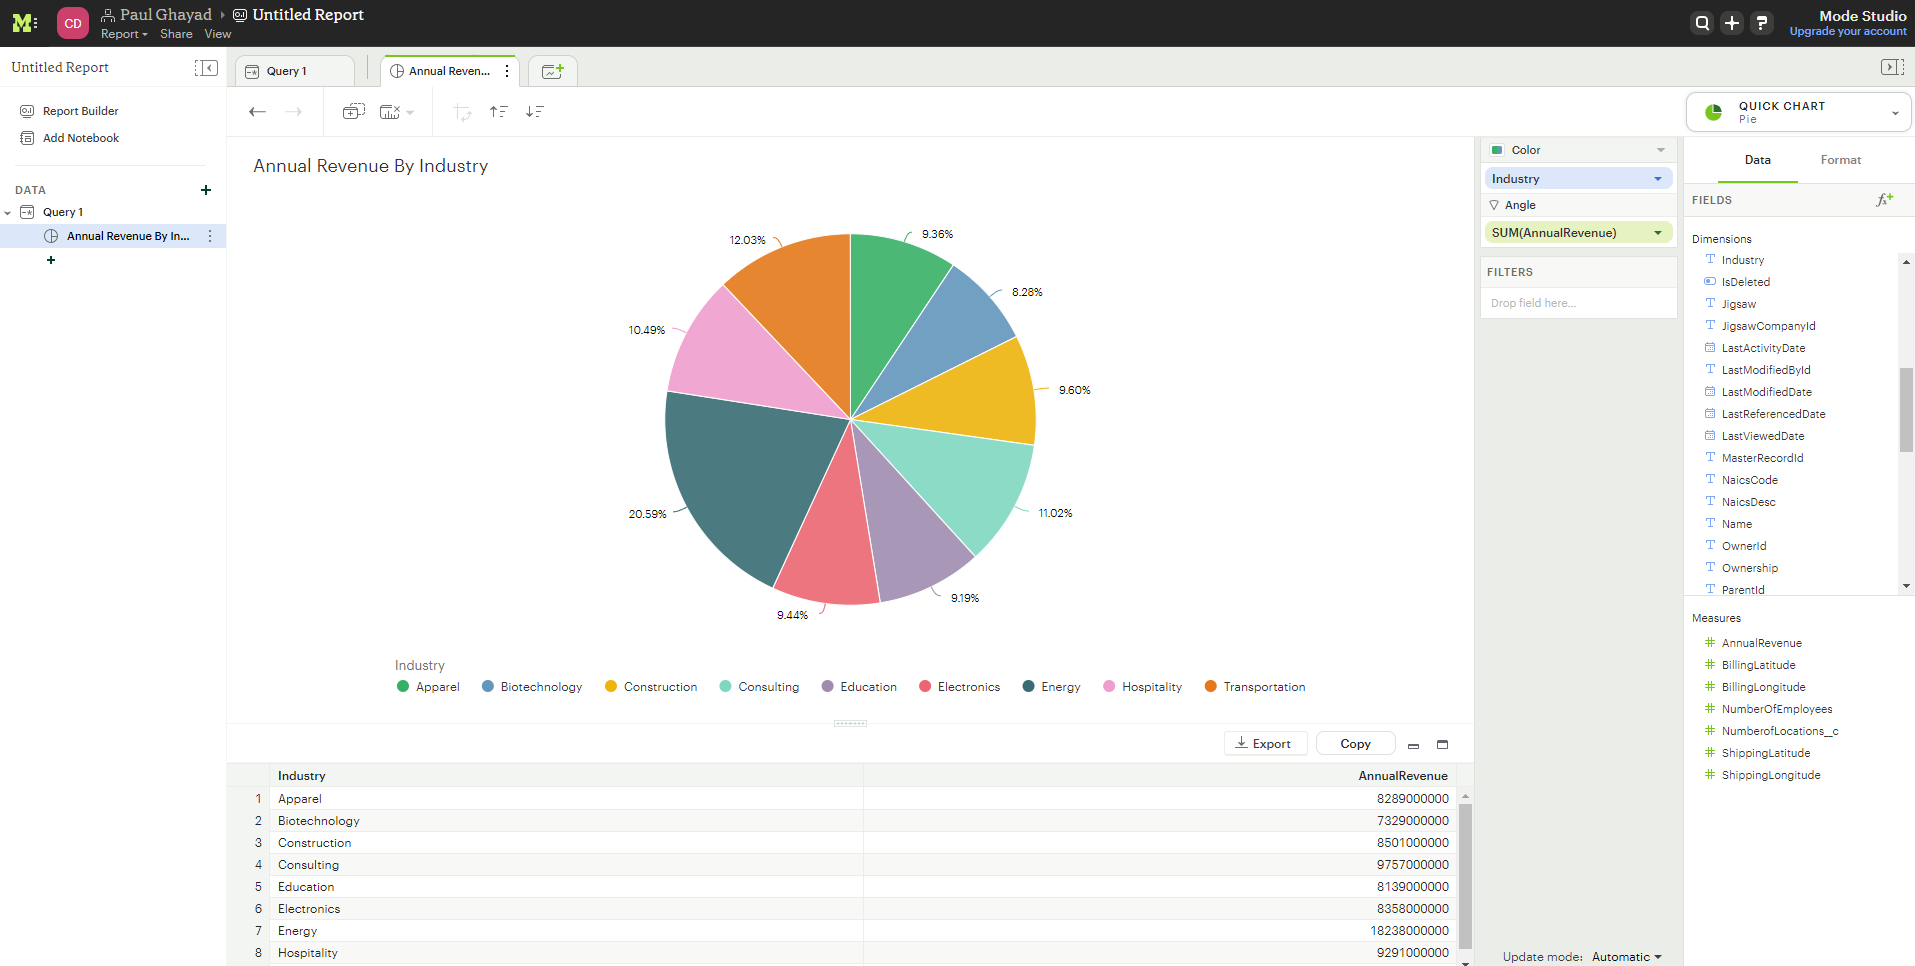
- Now, drop a dimension in the Color section and a measure in the Angle section.
![Creating visualization.]()
We have now created a visualization of ADP data in Mode using CData Connect Cloud!
Get CData Connect Cloud
To get live data access to 100+ SaaS, Big Data, and NoSQL sources directly from your cloud applications, try CData Connect Cloud today!

