Discover how a bimodal integration strategy can address the major data management challenges facing your organization today.
Get the Report →DataBind Databricks Data to the DevExpress Data Grid
Use the CData ADO.NET Provider for Databricks with the DevExpress Windows Forms and Web controls to provide Databricks data to a chart.
The ADO.NET Provider for Databricks by CData incorporates conventional ADO.NET data access components compatible with third-party controls. You can adhere to the standard ADO.NET data binding procedures to establish two-way access to real-time data through UI controls. This article will demonstrate the utilization of CData components for data binding with DevExpress UI Controls (Windows Forms and Web controls), specifically binding to a chart that visualizes live data.
To connect to a Databricks cluster, set the properties as described below.
Note: The needed values can be found in your Databricks instance by navigating to Clusters, and selecting the desired cluster, and selecting the JDBC/ODBC tab under Advanced Options.
- Server: Set to the Server Hostname of your Databricks cluster.
- HTTPPath: Set to the HTTP Path of your Databricks cluster.
- Token: Set to your personal access token (this value can be obtained by navigating to the User Settings page of your Databricks instance and selecting the Access Tokens tab).
Windows Forms Controls
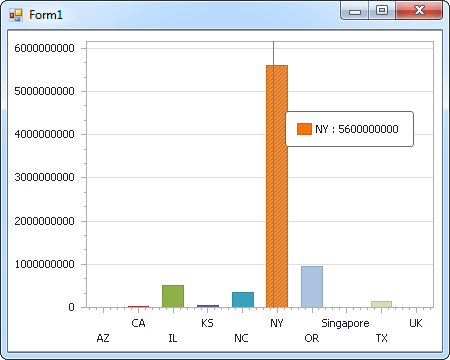
The code below shows how to populate a DevExpress chart with Databricks data. The DatabricksDataAdapter binds to the Series property of the chart control. The Diagram property of the control defines the x- and y-axes as the column names.
using (DatabricksConnection connection = new DatabricksConnection(
"Server=127.0.0.1;Port=443;TransportMode=HTTP;HTTPPath=MyHTTPPath;UseSSL=True;User=MyUser;Password=MyPassword;")) {
  DatabricksDataAdapter dataAdapter = new DatabricksDataAdapter(
  "SELECT City, CompanyName FROM Customers WHERE Country = 'US'", connection);

  DataTable table = new DataTable();
  dataAdapter.Fill(table);
  DevExpress.XtraCharts.Series series = new DevExpress.XtraCharts.Series();
  chartControl1.Series.Add(series);
  series.DataSource = table;
  series.ValueDataMembers.AddRange(new string[] { "CompanyName" });
  series.ArgumentScaleType = DevExpress.XtraCharts.ScaleType.Qualitative;
  series.ArgumentDataMember = "City";
  series.ValueScaleType = DevExpress.XtraCharts.ScaleType.Numerical;
  chartControl1.Legend.Visibility = DevExpress.Utils.DefaultBoolean.False;
  ((DevExpress.XtraCharts.SideBySideBarSeriesView)series.View).ColorEach = true;
}

Web Controls
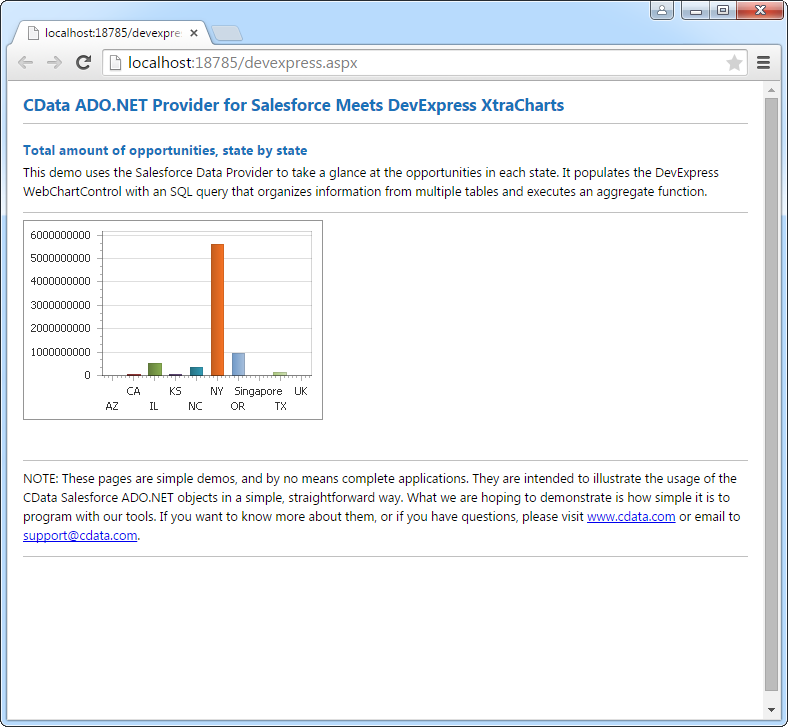
The code below shows how to populate a DevExpress Web control with Databricks data. The DatabricksDataAdapter binds to the Series property of the chart; the Diagram property defines the x- and y-axes as the column names.
using DevExpress.XtraCharts;

using (DatabricksConnection connection = new DatabricksConnection(
"Server=127.0.0.1;Port=443;TransportMode=HTTP;HTTPPath=MyHTTPPath;UseSSL=True;User=MyUser;Password=MyPassword;"))
{
  DatabricksDataAdapter DatabricksDataAdapter1 = new DatabricksDataAdapter("SELECT City, CompanyName FROM Customers WHERE Country = 'US'", connection);
  DataTable table = new DataTable();
  DatabricksDataAdapter1.Fill(table);
  DevExpress.XtraCharts.Series series = new Series("Series1", ViewType.Bar);
  WebChartControl1.Series.Add(series);
  series.DataSource = table;
  series.ValueDataMembers.AddRange(new string[] { "CompanyName" });
  series.ArgumentScaleType = ScaleType.Qualitative;
  series.ArgumentDataMember = "City";
  series.ValueScaleType = ScaleType.Numerical;
  ((DevExpress.XtraCharts.SideBySideBarSeriesView)series.View).ColorEach = true;
}


