Discover how a bimodal integration strategy can address the major data management challenges facing your organization today.
Get the Report →DataBind HCL Domino Data to the DevExpress Data Grid
Use the CData ADO.NET Provider for HCL Domino with the DevExpress Windows Forms and Web controls to provide HCL Domino data to a chart.
The ADO.NET Provider for HCL Domino by CData incorporates conventional ADO.NET data access components compatible with third-party controls. You can adhere to the standard ADO.NET data binding procedures to establish two-way access to real-time data through UI controls. This article will demonstrate the utilization of CData components for data binding with DevExpress UI Controls (Windows Forms and Web controls), specifically binding to a chart that visualizes live data.
Prerequisites
The connector requires the Proton component to be installed. Normally, Proton is distributed as part of the AppDev pack. See the HCL documentation for instructions on acquiring and installing Proton or the AppDev pack.
Once the Proton service is installed and running, you will also need to create a user account and download its Internet certificate. This certificate can be used to set the connector certificate connection properties.
Authenticating to Domino
- Server: The name or IP address of the server running Domino with the Proton service.
- Port: The port number that the Proton service is listening on.
- Database: The name of the database file, including the .nsf extension.
- SSLClientCertType: This must match the format of the certificate file. Typically this will be either PEMKEY_FILE for .pem certificates or PFXFILE for .pfx certificates.
- SSLClientCert: The path to the certificate file.
- SSLServerCert: This can be set to (*) if you trust the server. This is usually the case, but if you want to perform SSL validation, you may provide a certificate or thumbprint instead. See the documentation for SSLServerCert for details.
Additional Server Configuration
The connector supports querying Domino views if any are defined. Before views can be queried by the connector they must be registered with the design catalog.
Please refer to the Catalog Administration section of the AppDev pack documentation for details on how to do this.
Windows Forms Controls
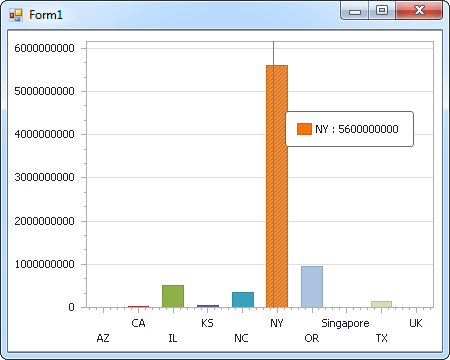
The code below shows how to populate a DevExpress chart with HCL Domino data. The DominoDataAdapter binds to the Series property of the chart control. The Diagram property of the control defines the x- and y-axes as the column names.
using (DominoConnection connection = new DominoConnection(
"Server=https://domino.corp.com;Database=names.nsf;Port=3002;SSLClientCertType=PEMKEY_FILE;SSLClientCert=full_path_of_certificate.pem;SSLServerCert=*")) {
  DominoDataAdapter dataAdapter = new DominoDataAdapter(
  "SELECT Name, Address FROM ByName WHERE City = 'Miami'", connection);

  DataTable table = new DataTable();
  dataAdapter.Fill(table);
  DevExpress.XtraCharts.Series series = new DevExpress.XtraCharts.Series();
  chartControl1.Series.Add(series);
  series.DataSource = table;
  series.ValueDataMembers.AddRange(new string[] { "Address" });
  series.ArgumentScaleType = DevExpress.XtraCharts.ScaleType.Qualitative;
  series.ArgumentDataMember = "Name";
  series.ValueScaleType = DevExpress.XtraCharts.ScaleType.Numerical;
  chartControl1.Legend.Visibility = DevExpress.Utils.DefaultBoolean.False;
  ((DevExpress.XtraCharts.SideBySideBarSeriesView)series.View).ColorEach = true;
}

Web Controls
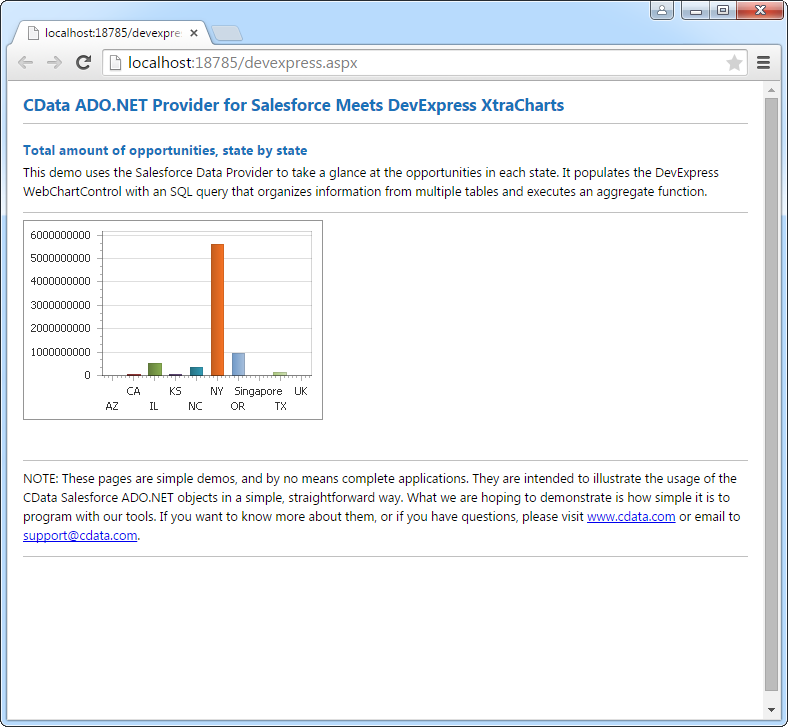
The code below shows how to populate a DevExpress Web control with HCL Domino data. The DominoDataAdapter binds to the Series property of the chart; the Diagram property defines the x- and y-axes as the column names.
using DevExpress.XtraCharts;

using (DominoConnection connection = new DominoConnection(
"Server=https://domino.corp.com;Database=names.nsf;Port=3002;SSLClientCertType=PEMKEY_FILE;SSLClientCert=full_path_of_certificate.pem;SSLServerCert=*"))
{
  DominoDataAdapter DominoDataAdapter1 = new DominoDataAdapter("SELECT Name, Address FROM ByName WHERE City = 'Miami'", connection);
  DataTable table = new DataTable();
  DominoDataAdapter1.Fill(table);
  DevExpress.XtraCharts.Series series = new Series("Series1", ViewType.Bar);
  WebChartControl1.Series.Add(series);
  series.DataSource = table;
  series.ValueDataMembers.AddRange(new string[] { "Address" });
  series.ArgumentScaleType = ScaleType.Qualitative;
  series.ArgumentDataMember = "Name";
  series.ValueScaleType = ScaleType.Numerical;
  ((DevExpress.XtraCharts.SideBySideBarSeriesView)series.View).ColorEach = true;
}


