Discover how a bimodal integration strategy can address the major data management challenges facing your organization today.
Get the Report →Connect to and Query SQL Analysis Services Data in QlikView over ODBC
Create data visualizations with SQL Analysis Services data in QlikView.
The CData ODBC drivers expand your ability to work with data from more than 200 data sources. QlikView is a business discovery platform that provides self-service BI for all business users in an organization. This article outlines simple steps to connect to SQL Analysis Services data using the CData ODBC driver and create data visualizations in QlikView.
The CData ODBC drivers offer unmatched performance for interacting with live SQL Analysis Services data in QlikView due to optimized data processing built into the driver. When you issue complex SQL queries from QlikView to SQL Analysis Services, the driver pushes supported SQL operations, like filters and aggregations, directly to SQL Analysis Services and utilizes the embedded SQL engine to process unsupported operations (often SQL functions and JOIN operations) client-side. With built-in dynamic metadata querying, you can visualize and analyze SQL Analysis Services data using native QlikView data types.
Connect to SQL Analysis Services as an ODBC Data Source
If you have not already, first specify connection properties in an ODBC DSN (data source name). This is the last step of the driver installation. You can use the Microsoft ODBC Data Source Administrator to create and configure ODBC DSNs.
To connect, provide authentication and set the Url property to a valid SQL Server Analysis Services endpoint. You can connect to SQL Server Analysis Services instances hosted over HTTP with XMLA access. See the Microsoft documentation to configure HTTP access to SQL Server Analysis Services.
To secure connections and authenticate, set the corresponding connection properties, below. The data provider supports the major authentication schemes, including HTTP and Windows, as well as SSL/TLS.
-
HTTP Authentication
Set AuthScheme to "Basic" or "Digest" and set User and Password. Specify other authentication values in CustomHeaders.
-
Windows (NTLM)
Set the Windows User and Password and set AuthScheme to "NTLM".
-
Kerberos and Kerberos Delegation
To authenticate with Kerberos, set AuthScheme to NEGOTIATE. To use Kerberos delegation, set AuthScheme to KERBEROSDELEGATION. If needed, provide the User, Password, and KerberosSPN. By default, the data provider attempts to communicate with the SPN at the specified Url.
-
SSL/TLS:
By default, the data provider attempts to negotiate SSL/TLS by checking the server's certificate against the system's trusted certificate store. To specify another certificate, see the SSLServerCert property for the available formats.
You can then access any cube as a relational table: When you connect the data provider retrieves SSAS metadata and dynamically updates the table schemas. Instead of retrieving metadata every connection, you can set the CacheLocation property to automatically cache to a simple file-based store.
See the Getting Started section of the CData documentation, under Retrieving Analysis Services Data, to execute SQL-92 queries to the cubes.
When you configure the DSN, you may also want to set the Max Rows connection property. This will limit the number of rows returned, which is especially helpful for improving performance when designing reports and visualizations.
Populate a Chart with SQL Analysis Services Data
The steps below supply the results of an SQL query to a visualization in QlikView. In this article, you will create a bar chart with the query below:
SELECT Fiscal_Year, Sales_Amount FROM Adventure_Works
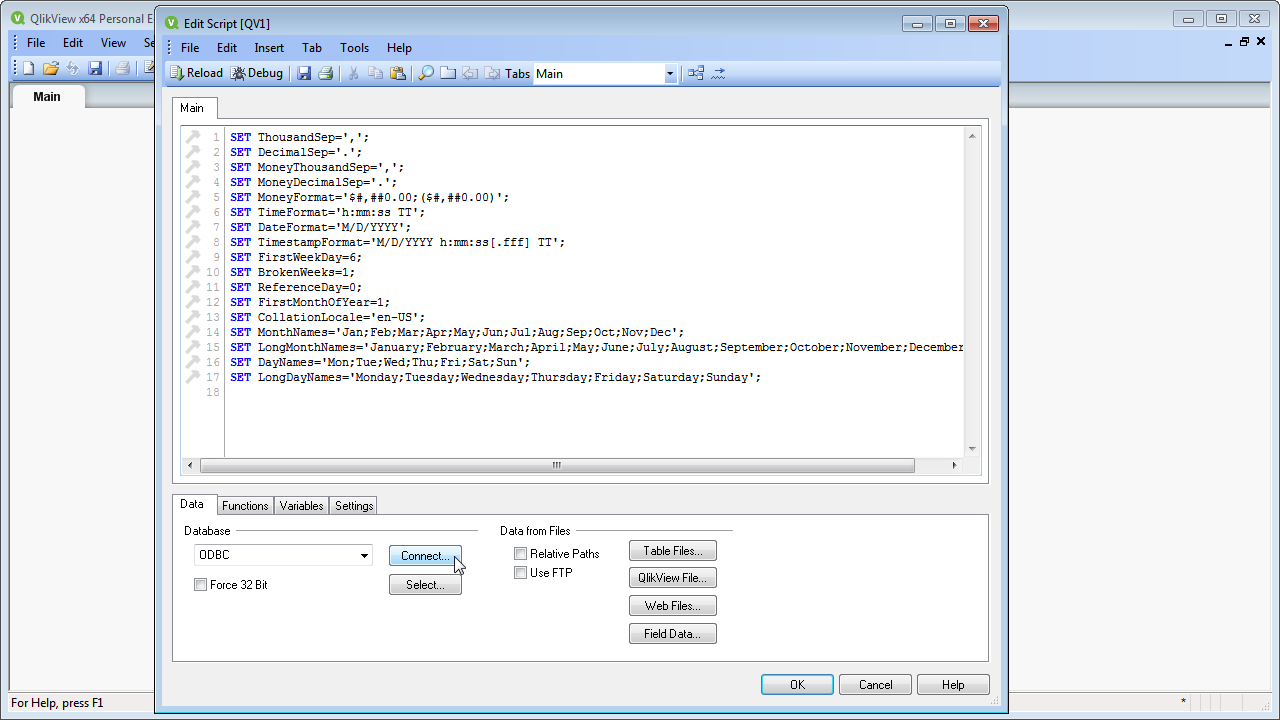
- Click File -> Edit Script (or click the Edit Script button in the Toolbar).
- On the Data tab, select ODBC in the Database menu and click Connect.
![Connecting to an ODBC data source.]()
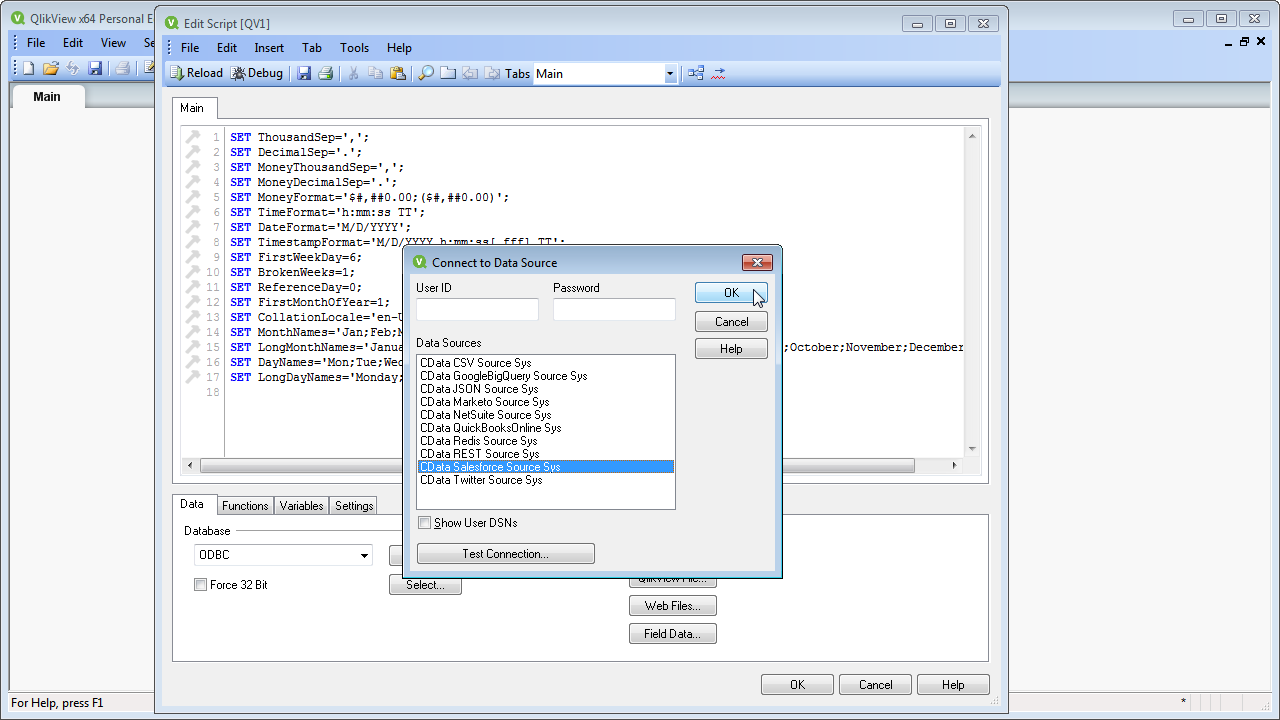
- Select the DSN (CData SSAS Sys) in the resulting dialog.
![Selecting a DSN (Salesforce is shown).]() A command like the following is generated:
A command like the following is generated:
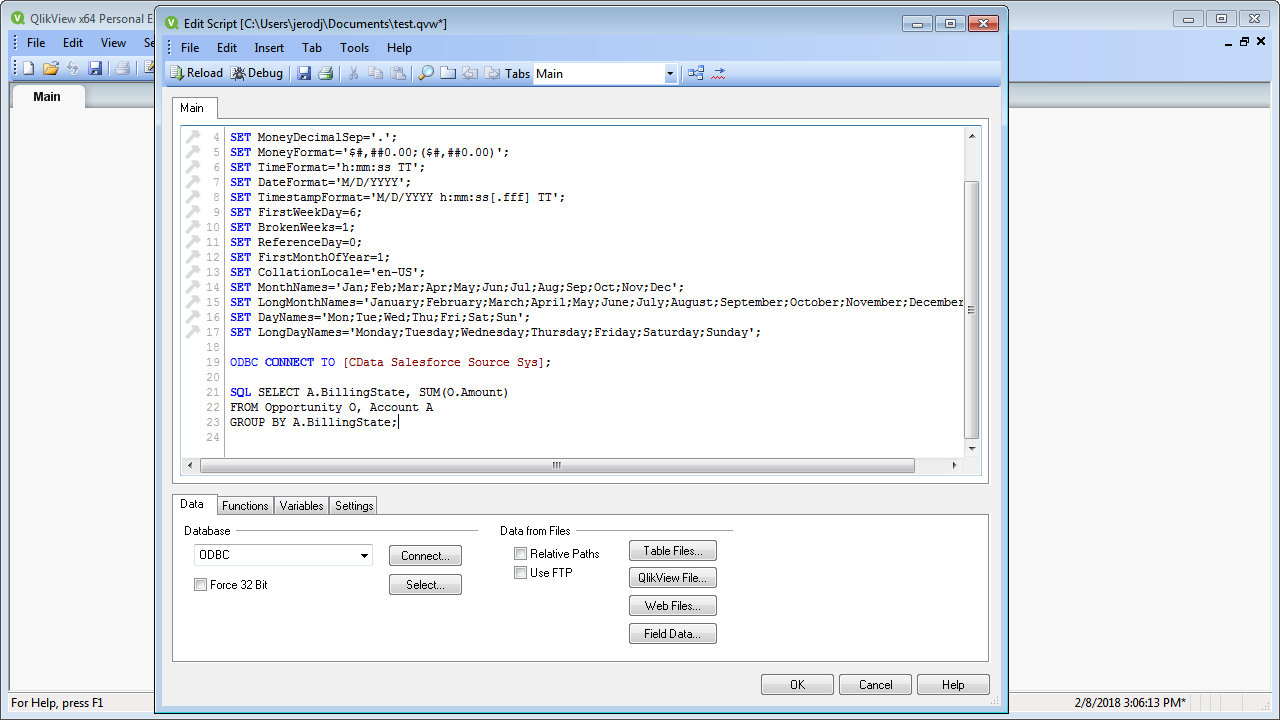
ODBC CONNECT TO [CData SSAS Sys]; - Enter the SQL query directly into the script with the SQL command (or click Select to build the query in the SELECT statement wizard).
SQL SELECT Fiscal_Year, Sales_Amount FROM Adventure_Works;Where possible, the SQL operations in the query, like filters and aggregations, will be pushed down to SQL Analysis Services, while any unsupported operations (which can include SQL functions and JOIN operations) will be managed client-side by the CData SQL engine embedded in the driver.
![A script that connects and executes an SQL query. (Salesforce is shown.)]()
- Close the script editor and reload the document to execute the script.
- Click Tools -> Quick Chart Wizard. In the wizard, select the chart type. This example uses a bar chart. When building the chart, you have access to the fields from SQL Analysis Services, typed appropriately for QlikView, thanks to built-in dynamic metadata querying.
- When defining Dimensions, select Fiscal_Year in the First Dimension menu.
- When defining Expressions, click the summary function you want and select Sales_Amount in the menu.
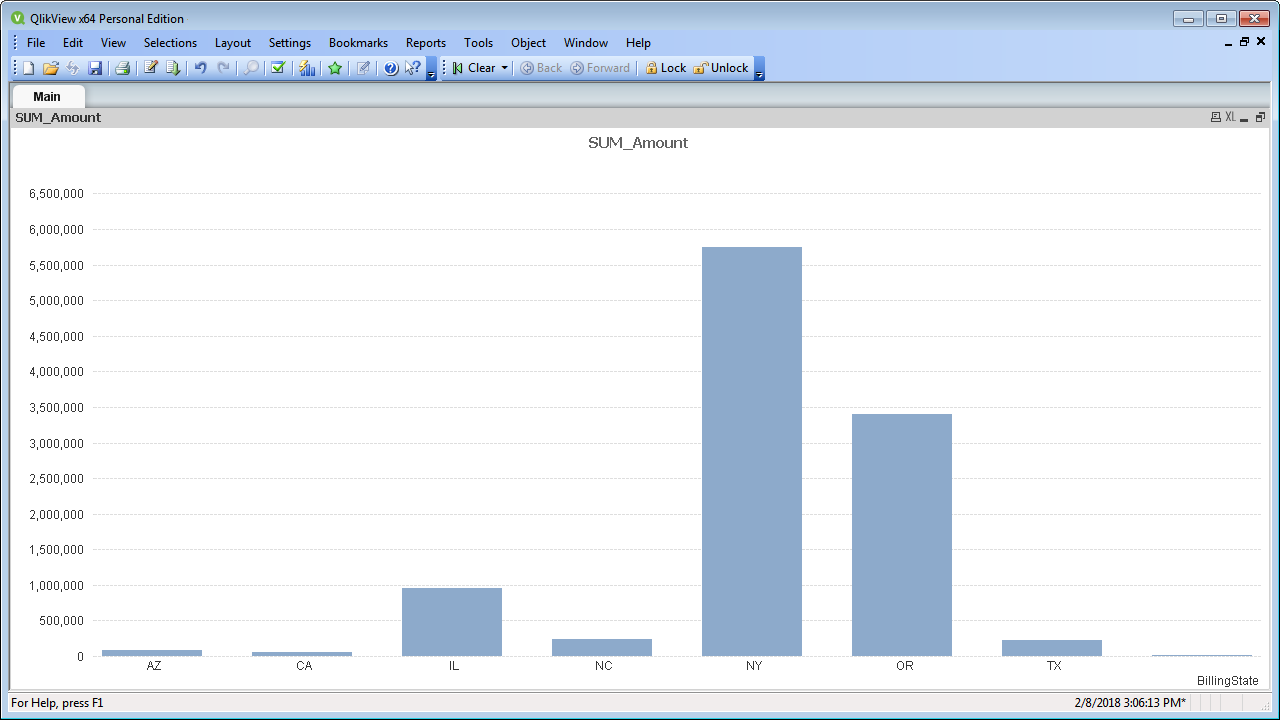
Finish the wizard to generate the chart. The CData ODBC Driver for SQL Analysis Services connects to live SQL Analysis Services data, so the chart can be refreshed to see real-time changes. Live connections are possible and effective, thanks to the high-performance data processing native to CData ODBC Drivers.
![A chart populated with the results of a query. (Salesforce is shown.)]()



 A command like the following is generated:
