Discover how a bimodal integration strategy can address the major data management challenges facing your organization today.
Get the Report →Create Azure Synapse Dashboards in Bold BI
Use CData Connect Server to create a virtual SQL Server Database for Azure Synapse data to build custom dashboards in Bold BI.
Bold BI allows you to create, share, and collaborate on interactive BI dashboards. When paired with CData Connect Server, you get instant access to Azure Synapse data for visualizations, dashboards, and more. This article shows how to create a virtual database for Azure Synapse and build reports from Azure Synapse data in Bold BI.
CData Connect Server provides a pure SQL Server interface for Azure Synapse, allowing you to easily build reports from live Azure Synapse data in Bold BI — without replicating the data to a natively supported database. As you build visualizations, Bold BI generates SQL queries to gather data. Using optimized data processing out of the box, CData Connect Server pushes all supported SQL operations (filters, JOINs, etc) directly to Azure Synapse, leveraging server-side processing to quickly return the requested Azure Synapse data.
Create a Virtual SQL Server Database for Azure Synapse Data
CData Connect Server uses a straightforward, point-and-click interface to connect to data sources and generate APIs.
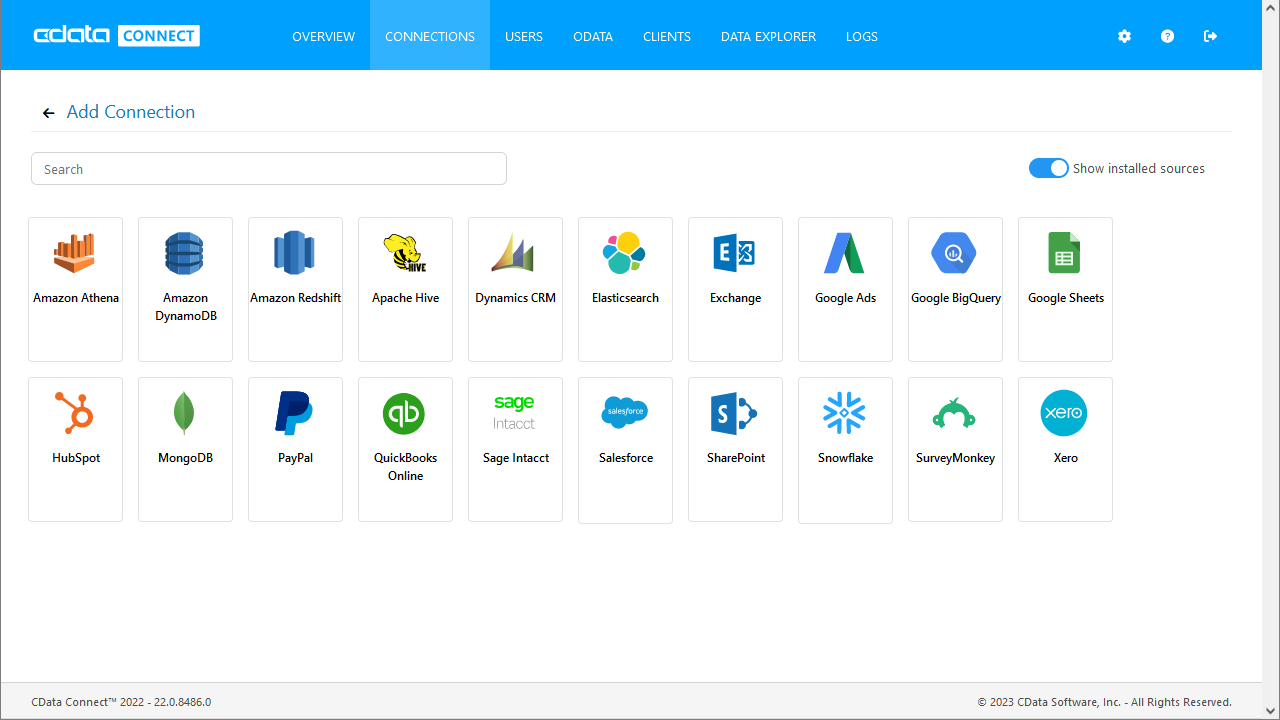
- Login to Connect Server and click Connections.
![Adding a connection]()
- Select "Azure Synapse" from Available Data Sources.
-
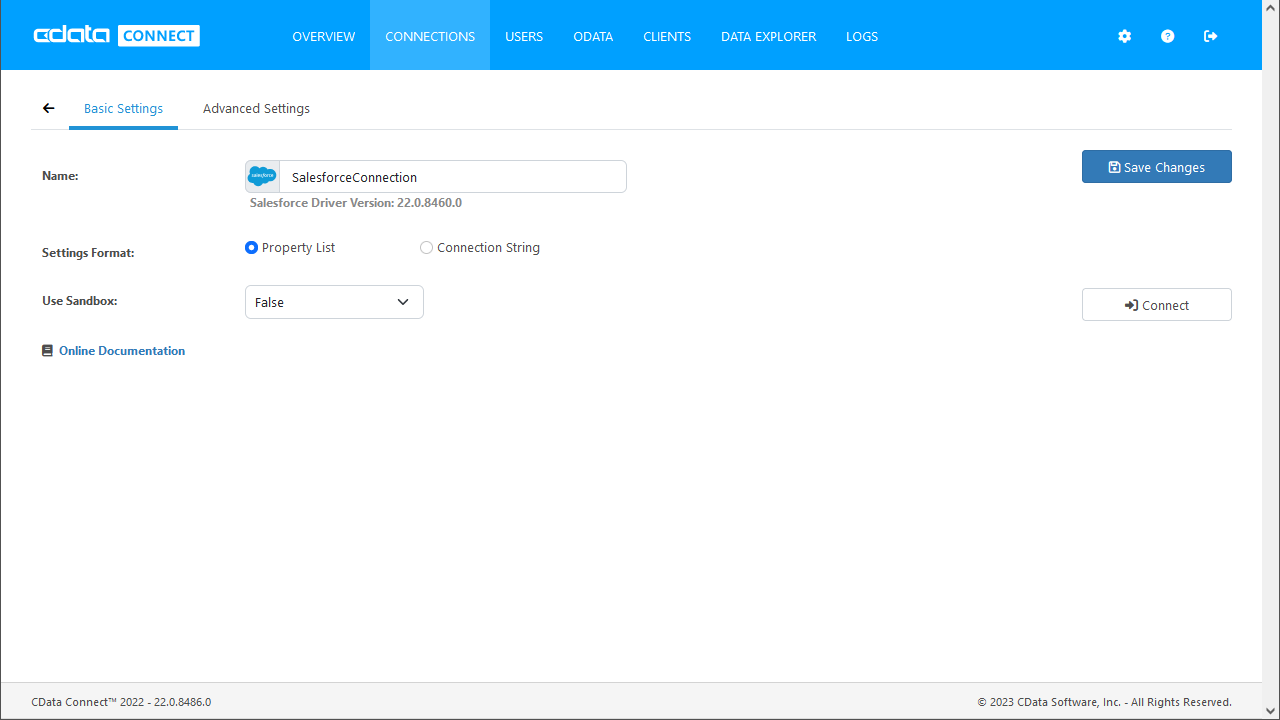
Enter the necessary authentication properties to connect to Azure Synapse.
Connecting to Azure Synapse
In addition to providing authentication (see below), set the following properties to connect to a Azure Synapse database:
- Server: The server running Azure. You can find this by logging into the Azure portal and navigating to Azure Synapse Analytics -> Select your database -> Overview -> Server name.
- Database: The name of the database, as seen in the Azure portal on the Azure Synapse Analytics page.
Authenticating to Azure Synapse
Connect to Azure Synapse using the following properties:
- User: The username provided for authentication with Azure.
- Password: The password associated with the authenticating user.
![Configuring a connection (SQL Server is shown).]()
- Click Save Changes
- Click Privileges -> Add and add the new user (or an existing user) with the appropriate permissions.
With the virtual database created, you are ready to connect to Azure Synapse data from Bold BI.
Visualize Live Azure Synapse Data in Bold BI
The steps below outline connecting to CData Connect Server from Bold BI to create a new Azure Synapse data source and build a simple visualization from the data.
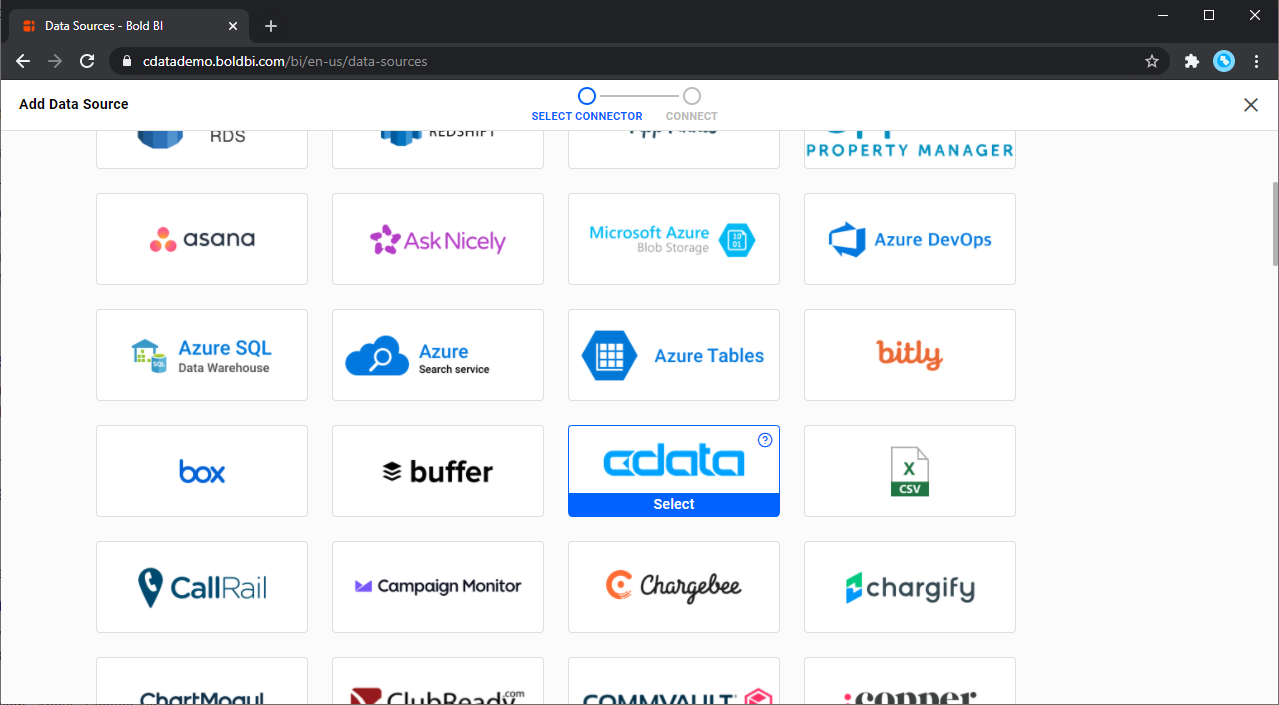
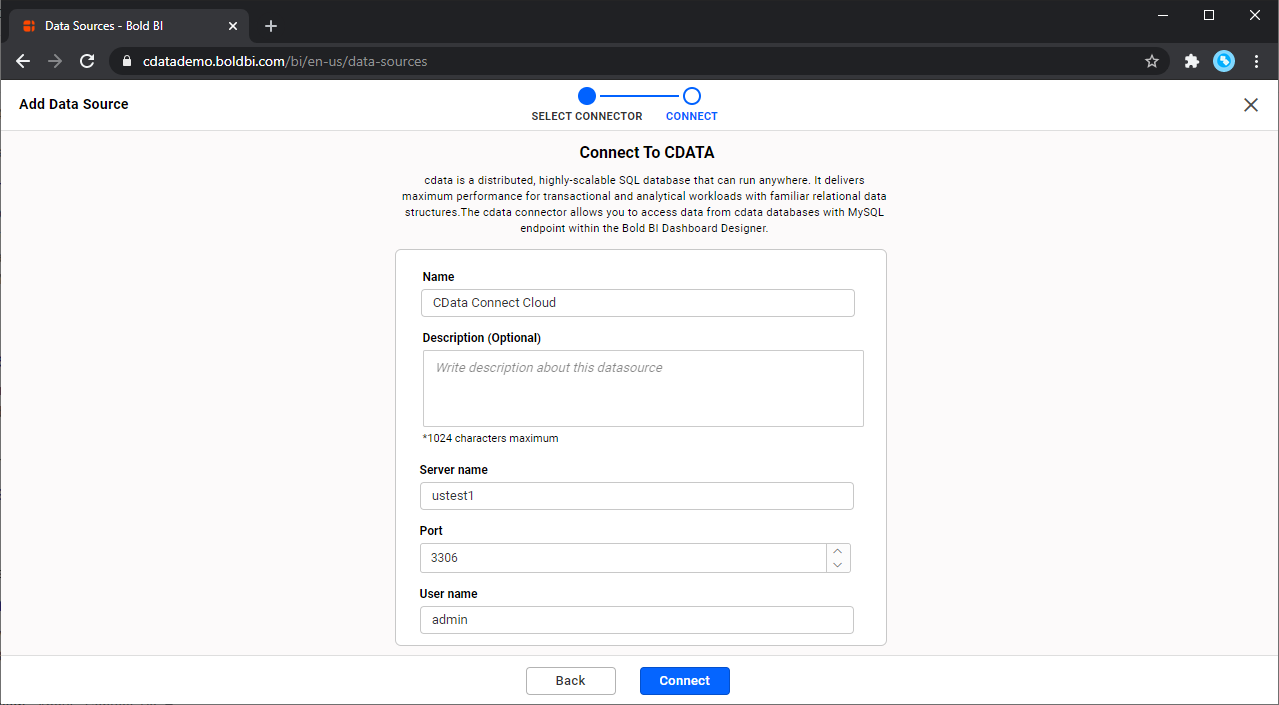
- Log into your Bold BI instance, click the data sources tab, create a new data source, and choose the SQL Server connector.
- Choose the basic configuration and set the connection properties:
- Name: Name your connection
- Server name: Your Connect Server instance (CONNECT_SERVER_URL)
- Port: 1433
- Username: Your Connect Server username
- Password: Your Connect Server password
- Mode: Choose Live to query Azure Synapse on-demand or choose Extract to load the data into Bold BI
- Database: Choose the database you created from the drop-down menu (azuresynapsedb)
- Click Connect
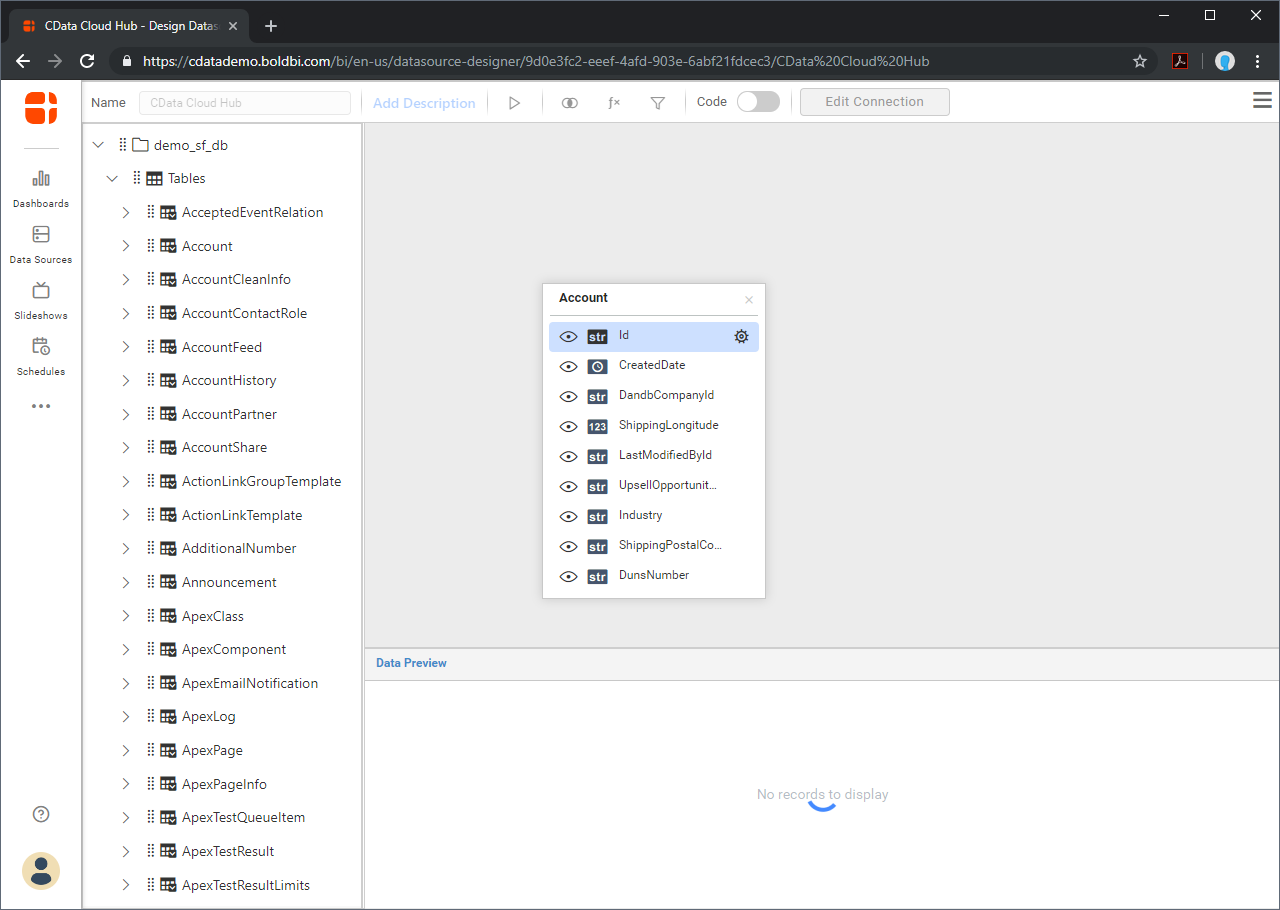
- Select the table to visualize and drag it onto the workspace.
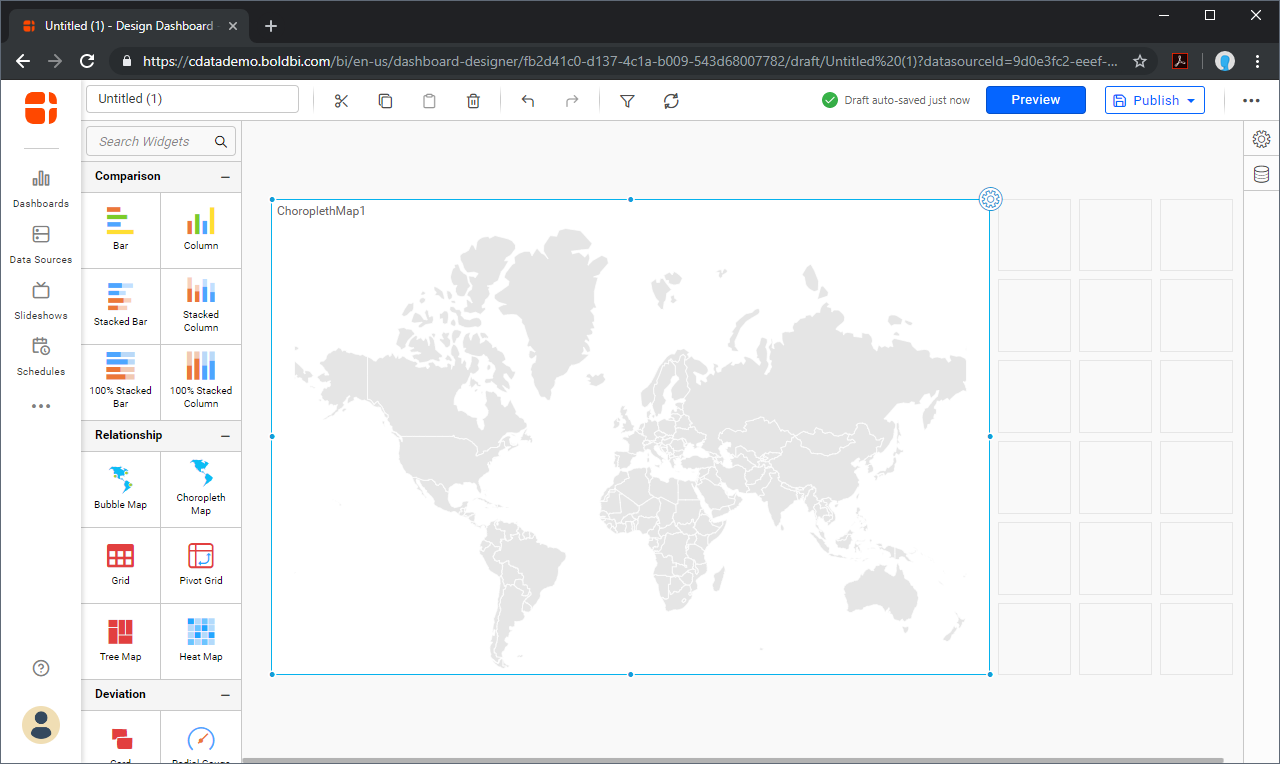
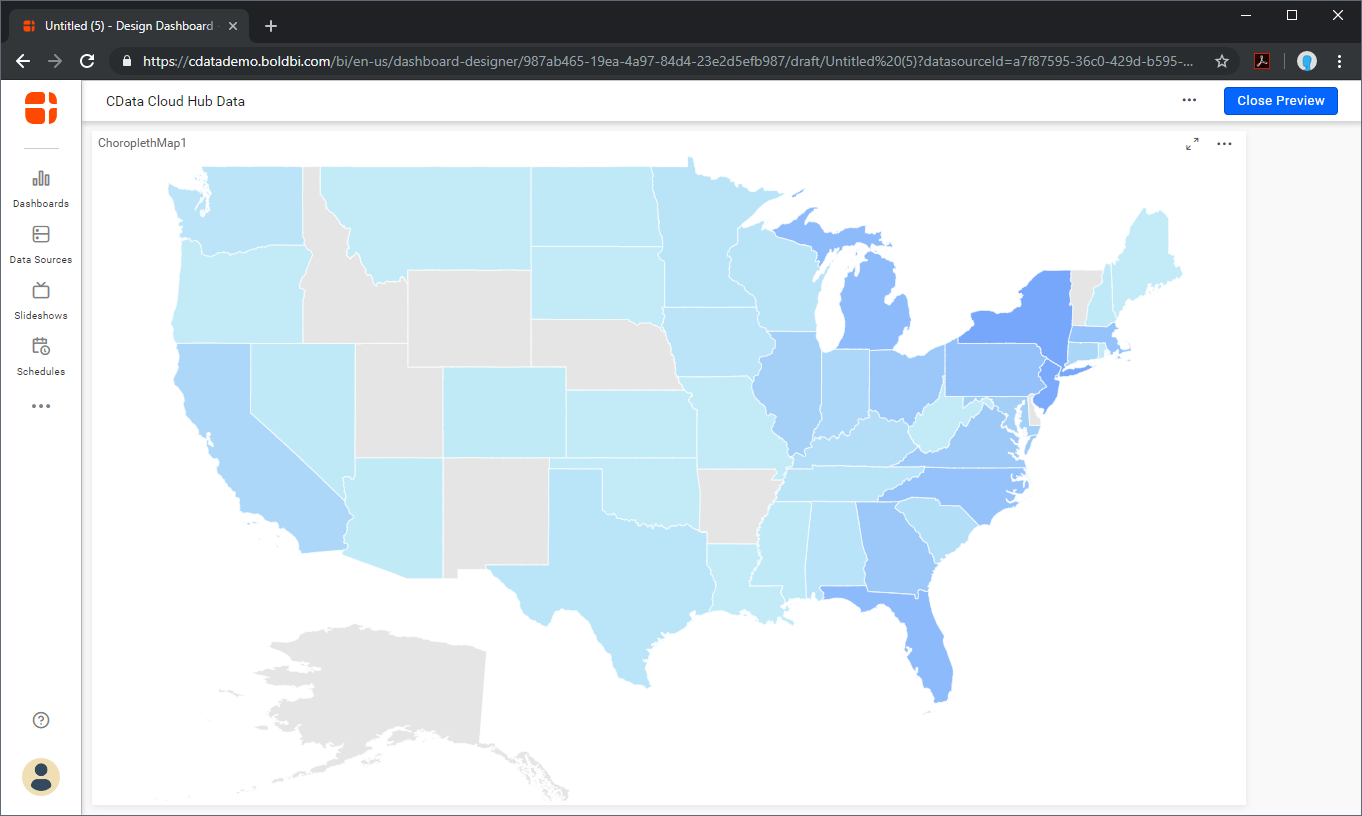
- Select a visualization style and add it to the report.
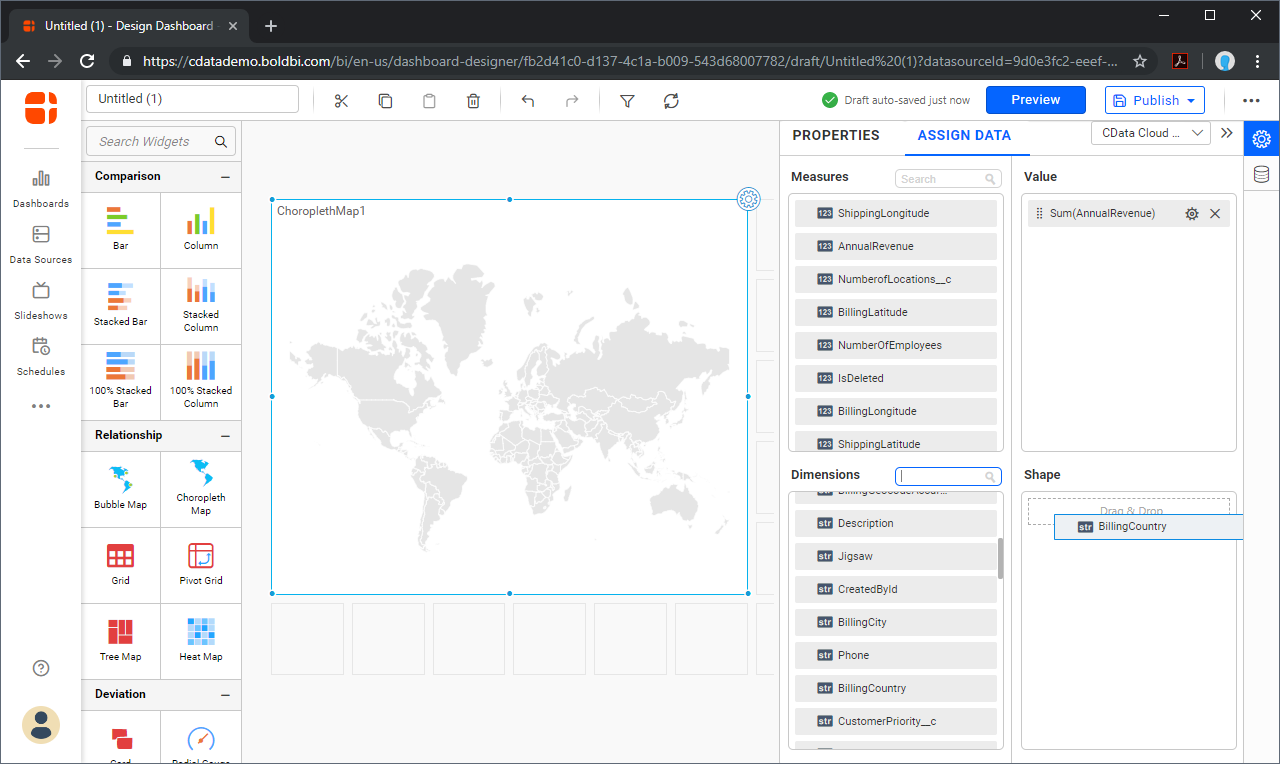
- Click the gear icon for the visualization to configure the visualization properties and assign columns to the visualization.
SQL Access to Azure Synapse Data from Applications
Now you have a direct connection to live Azure Synapse data from your Bold BI workbook. You can create more data sources and new visualizations, build reports, and more — all without replicating Azure Synapse data.
To get SQL data access to 200+ SaaS, Big Data, and NoSQL sources directly from your applications, see the CData Connect page.

