Discover how a bimodal integration strategy can address the major data management challenges facing your organization today.
Get the Report →Visualize Live JSON Services of Power BI Report Builder in Power BI Service
Use CData Power BI Connectors to connect to live JSON services using Power BI Report Builder and create custom reports in the Power BI Service through the On-Premises Gateway.
CData Power BI Connectors provide self-service integration with Microsoft Power BI. The CData Power BI Connector for JSON links your Power BI reports to real-time JSON services. You can monitor JSON services through dashboards and ensure that your analysis reflects JSON services in real time by scheduling refreshes or refreshing on demand. This article details how to use the Power BI Connector to create real-time visualizations of JSON services in Microsoft Power BI Desktop.
Create and Configure a DSN
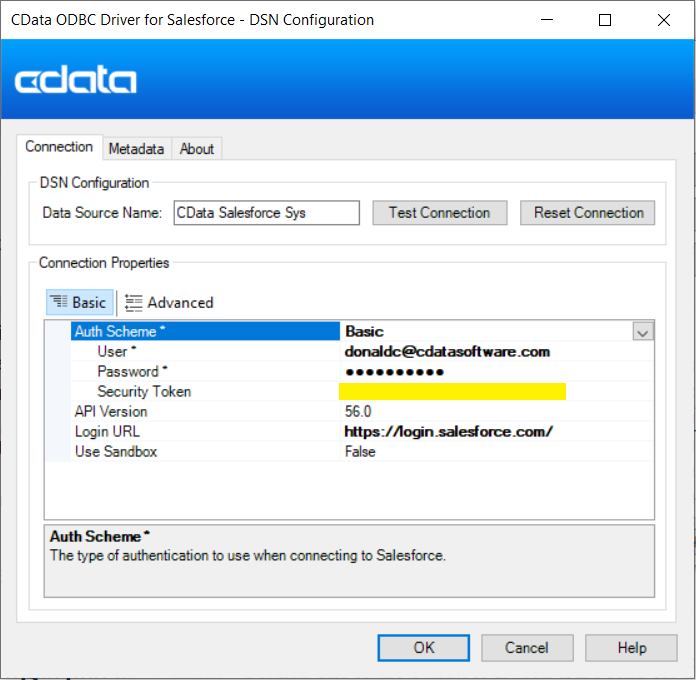
Installing the Power BI Connector creates a DSN (data source name) with the name CData PBI JSON that Power BI uses to connect to the data source. Configure the DSN by filling in the required connection properties.
You can use the Microsoft ODBC Data Source Administrator to create a new DSN or configure (and rename) an existing DSN. From the Start menu, enter "ODBC Data Sources." Ensure that you run the version of the ODBC Administrator that corresponds to the bitness of your Power BI Desktop installation (32-bit or 64-bit).
See the Getting Started chapter in the data provider documentation to authenticate to your data source: The data provider models JSON APIs as bidirectional database tables and JSON files as read-only views (local files, files stored on popular cloud services, and FTP servers). The major authentication schemes are supported, including HTTP Basic, Digest, NTLM, OAuth, and FTP. See the Getting Started chapter in the data provider documentation for authentication guides.
After setting the URI and providing any authentication values, set DataModel to more closely match the data representation to the structure of your data.
The DataModel property is the controlling property over how your data is represented into tables and toggles the following basic configurations.
- Document (default): Model a top-level, document view of your JSON data. The data provider returns nested elements as aggregates of data.
- FlattenedDocuments: Implicitly join nested documents and their parents into a single table.
- Relational: Return individual, related tables from hierarchical data. The tables contain a primary key and a foreign key that links to the parent document.
See the Modeling JSON Data chapter for more information on configuring the relational representation. You will also find the sample data used in the following examples. The data includes entries for people, the cars they own, and various maintenance services performed on those cars.
Get JSON Services
With the data source configured, follow the steps below to load data from JSON tables into a dataset.
Select Tables and Views to Load
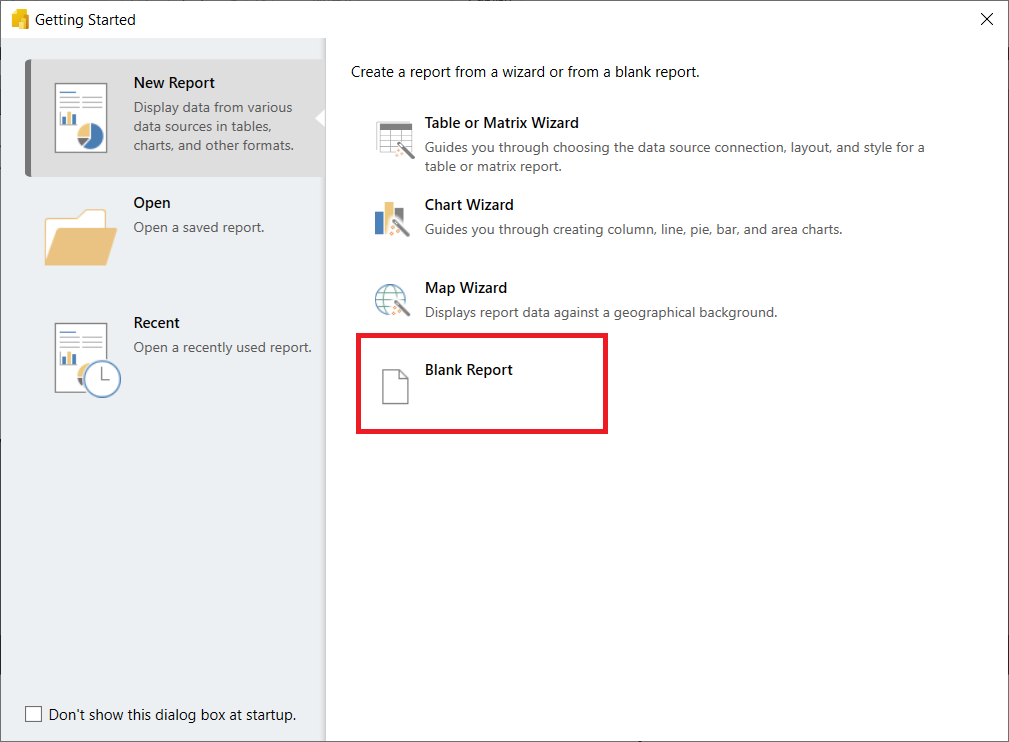
- Open the Power BI Report Builder and choose Blank Report.
![Choose Blank Report in Power BI Report Builder. Choose Blank Report in Power BI Report Builder.]()
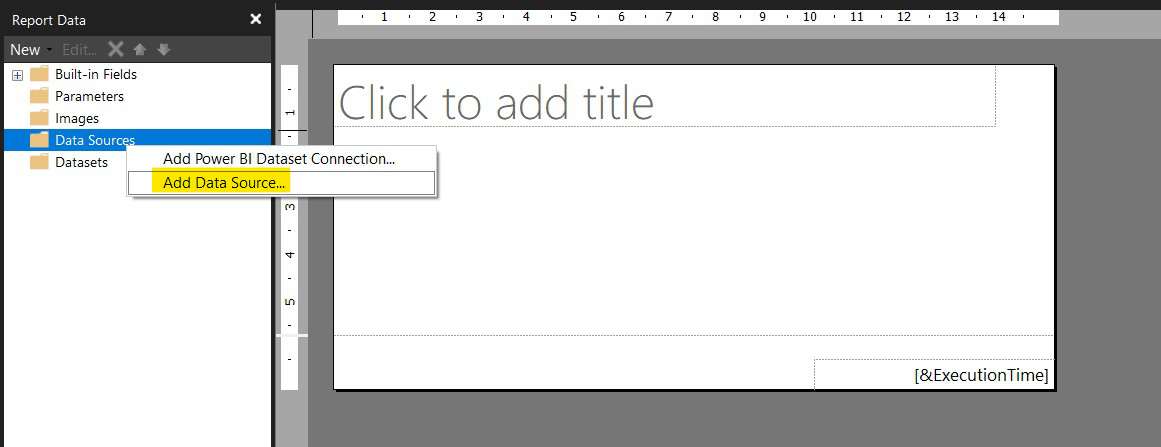
- Click On Data Sources -> Add Data Source.
![Add a Data Source. Add a Data Source.]()
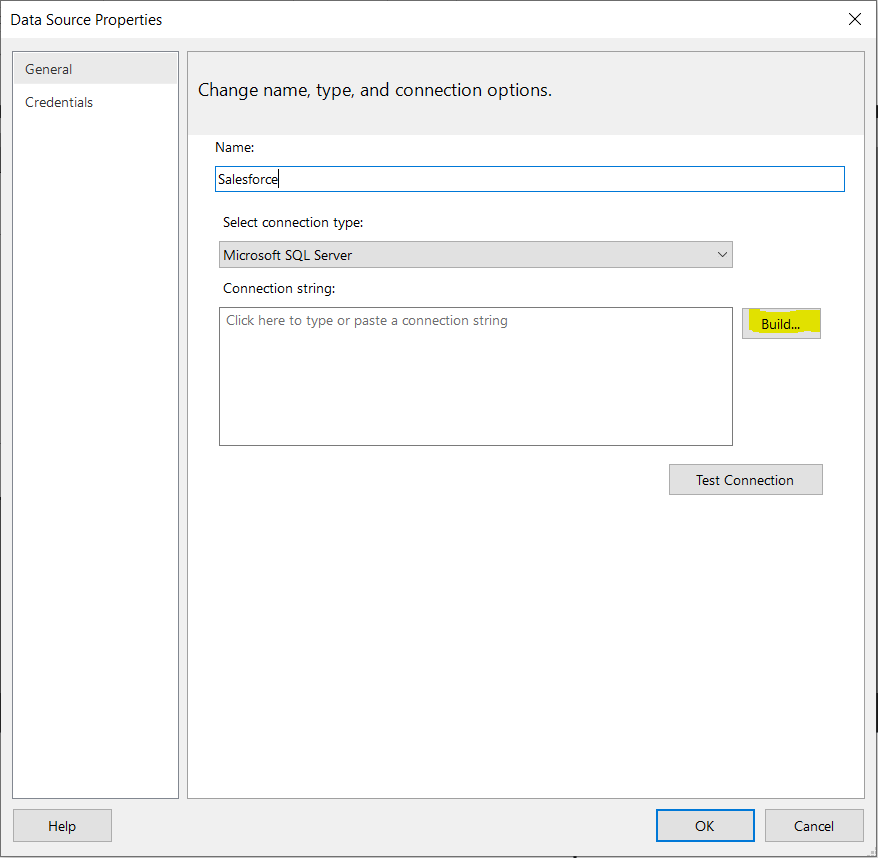
- Choose Connection Type as ODBC and click on "Build."
![Build an ODBC connection Build an ODBC connection]()
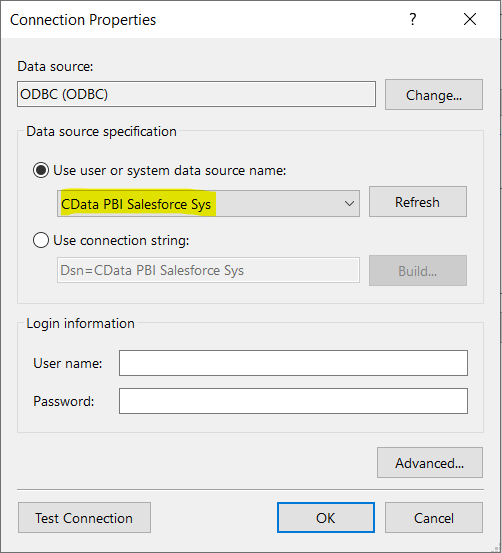
- Click on "Use user or system data source name" and select CData PBI JSON Sys.
![Choose CData Power BI connector for the datasource. Choose CData Power BI connector for the datasource.]()
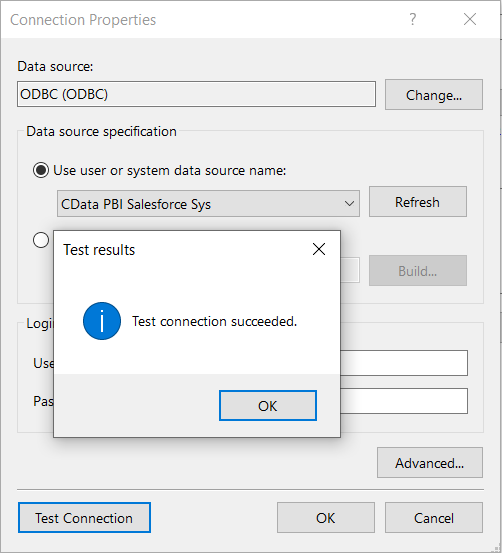
- Click on Test Connection in Connection Properties and make sure it is successful.
![Test the ODBC connection. Test the ODBC connection.]()
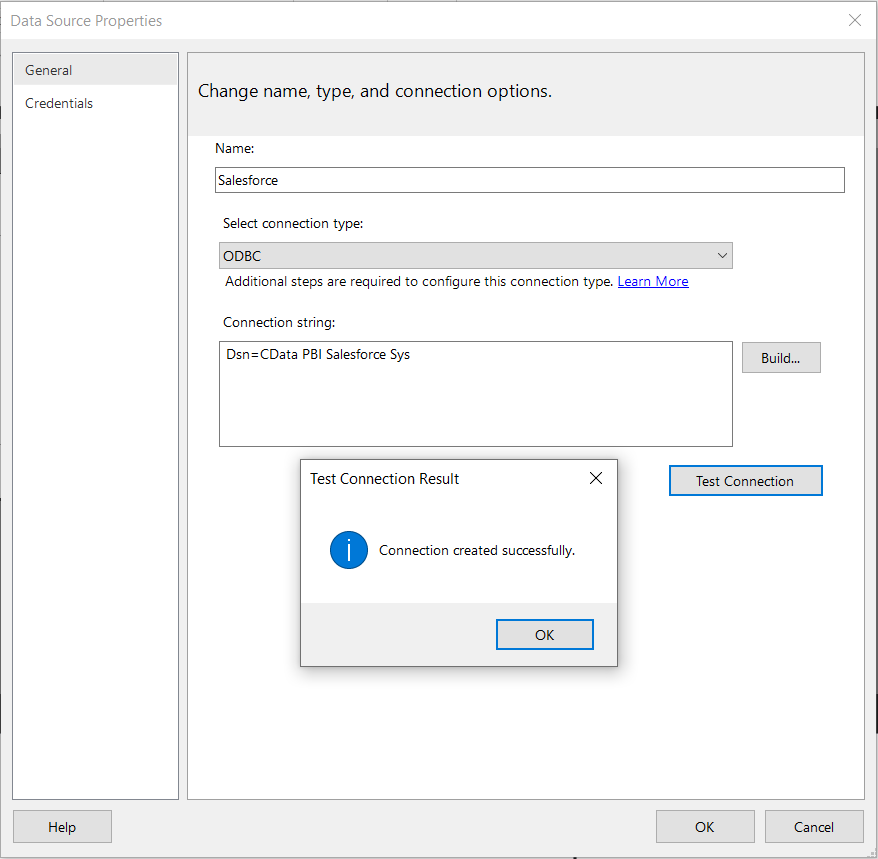
- Click Test Connection in the Data Source Properties Window and click on OK.
![Test the data source connection before adding it. Test the data source connection before adding it.]()
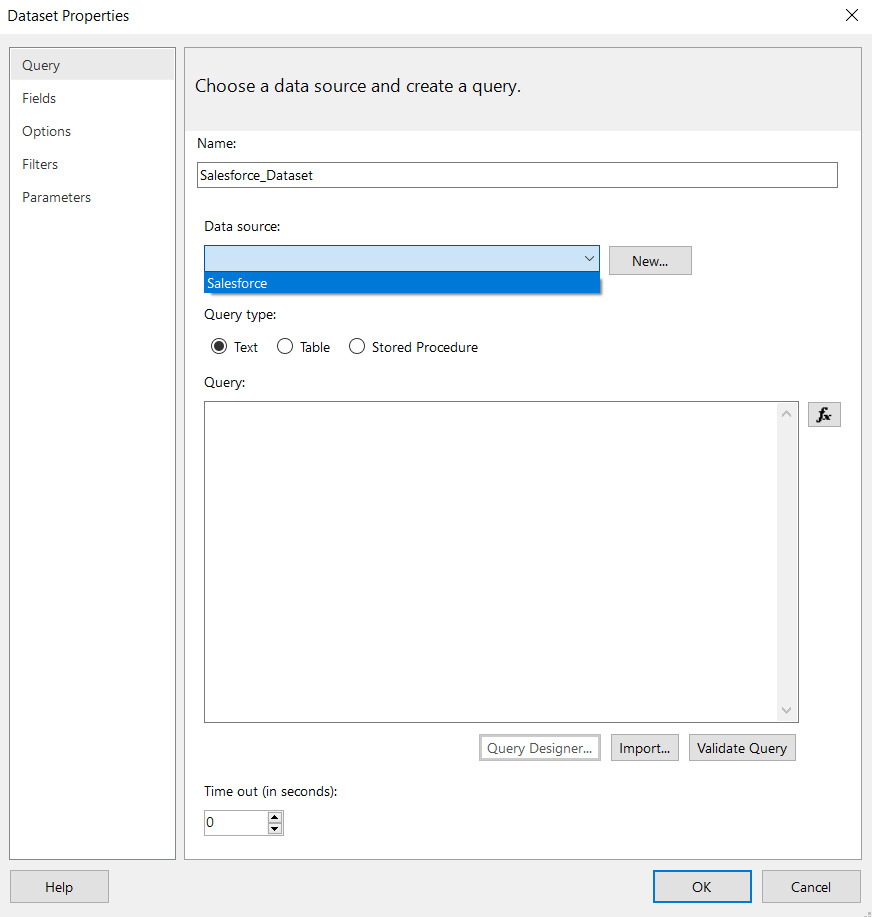
- With the Data Source configured, you can configure the DataSets. Click on DataSets -> Add Dataset. Choose the Data Source you recently configured and click on Query Designer.
![Choose the datasource. Choose the datasource.]()
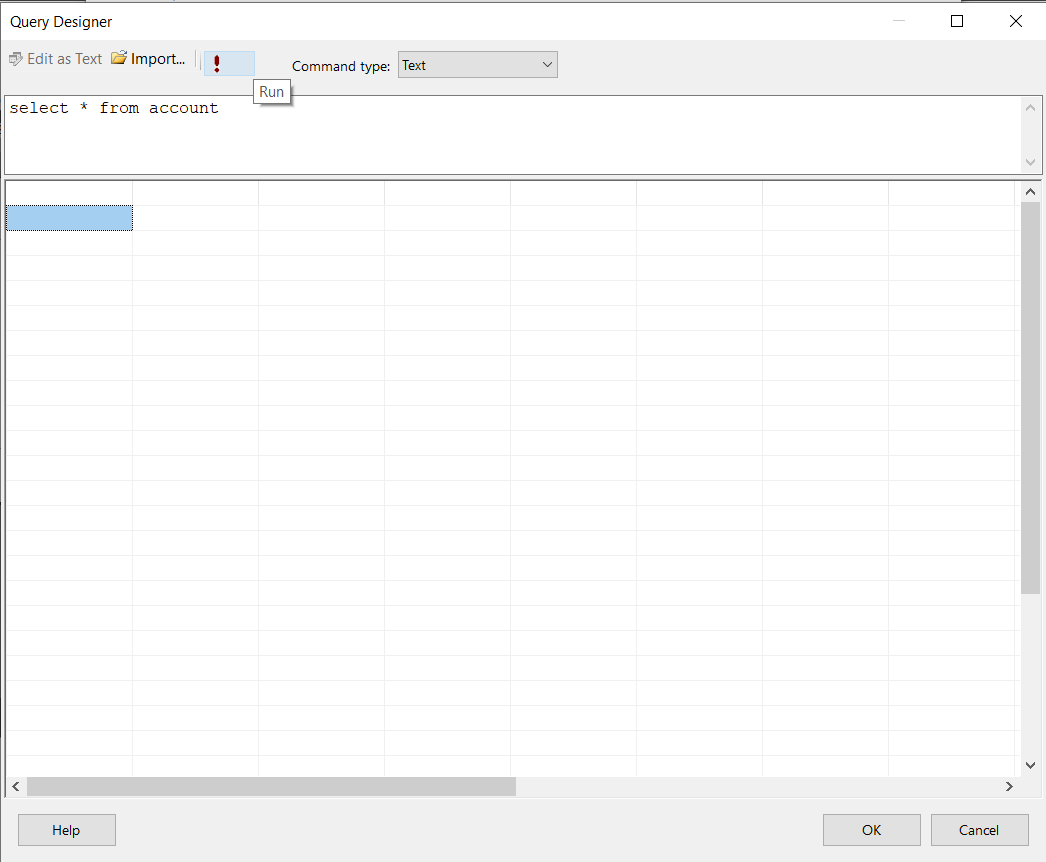
- Write an SQL Command for the table you wish to generate a report on and click "Run" (!). You can find the table names from the Metadata Tab in the CData Connection Manager in DSN.
![Open query designer and run the SQL command. Open query designer and run the SQL command.]()
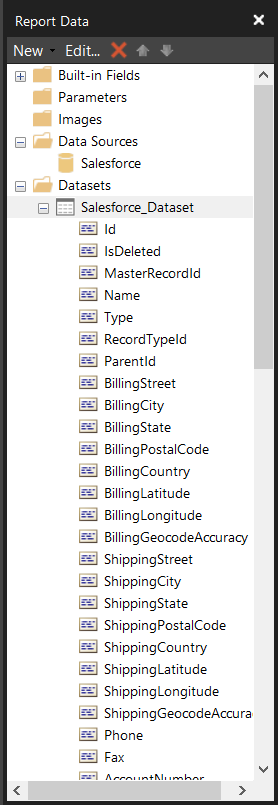
- Click on "Validate Query." You will see the Column names on the left-hand side of the window. Now, you can generate any report according to your use case.
![Data source column names displayed after successful validation Data source column names displayed after successful validation]()
Create Data Visualizations
After loading JSON services into Power BI Report Builder, you can create data visualizations in the Report view by dragging fields from the Fields pane onto the canvas. Follow the steps below to create a chart:
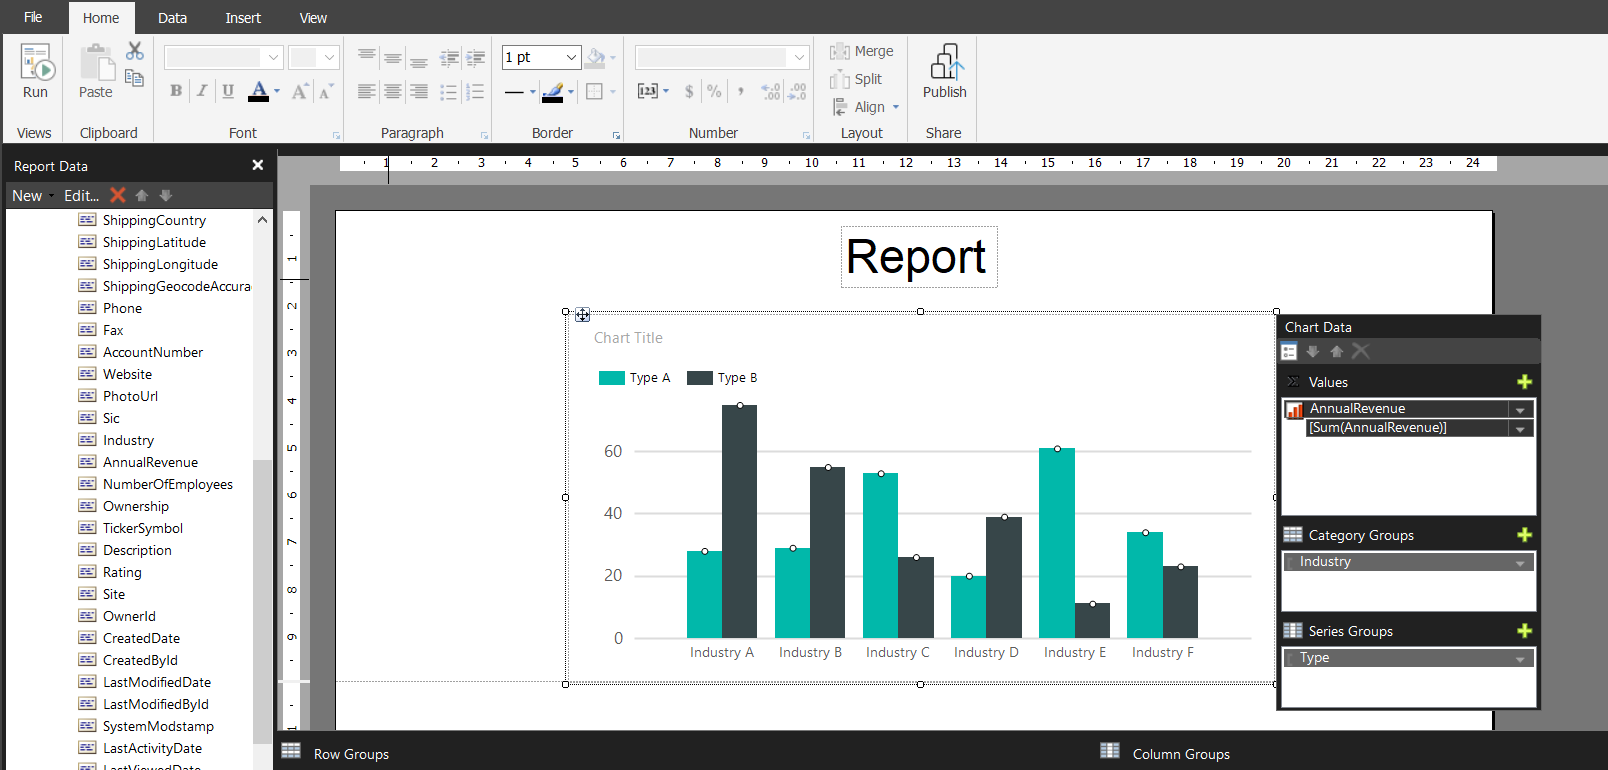
- Navigate to Insert -> Chart -> Insert Chart -> Select Chart Type and click OK.
- Select Values, Category Groups, and Series Groups. You can apply filters to the page, report, or to a single visualization by dragging fields onto the Filters pane. To filter on the field value, select one of the values displayed in the Filters pane.
![Apply filter to create the report structure Apply filter to create the report structure]()
Configure Data Refresh on PowerBI.com
Follow the steps below to configure automatic data refresh through the Power BI Gateway. The gateway enables the Power BI cloud service to connect to the DSN on your machine.
Selecting a Gateway Mode
You need to select a gateway mode when you install the gateway:
- Gateway (personal mode): Use the gateway in personal mode if you only need to publish to PowerBI.com and refresh reports. The gateway runs under your Windows user account.
- Gateway (formerly Enterprise): Use the default gateway if you use other Azure services requiring a gateway. You also need the default gateway if multiple users need to access the gateway. You need a system DSN to connect through the default gateway. (System DSNs can be accessed system-wide, while user DSNs are restricted to a specific user account.) You can use the CData Power BI Salesforce system DSN configured as the last step of the connector installation.
Configuring the Gateway (Personal Mode)
Publishing through the gateway in personal mode requires an installed gateway with access to custom connectors.
- Run the CData Power BI Connector installer. Download the Power BI Gateway (Personal Mode) if you have not already done so.
- Select the on-premises data gateway (personal mode) option.
- Sign in to the gateway.
- In the Connectors section of the gateway settings, enable the "custom data connectors" option. You can also specify an alternate path to the custom data connector .pqx files here.
Note: The CData Power BI Connectors install the .pqx files to the default folder. Path: "Your User Home\Documents\Power BI Desktop\Custom Connectors."
Configuring the Gateway (Standard Mode)
Publishing through the gateway requires an installed gateway with access to customer connectors and a configured connection to the DSN for Salesforce from PowerBI.com.
Set Up the Gateway
Follow the steps below to configure the gateway on your machine:
- Run the CData Power BI Connector installer. If you have not already done so, download the Power BI Gateway (Standard Mode).
- Select the on-premises data gateway (recommended) option.
- Sign into the gateway.
- Name the gateway and specify a recovery key.
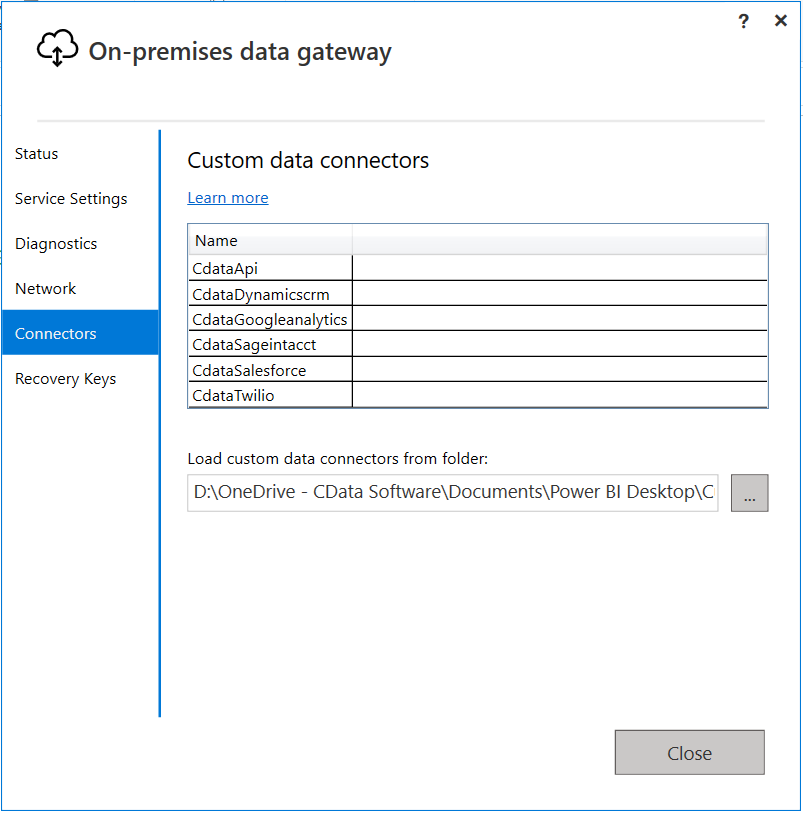
- In the Connectors section, choose a folder where the gateway will look for the CData Power BI Connector. This article uses "C:\Users\PBIEgwService\Documents\Power BI Desktop\Custom Connectors\". Alternatively, copy the .pqx files of the CData Connectors (found in "C:\Users\USERNAME\Documents\Power BI Desktop\Custom Connectors\") to the folder you configured.
Note: The account configured for the service (NT SERVICE\PBIEgwService) must be able to access the folder chosen for the gateway. If needed, you can change the service account in the Service Settings section of the gateway installer.
- Confirm that the entry CData.JSON is in the list in the Connectors section.
![List of CData Power BI connectors. List of CData Power BI connectors.]()
Connect to Salesforce Data from PowerBI.com
- Add a data source to the gateway: Log into PowerBI.com and from the Settings menu, select Manage Gateways and select your gateway.
- Select "Allow user's custom data connectors to refresh through this gateway cluster."
- Click Apply to save your changes.
- Click the option to add a data source to the gateway.
- In the Data Source Settings section, enter a name for the data source. In the Data Source Type menu, select CData Power BI Connector for JSON.
- In the Data Source Name box, enter the system DSN: CData PBI JSON Sys.
Publish to PowerBI.com
You can now publish refreshable reports and their underlying datasets. Follow the steps below to publish and complete the data refresh configuration for a dataset.
- In Power BI Desktop Report Builder, click "Publish" on the Home ribbon to publish the report.
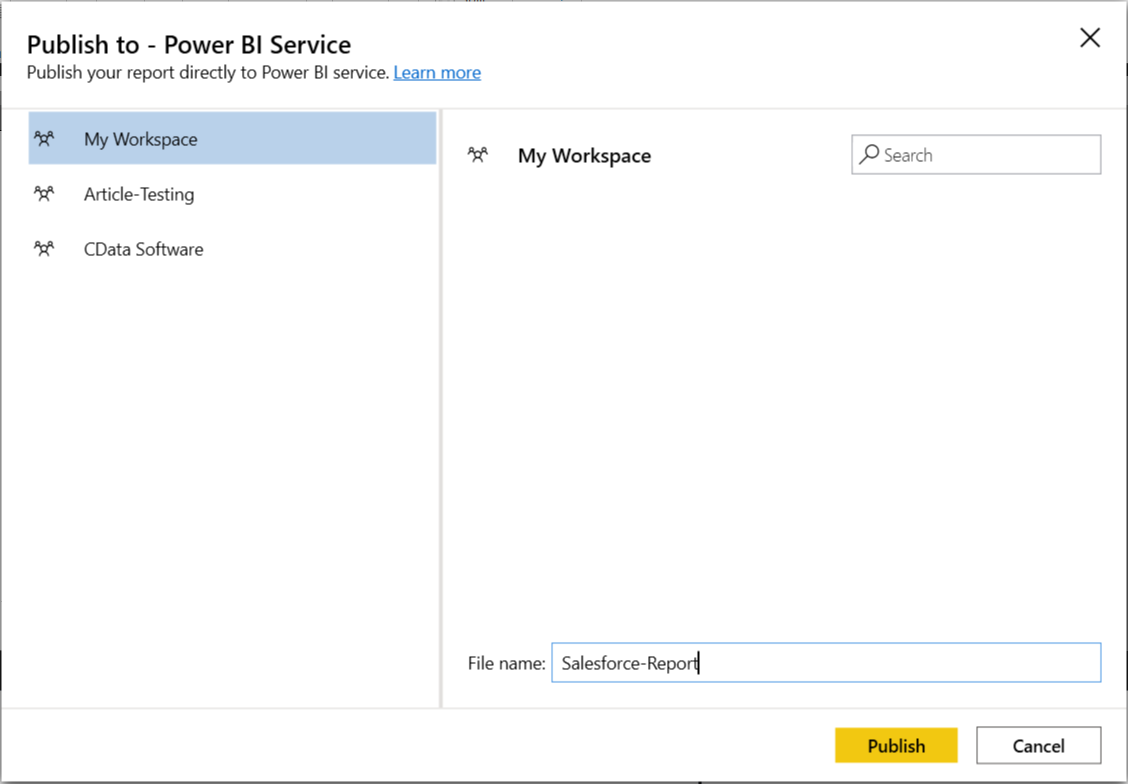
- On PowerBI.com, select the workspace where the report is uploaded and provide a file name.
![Report file name. Report file name.]()
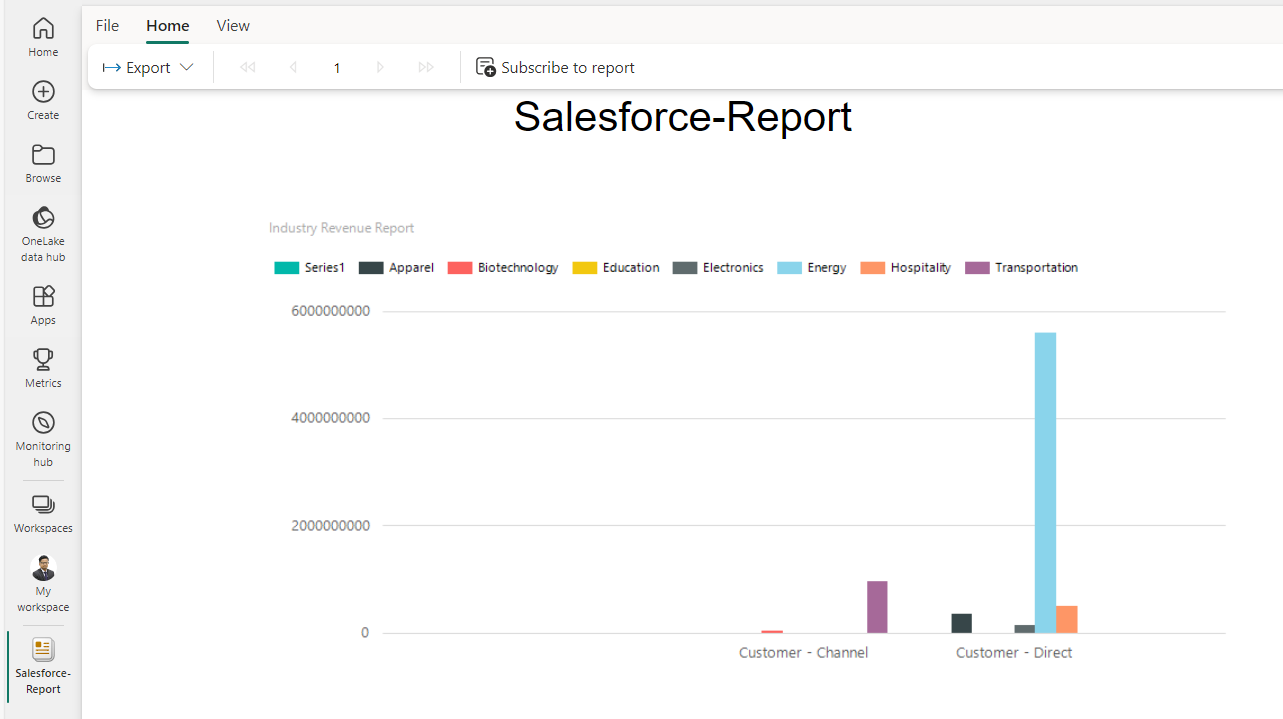
- Click on "Open JSON in Power BI" to open the report in the Power BI Service in your browser.
![Final published report. Final published report.]()
Error Encountered and Solution
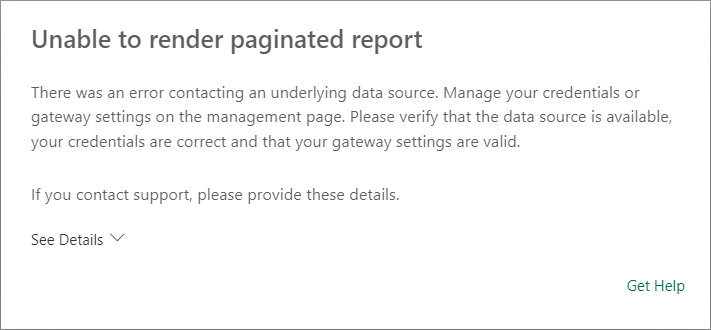
If you get an error message like "Unable to render paginated report," then you can follow the instructions below to resolve the error.
Create a Data Source in the Power BI Service
- Click on "Update data source credentials".
![Update data source credentials. Update data source credentials.]()
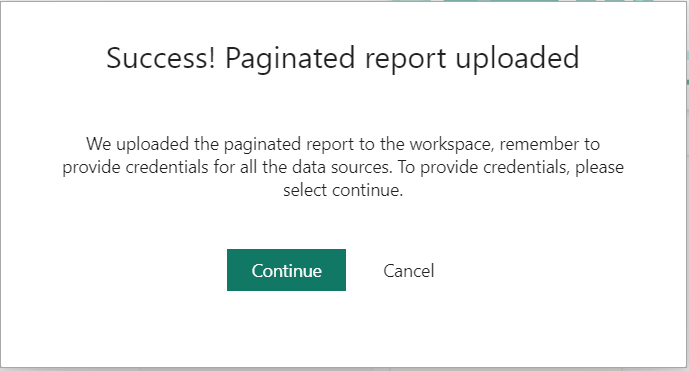
- Click on "Continue".
![Paginated report successfully uploaded. Paginated report successfully uploaded.]()
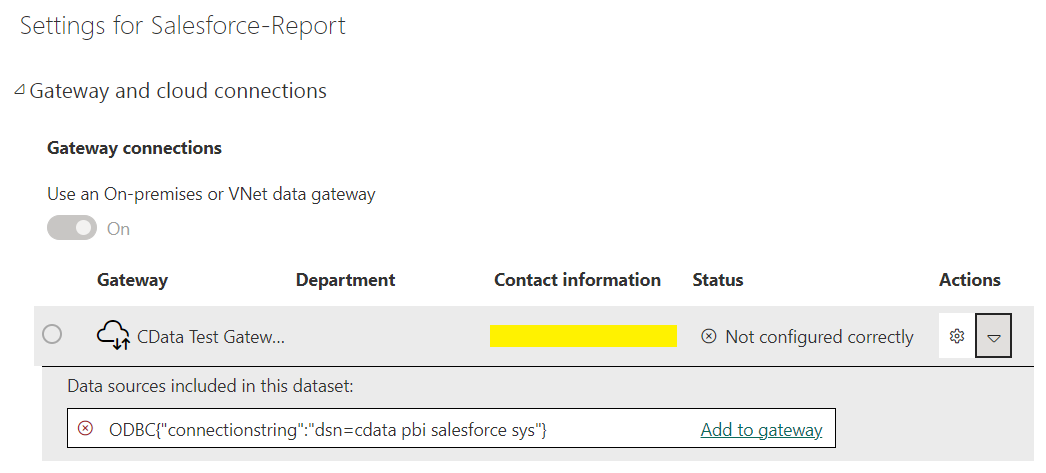
- In the Gateway Connection section, enable the option to use a gateway and select your gateway. You may need to add the data source to the gateway manually:
- Expand the Gateway under the Actions column.
- Click the link to "Manually add to gateway."
![Manually add to gateway properties. Manually add to gateway properties.]()
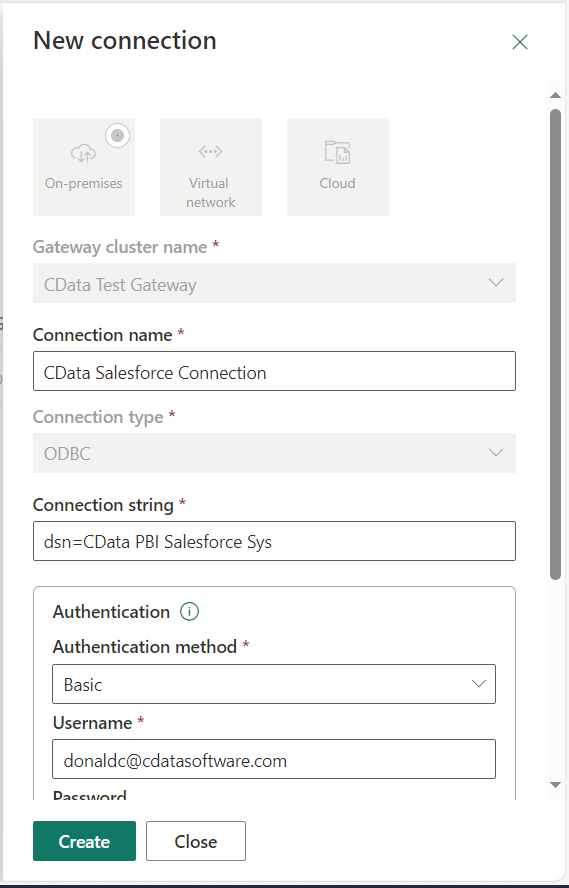
- Click on Add to gateway (refer to the screenshot below). Choose Basic as Authentication because Anonymous Authentication is not supported. Provide the username and password for the Power BI Service Account.
![Enter authentication details. Enter authentication details.]()
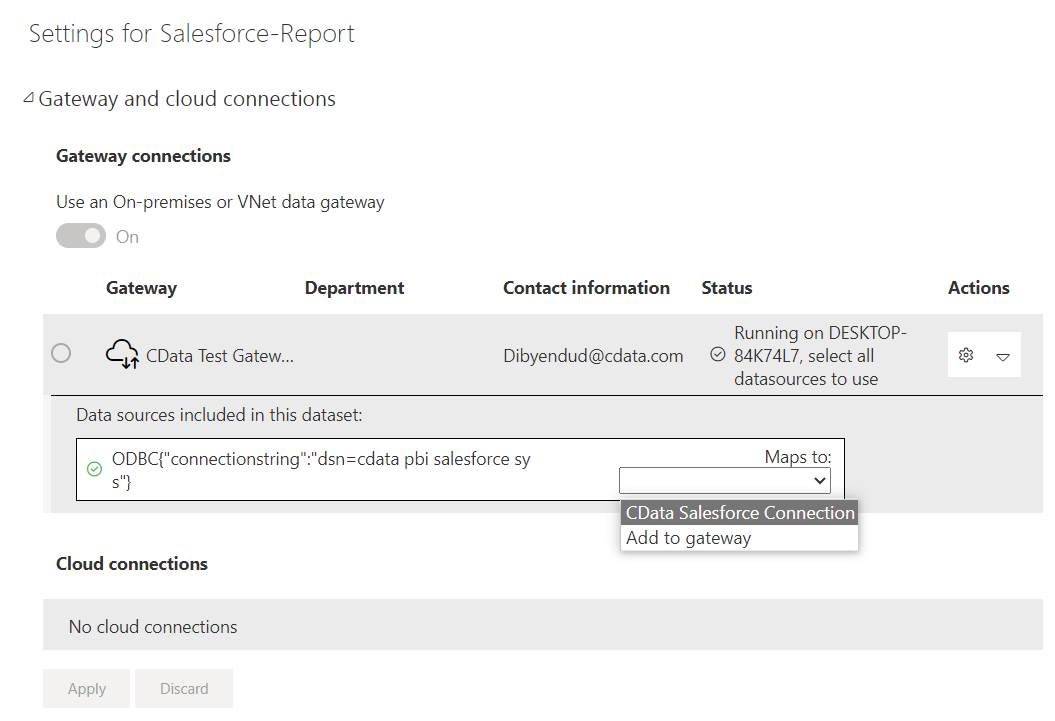
- After the Data Source is successfully created, select the Connection name in "Maps to" and apply the changes.
![Map to the data source connection. Map to the data source connection.]()
- Go to Power BI Report Builder and click "Open JSON in Power BI". You can now see the created report in the Power BI Service (Online).
At this point, you will have a Power BI report built on top of live JSON services using Power BI Report Builder and CData Power BI connectors. Learn more about the CData Power BI Connectors for JSON and download a free trial from the CData Power BI Connector for JSON page. Let our Support Team know if you have any questions.

