Discover how a bimodal integration strategy can address the major data management challenges facing your organization today.
Get the Report →Visualize Twitter Data in Tableau
The CData ODBC driver for Twitter enables you integrate Twitter data into Tableau dashboards.
The CData ODBC Driver for Twitter enables you to access live Twitter data in business intelligence tools like Tableau. In this article, you will integrate Twitter data into a dashboard that reflects changes to Twitter data in real time.
The CData ODBC drivers offer unmatched performance for interacting with live Twitter data in Tableau due to optimized data processing built into the driver. When you issue complex SQL queries from Tableau to Twitter, the driver pushes supported SQL operations, like filters and aggregations, directly to Twitter and utilizes the embedded SQL engine to process unsupported operations (often SQL functions and JOIN operations) client-side. With built-in dynamic metadata querying, you can visualize and analyze Twitter data using native Tableau data types.
Connect to Twitter as an ODBC Data Source
If you have not already, first specify connection properties in an ODBC DSN (data source name). This is the last step of the driver installation. You can use the Microsoft ODBC Data Source Administrator to create and configure ODBC DSNs.
All tables require authentication. You can connect using your User and Password or OAuth. To authenticate using OAuth, you can use the embedded OAuthClientId, OAuthClientSecret, and CallbackURL or you can register an app to obtain your own.
If you intend to communicate with Twitter only as the currently authenticated user, then you can obtain the OAuthAccessToken and OAuthAccessTokenSecret directly by registering an app.
See the Getting Started chapter in the help documentation for a guide to using OAuth.
When you configure the DSN, you may also want to set the Max Rows connection property. This will limit the number of rows returned, which is especially helpful for improving performance when designing reports and visualizations.
Add Twitter Data to a Dashboard
- Click Connect to Data -> More Servers -> Other Databases (ODBC).
Select the CData Data Source Name (for example: CData Twitter Source). - In the Database menu, select CData.
- In the Table box, enter a table name or click New Custom SQL to enter an SQL query. This article retrieves the Tweets table.
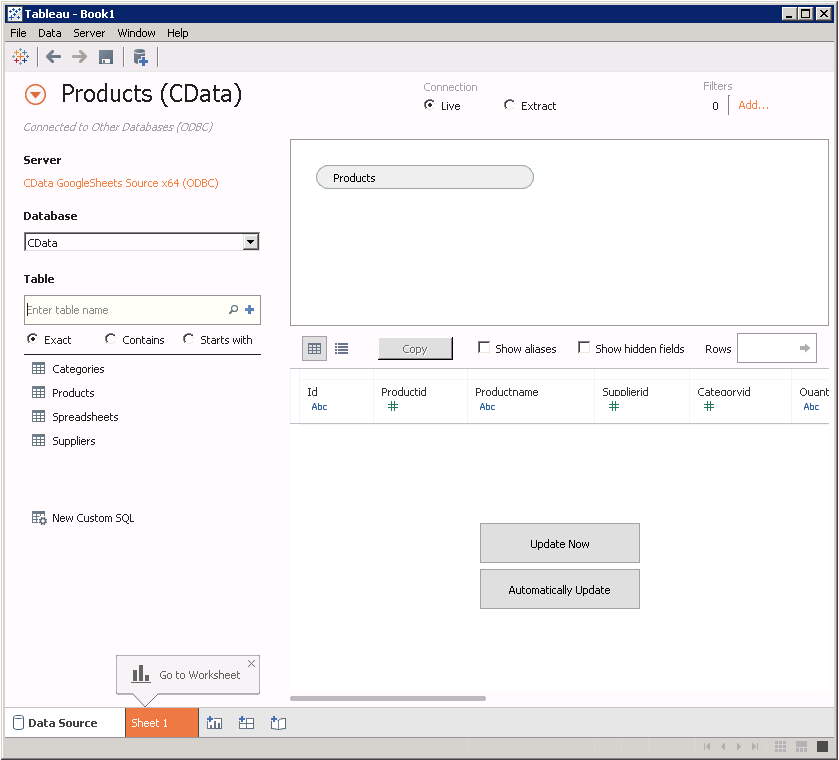
- Drag the table onto the join area. At this point, you can include multiple tables, leveraging the built-in SQL engine to process complex data requests.
![A connection to a single table. (Google Sheets is shown.)]()
- In the Connection menu, select the Live option, so that you skip loading a copy of the data into Tableau and instead work on real-time data. The optimized data processing native to CData ODBC drivers enables unmatched performance in live connectivity.
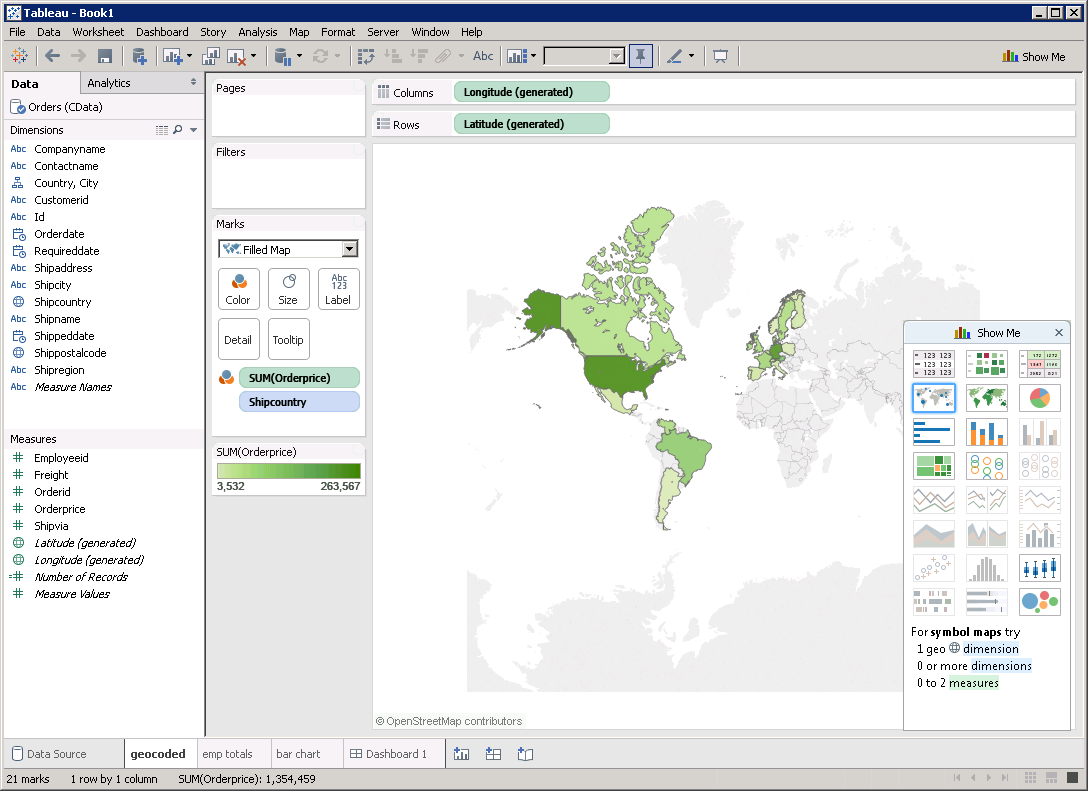
- Click the tab for your worksheet. Columns are listed as Dimensions and Measures, depending on the data type. The CData driver discovers data types automatically, allowing you to leverage the powerful data processing and visualization features of Tableau.
- Drop the From_User_Name column in the Dimensions pane onto the dashboard. When you select dimensions, Tableau builds a query to the driver. The results are grouped based on that dimension. In Tableau, the raw query is automatically modified as you select dimensions and measures.
Drag the Retweet_Count column in the Measures field onto the Detail and Color buttons. Tableau executes the following query:
SELECT From_User_Name, SUM(Retweet_Count) FROM Tweets GROUP BY From_User_NameWhen you select a measure, Tableau executes a command to the driver to calculate a summary function, such as SUM, AVG, etc., on the grouped values. The SQL engine (embedded within the driver) is leveraged to process the aggregation of the data, where needed, providing a seamless experience in Tableau, regardless of the data source.
To change the summary function, open the Retweet_Count menu and select the summary you want in the Measure command.
![A simple visualization that shows the latest data.]()
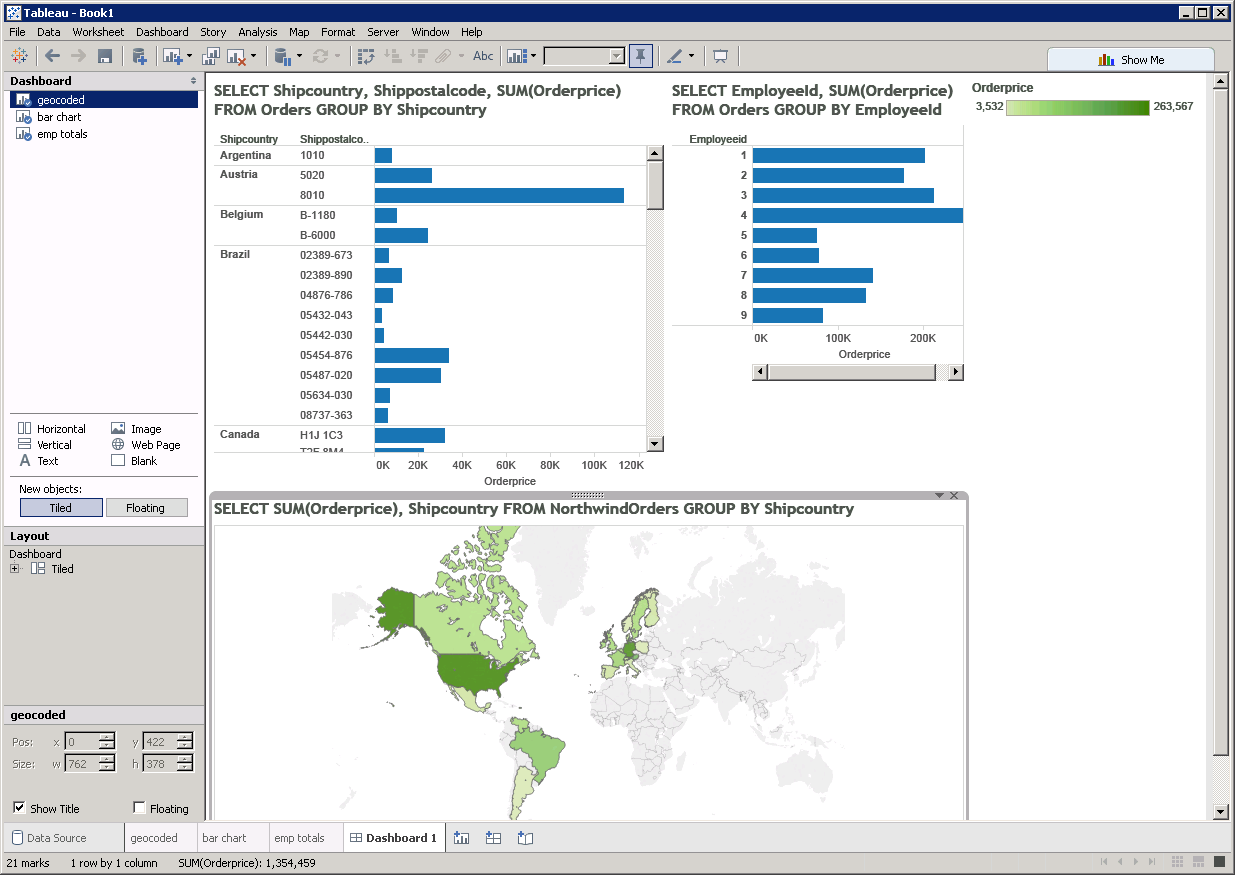
You can create other charts using dimensions and measures to build SQL queries visually:
![A dashboard with several visualizations. The SQL query that corresponds to each chart is shown next to the chart. (Google Sheets is shown.)]()
With the CData ODBC Driver for Twitter, you get live connectivity to your Twitter data, allowing you to build real-time charts, graphs, and more.

