Discover how a bimodal integration strategy can address the major data management challenges facing your organization today.
Get the Report →Visualize Live Amazon S3 Data in Tableau
Use CData Tableau Connectors and Tableau Desktop to visualize live Amazon S3 data.
Tableau is a visual analytics platform transforming the way businesses use data to solve problems. When paired with the CData Tableau Connector for Amazon S3, you can easily get access to live Amazon S3 data within Tableau. This article shows how to connect to Amazon S3 in Tableau and build a simple chart.
The CData Tableau Connectors enable high-speed access to live Amazon S3 data in Tableau. Once you install the connector, you simply authenticate with Amazon S3 and you can immediately start building responsive, dynamic visualizations and dashboards. By surfacing Amazon S3 data using native Tableau data types and handling complex filters, aggregations, & other operations automatically, CData Tableau Connectors grant seamless access to Amazon S3 data.
NOTE: The CData Tableau Connectors require Tableau 2020.3 or higher. If you are using an older version of Tableau, you will need to use the CData Tableau Connector for Amazon S3. If you wish to connect to Amazon S3 data in Tableau Cloud, you will need to use CData Connect Cloud.
Connect to Amazon S3 in Tableau
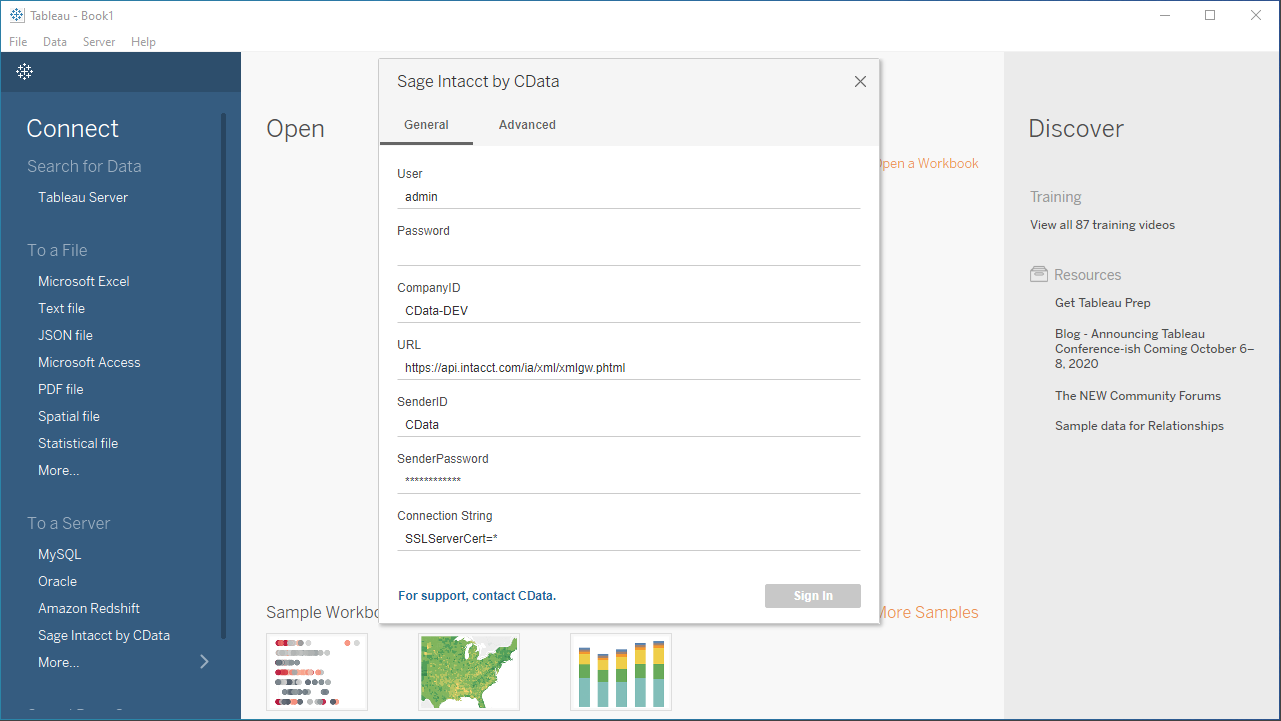
Open Tableau and click More under Connect -> To a Server. Select "Amazon S3 by CData," then configure the connection and click "Sign In."
To authorize Amazon S3 requests, provide the credentials for an administrator account or for an IAM user with custom permissions. Set AccessKey to the access key Id. Set SecretKey to the secret access key.
Note: You can connect as the AWS account administrator, but it is recommended to use IAM user credentials to access AWS services.
For information on obtaining the credentials and other authentication methods, refer to the Getting Started section of the Help documentation.
Discover Schemas and Query Data
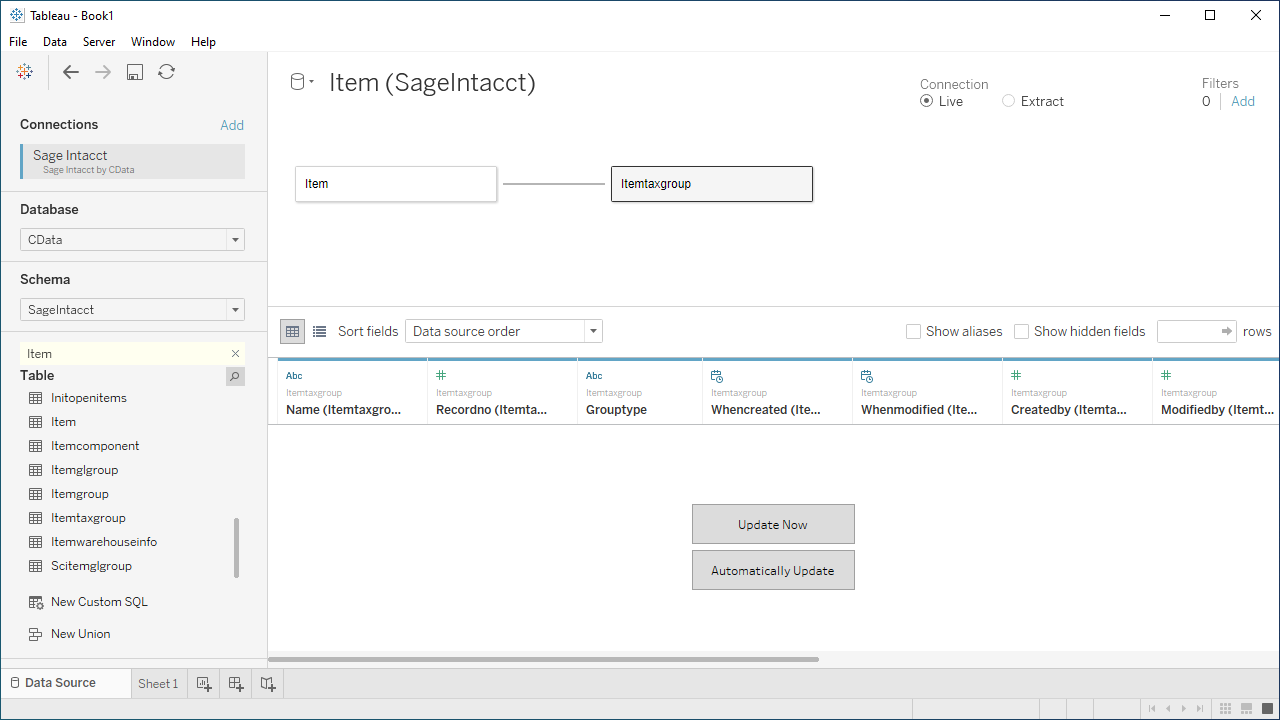
- Select CData from the Database pull-down menu.
- Select AmazonS3 from the Schema pull-down menu.
- Drag the tables and views you wish to visualize onto the join area. You can include multiple tables.
![Selecting table(s)]()
- Select Update Now or Automatically Update. Update Now lets you preview the first 10,000 rows of the data source (or enter the number of rows you want to see in the Rows text box). Automatically Update automatically reflects the changes in the preview area.
- Click the tab for your worksheet. Columns are listed as Dimensions and Measures, depending on the data type. The CData Tableau Connector discovers data types automatically, allowing you to leverage the powerful data processing and visualization features of Tableau.
- Drag a field from the Dimensions or Measures area to Rows or Columns. Tableau creates column or row headers.
- Select one of the chart types from the Show Me tab. Tableau displays the chart type that you selected.
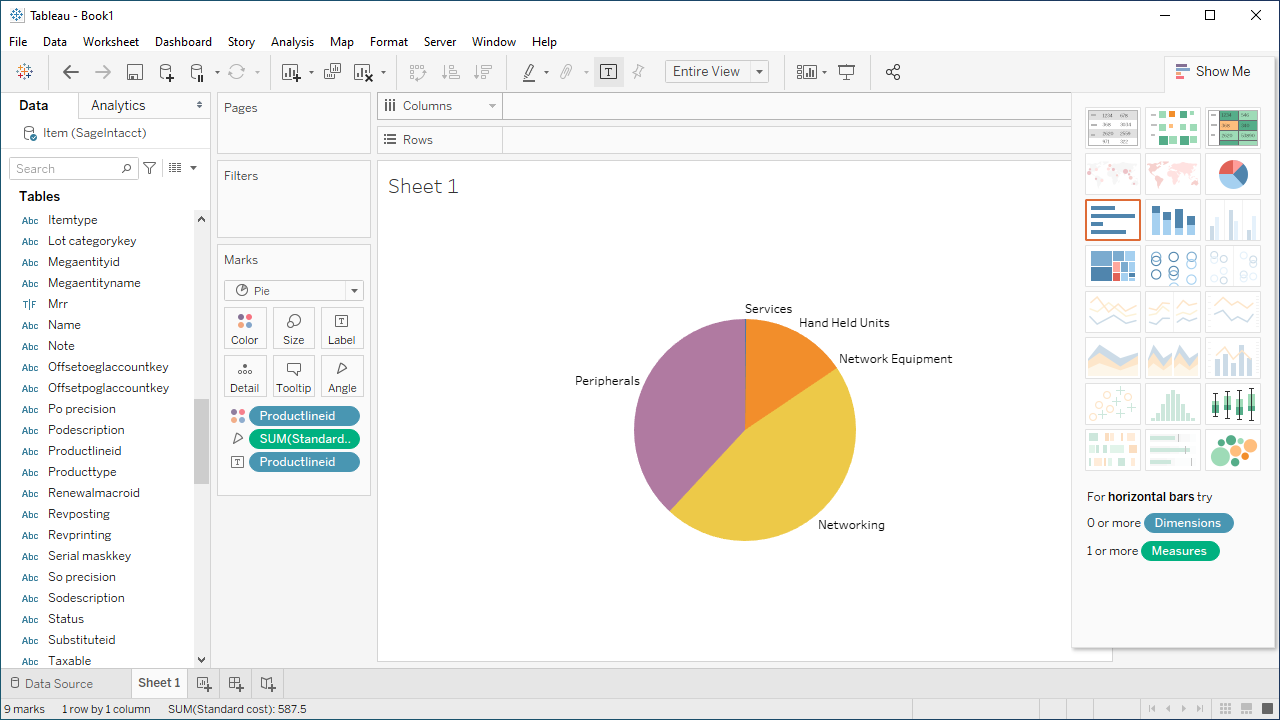
Using the CData Tableau Connector for Amazon S3 with Tableau, you can easily create robust visualizations and reports on Amazon S3 data. Download a free, 30-day trial and get started today.

