Discover how a bimodal integration strategy can address the major data management challenges facing your organization today.
Get the Report →Consume Sage 50 UK OData Feeds in SAP Lumira
Use the API Server to create data visualizations on Sage 50 UK feeds that reflect any changes in SAP Lumira.
You can use the CData API Server and the ADO.NET Provider for Sage 50 UK (or any of 200+ other ADO.NET Providers) to create data visualizations based on Sage 50 UK data in SAP Lumira. The API Server enables connectivity to live data: dashboards and reports can be refreshed on demand. This article shows how to create a chart that is always up to date.
Set Up the API Server
Follow the steps below to begin producing secure Sage 50 UK OData services:
Deploy
The API Server runs on your own server. On Windows, you can deploy using the stand-alone server or IIS. On a Java servlet container, drop in the API Server WAR file. See the help documentation for more information and how-tos.
The API Server is also easy to deploy on Microsoft Azure, Amazon EC2, and Heroku.
Connect to Sage 50 UK
After you deploy the API Server and the ADO.NET Provider for Sage 50 UK, provide authentication values and other connection properties needed to connect to Sage 50 UK by clicking Settings -> Connection and adding a new connection in the API Server administration console.
Note: Only Sage 50 UK 2012 and above are supported.
The User and Password properties, under the Connection section, must be set to valid Sage 50 UK user credentials. These values will be the same used to log in to the Sage 50 UK software.
Additionally, the URL property, under the Connection section, will need to be set to the address of the company dataset desired. To obtain the address, do the following:
- If you have not already done so, open the Sage 50 UK software.
- Click Tools -> Internet Options.
- Select the SData Settings tab.
- Click the Details button next to Sage 50 Accounts. A window is displayed containing a list of company names along with the address to their corresponding datasets.
- Set the URL property to the value in the address field next to the company desired.
When you configure the connection, you may also want to set the Max Rows connection property. This will limit the number of rows returned, which is especially helpful for improving performance when designing reports and visualizations.
You can then choose the Sage 50 UK entities you want to allow the API Server access to by clicking Settings -> Resources.
Authorize API Server Users
After determining the OData services you want to produce, authorize users by clicking Settings -> Users. The API Server uses authtoken-based authentication and supports the major authentication schemes. Access can also be restricted based on IP address; by default, only connections to the local machine are allowed. You can authenticate as well as encrypt connections with SSL.
Connect to Sage 50 UK from SAP Lumira
Follow the steps below to retrieve Sage 50 UK data into SAP Lumira. You can execute an SQL query or use the UI.
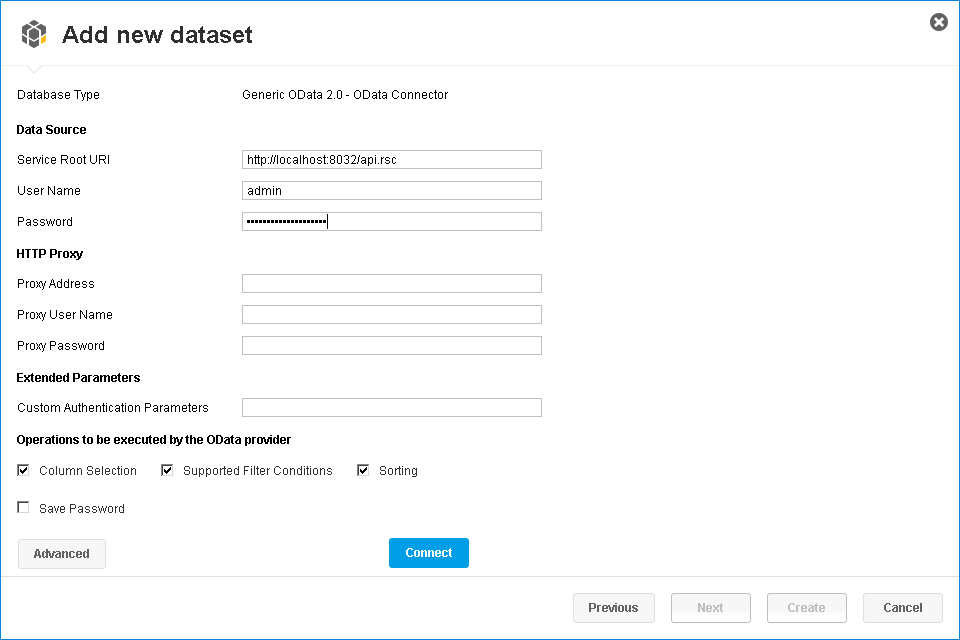
- In SAP Lumira, click File -> New -> Query with SQL. The Add New Dataset dialog is displayed.
- Expand the Generic section and click the Generic OData 2.0 Connector option.
-
In the Service Root URI box, enter the OData endpoint of the API Server. This URL will resemble the following:
https://your-server:8032/api.rsc -
In the User Name and Password boxes, enter the username and authtoken of an API user. These credentials will be used in HTTP Basic authentication.
![The OData endpoint and HTTP Basic authentication configured for an API user.]()
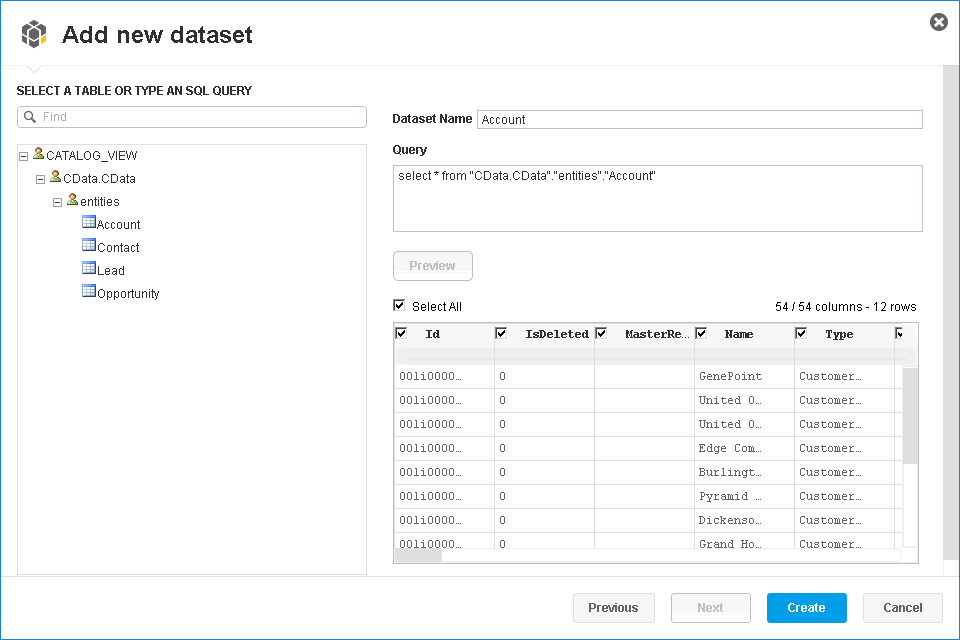
Select entities in the tree or enter an SQL query. This article imports Sage 50 UK TradingAccounts entities.
![Available entities for import. (Salesforce is shown.)]()
-
When you click Connect, SAP Lumira will generate the corresponding OData request and load the results into memory. You can then use any of the data processing tools available in SAP Lumira, such as filters, aggregates, and summary functions.
![Tables of Sage 50 UK data to be imported into SAP Lumira. (Salesforce Accounts are shown.)]()
Create Data Visualizations
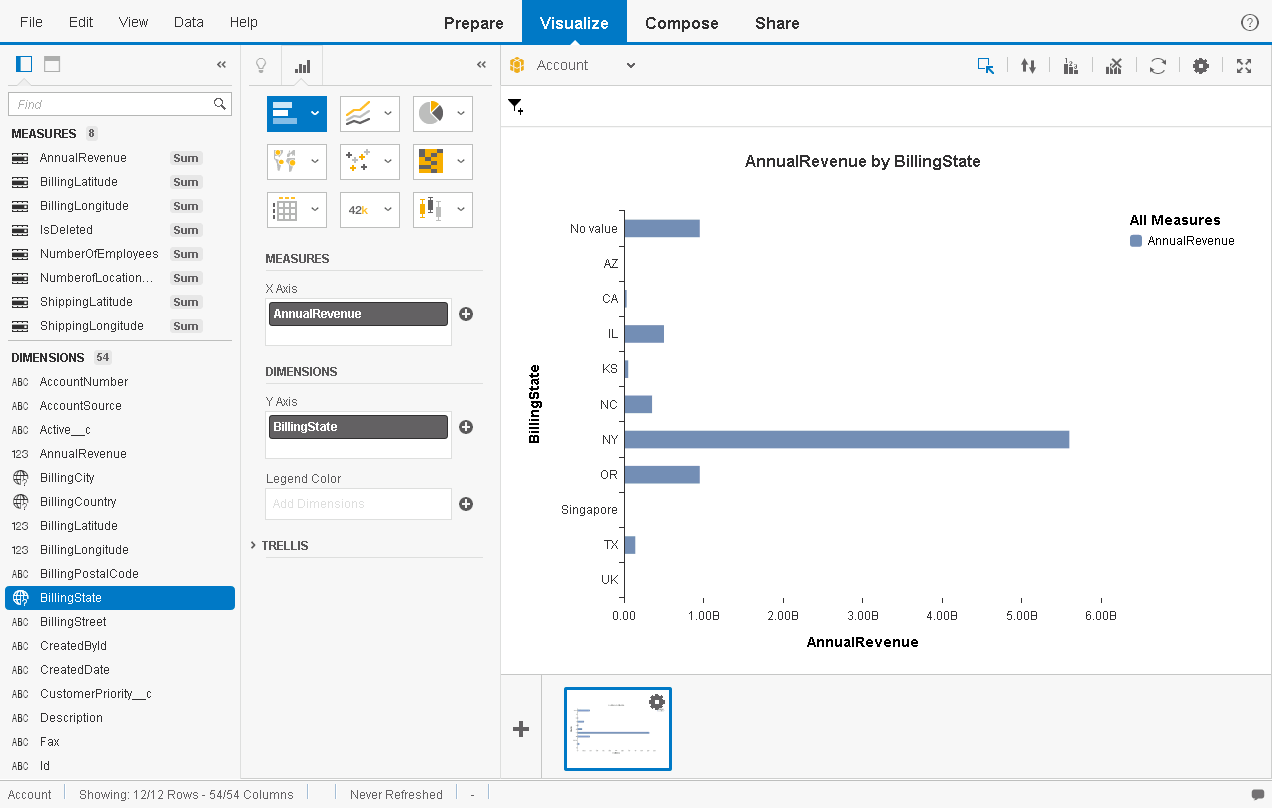
After you have imported the data, you can create data visualizations in the Visualize room. Follow the steps below to create a basic chart.
In the Measures and Dimensions pane, drag measures and dimensions onto the x-axis and y-axis fields in the Visualization Tools pane. SAP Lumira automatically detects dimensions and measures from the metadata service of the API Server.
By default, the SUM function is applied to all measures. Click the gear icon next to a measure to change the default summary.
- In the Visualization Tools pane, select the chart type.
- In the Chart Canvas pane, apply filters, sort by measures, add rankings, and update the chart with the current Sage 50 UK data.
![A basic line chart. (Salesforce is shown.)]()

